
How to Compare Asthma Estimates With Air Pollution in Python
On this page
Problem statement
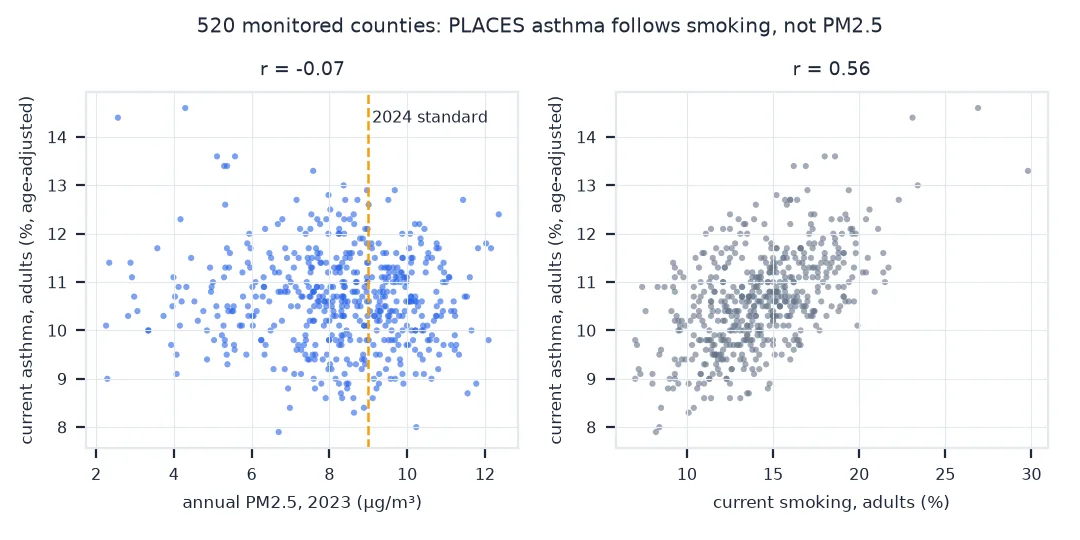
A natural question to ask of a county health map is whether it follows air pollution: are asthma rates higher where fine particulate matter (PM2.5) is higher? The data to try it are open and easy to join: the EPA publishes annual PM2.5 for every regulatory monitor, and CDC PLACES publishes adult asthma prevalence for every county. The join takes a few lines. Reading the result needs more care, because monitors cover only some counties, the monitor file has several rows per monitor, and the asthma estimates are produced by a model that knows nothing about air quality.
This page computes 2023 county PM2.5 from EPA monitors, joins it to PLACES 2025 adult asthma estimates, and shows what the correlation can and cannot say.
Quick answer
Keep one annual mean per monitor (complete, with exceptional events included), average monitors by county, and join on the county FIPS code:
pm = AQS[(AQS["Parameter Code"] == 88101) & (AQS["Pollutant Standard"] == "PM25 Annual 2024")
         & (AQS["Event Type"].isin(["No Events", "Events Included"])) & (AQS["Completeness Indicator"] == "Y")]
county_pm = pm.groupby("GEOID")["Arithmetic Mean"].mean().rename("pm25")
M = PLACES.join(county_pm, how="inner")
print(f"{pm.groupby(['GEOID', 'Site Num', 'POC']).ngroups} monitors → {len(county_pm)} counties; joined to PLACES: {len(M)}")
print(M.corr().loc[["pm25"], ["CASTHMA", "COPD", "CSMOKING", "OBESITY"]].round(2).to_string())
1157 monitors → 563 counties; joined to PLACES: 520
CASTHMA COPD CSMOKING OBESITY
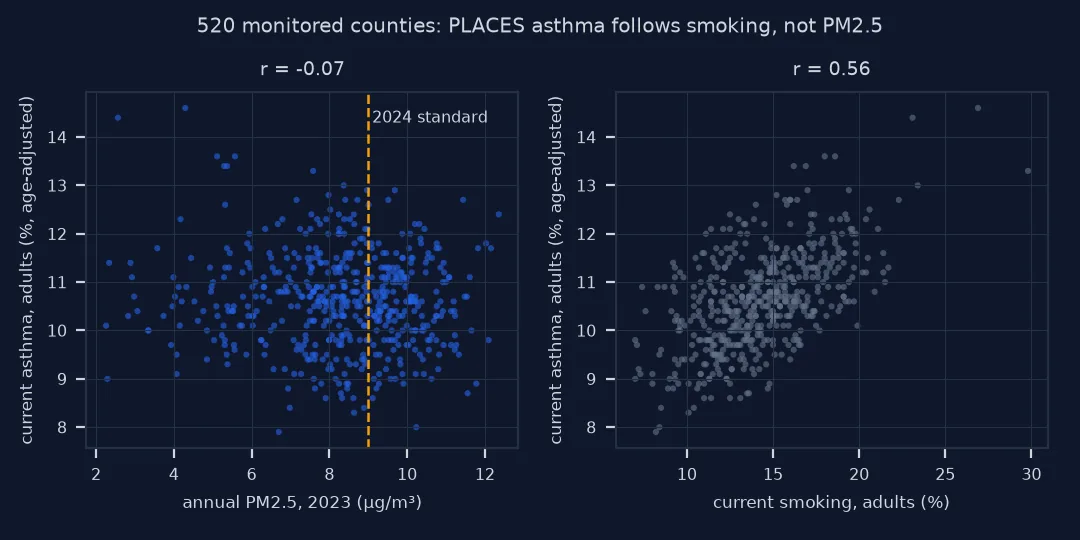
pm25 -0.07 0.13 0.15 0.29
The right rows, monitor coverage, a cautious correlation
1. Pick the right rows
The annual file repeats each monitor once for every pollutant standard, and for monitors affected by exceptional events, such as wildfire smoke, once with the events and once without:
pm_all = AQS[AQS["Parameter Code"] == 88101]
print(pm_all["Pollutant Standard"].value_counts().to_string())
print(pm_all[pm_all["Pollutant Standard"] == "PM25 Annual 2024"]["Event Type"].value_counts().to_string())
Pollutant Standard
PM25 24-hour 1997 3026
PM25 24-hour 2006 3026
PM25 24-hour 2012 3026
PM25 24-hour 2024 3026
PM25 Annual 1997 3026
PM25 Annual 2006 3018
PM25 Annual 2024 3015
PM25 Annual 2012 3011
Event Type
No Events 1245
Events Included 660
Concurred Events Excluded 557
Events Excluded 553
For health, the concentration people breathed is the one with events included; the version without them is for regulatory decisions. One standard's rows give one mean per monitor and instrument (POC).
2. Count what the monitors cover
pop = POPEST.set_index("GEOID").POPESTIMATE2023
print(f"counties with a complete PM2.5 monitor: {len(county_pm)} of {len(pop)}; "
      f"people living in them: {pop.reindex(county_pm.index).sum() / pop.sum():.1%}")
print(f"county PM2.5: median {county_pm.median():.1f} µg/m³; above the 2024 annual standard of 9.0: {(county_pm > 9.0).sum()} counties, "
      f"{pop.reindex(county_pm[county_pm > 9.0].index).sum() / 1e6:.0f} million people")
lost = pd.Series(sorted(set(county_pm.index) - set(PLACES.index))).str[:2].value_counts()
print("monitored counties with no PLACES estimate, by state code:", lost.to_dict())
print("states absent from PLACES county data:", sorted({g[:2] for g in POPEST.GEOID} - {g[:2] for g in PLACES.index}))
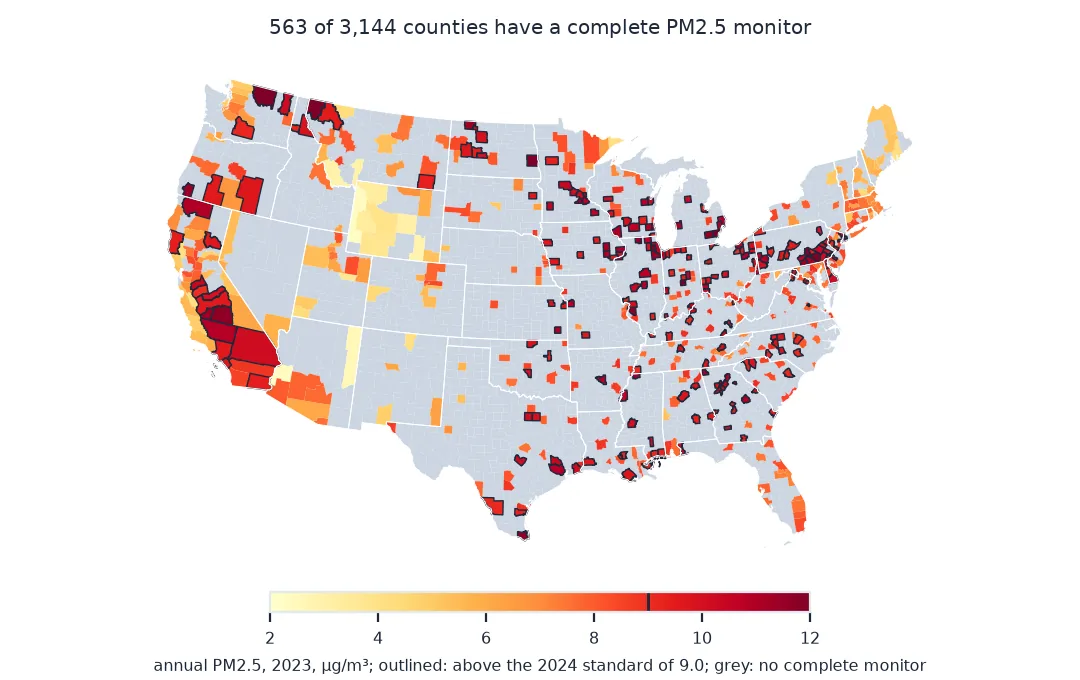
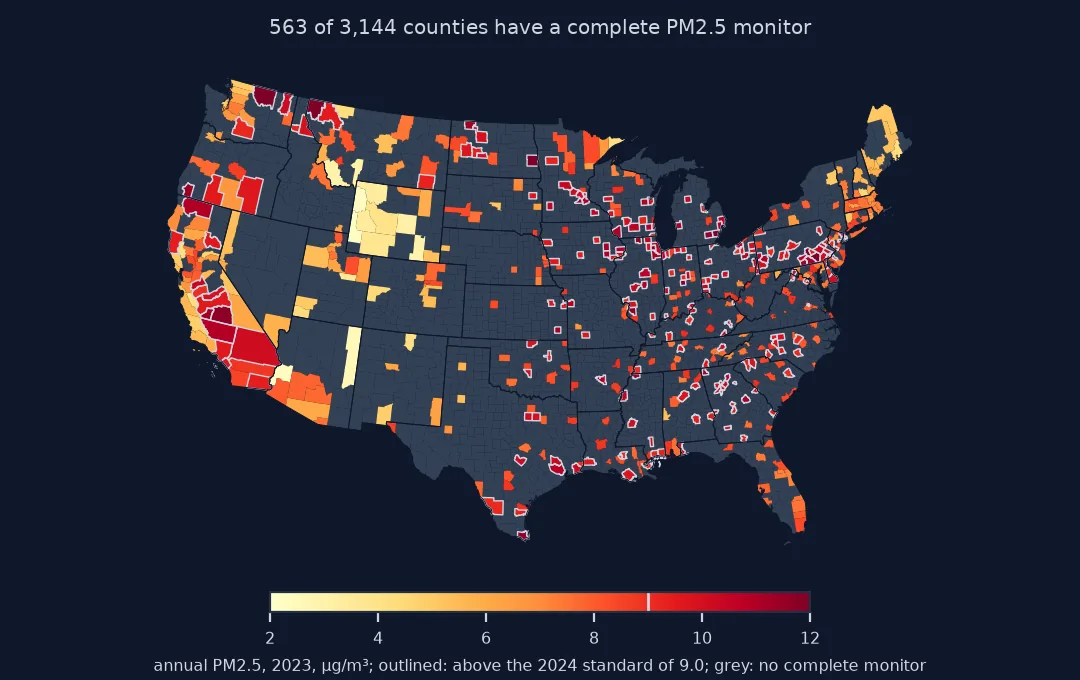
counties with a complete PM2.5 monitor: 563 of 3144; people living in them: 63.7%
county PM2.5: median 8.5 µg/m³; above the 2024 annual standard of 9.0: 226 counties, 108 million people
monitored counties with no PLACES estimate, by state code: {'42': 23, '21': 13, '09': 5, '72': 1, '80': 1}
states absent from PLACES county data: ['21', '42']
The 2025 PLACES release has no county estimates for Kentucky (21) or Pennsylvania (42). Connecticut's five monitored counties carry the old county codes in the EPA file, while PLACES uses the planning regions that replaced them (see why Connecticut goes missing); code 72 is Puerto Rico, and 80 is the EPA's code for monitors in Mexico.
3. Read the correlation for what it is
PLACES estimates are predictions from a small-area model. Its data sources, as the dataset's own description lists them, are the BRFSS survey, Census population estimates and the American Community Survey; air quality is not among them, so the estimates can follow PM2.5 only as far as demographics do. The same description warns that the model "cannot detect effects due to local interventions":
print(f"asthma against smoking: r = {M.CASTHMA.corr(M.CSMOKING):.2f}; against PM2.5: r = {M.CASTHMA.corr(M.pm25):.2f}")
hi = M[M.pm25 > 9.0]
print(f"adult asthma, age-adjusted: {hi.CASTHMA.mean():.1f}% in the {len(hi)} counties above 9.0 µg/m³, "
      f"{M[M.pm25 <= 9.0].CASTHMA.mean():.1f}% in the other {len(M) - len(hi)}")
asthma against smoking: r = 0.56; against PM2.5: r = -0.07
adult asthma, age-adjusted: 10.6% in the 196 counties above 9.0 µg/m³, 10.7% in the other 324
The comparison within one state
The data used on this page
The EPA's pre-generated annual concentration file for 2023 (annual_conc_by_monitor_2023.zip, Air Quality System), CDC PLACES county estimates from the 2025 release (swc5-untb, age-adjusted prevalence among adults, survey year 2023), and the Census Bureau's Vintage 2024 county population estimates.
import zipfile
from pathlib import Path

import numpy as np
import pandas as pd
import requests

Path("data").mkdir(exist_ok=True)
SRC = {"annual_conc_by_monitor_2023.zip": "https://aqs.epa.gov/aqsweb/airdata/annual_conc_by_monitor_2023.zip",
       "co-est2024-alldata.csv": "https://www2.census.gov/programs-surveys/popest/datasets/2020-2024/counties/totals/co-est2024-alldata.csv"}
for name, url in SRC.items():
    if not Path("data", name).exists():
        Path("data", name).write_bytes(requests.get(url, timeout=300).content)
AQS = pd.read_csv(zipfile.ZipFile("data/annual_conc_by_monitor_2023.zip").open("annual_conc_by_monitor_2023.csv"),
                  low_memory=False, dtype={"State Code": str, "County Code": str})
AQS["GEOID"] = AQS["State Code"].str.zfill(2) + AQS["County Code"].str.zfill(3)
rows = requests.get("https://data.cdc.gov/resource/swc5-untb.json", timeout=120, params={
    "$where": "datavaluetypeid = 'AgeAdjPrv' AND measureid in ('CASTHMA', 'COPD', 'CSMOKING', 'OBESITY')",
    "$select": "locationid, measureid, data_value", "$limit": 50000}).json()
PLACES = pd.DataFrame(rows).pivot(index="locationid", columns="measureid", values="data_value").astype(float)
est = pd.read_csv("data/co-est2024-alldata.csv", encoding="latin-1", dtype={"STATE": str, "COUNTY": str}).query("SUMLEV == 50")
POPEST = est.assign(GEOID=est.STATE + est.COUNTY)[["GEOID", "POPESTIMATE2023"]]
print(f"{len(AQS):,} rows in the annual file; PLACES: {len(PLACES)} counties")
82,887 rows in the annual file; PLACES: 2958 counties
Example 1: within one state
Comparing counties within a state removes state-level differences in the survey and the model:
M["state"] = M.index.str[:2]
by_state = M.groupby("state").filter(lambda d: len(d) >= 15).groupby("state").apply(
    lambda d: pd.Series({"counties": len(d), "r": d.CASTHMA.corr(d.pm25)}), include_groups=False)
print(f"states with 15 or more monitored counties: {len(by_state)}; within-state r from {by_state.r.min():.2f} to {by_state.r.max():.2f}, "
      f"median {by_state.r.median():.2f}")
states with 15 or more monitored counties: 13; within-state r from -0.50 to 0.52, median -0.14
Within states the correlation runs from clearly negative to clearly positive, with a median below zero: no consistent relationship, which is what a model without air quality in it should produce.
A near-zero correlation is not a null result
A near-zero correlation here is not evidence that air pollution does not cause asthma. The adult asthma estimate is a model prediction from survey responses about diagnosed asthma, carried to counties by population and American Community Survey data. It cannot respond to a county's air, because air is not among its inputs, and diagnosed asthma prevalence also reflects access to care and diagnosis. The effect of air pollution on asthma is established from studies that measure exposure and outcomes for the same people and days, such as emergency visits for asthma on high-pollution days.
The useful questions this join can answer are different: which counties with poor air quality also carry a high estimated burden of asthma, where monitors are missing, and how many people live in counties above a standard. For outcomes that do respond to air quality, use measured data, such as hospital or emergency department visits from a state's environmental public health tracking program.
Monitor coverage, instruments and years
- Monitor coverage: counties without a monitor are not "clean"; use modelled surfaces (such as EPA's downscaler or satellite-based estimates) for full coverage.
- Several monitors per county: averaging them is crude in large counties; population-weighted interpolation is better.
- Instruments: one site can have several instruments (POCs); this page averages all complete ones.
- Years: PLACES 2025 uses 2023 survey data, which matches 2023 PM2.5; long-term exposure would use several years.
- Child asthma: PLACES estimates adults; childhood asthma, more closely tied to air pollution, is not in it.
Internal links
- Why does my health map look like a poverty map? — what PLACES estimates are built from
- The ecological fallacy explained — county correlations and people
FAQ
Where can I get annual PM2.5 by county?
From the EPA's pre-generated Air Quality System files, which give annual statistics for each monitor; average complete monitors by county.
Does asthma prevalence follow air pollution in CDC PLACES?
Barely, and it should not be expected to: PLACES estimates are modelled from demographics and do not include air quality.
Which PM2.5 rows should I use from the EPA annual file?
One pollutant standard (for example PM25 Annual 2024), complete monitors, and for health purposes the rows with exceptional events included.
How many Americans live in counties with a PM2.5 monitor?
In 2023, counties with a complete PM2.5 monitor held about two thirds of the US population.