
Taxi Tips Are Zero for Cash Trips: Why Average Tips Come Out Wrong
On this page
Problem statement
Average the tip_amount column of New York's taxi records and passengers look stingy: an average tip of 18.3% of the fare across 2025. But the column is only filled when the tip goes through the card machine. Cash tips are never recorded, so every cash trip shows a tip of $0.00, and so do the flex-fare trips with payment type 0 and, as it turns out, many card trips from one meter vendor outside Manhattan. Mixing those in pulls the average down and makes any comparison between places, times or groups reflect how people paid rather than how they tipped. This page shows the size of the error and the fix.
Quick answer
Analyse tips on card trips only (payment_type = 1), as a share of the fare, and check the result by vendor and area before comparing places. On card trips the average tip in 2025 was 26.5% of the fare, not 18.3%.
t = con.sql("""select payment_type, count(*) as trips, avg(tip_amount) as mean_tip, avg((tip_amount > 0)::int) as tipped
               from trips where fare_amount > 0 group by 1 order by 1""").df()
t["share"] = t.trips / t.trips.sum()
print(t.round(3).to_string(index=False))
naive = con.sql("select avg(tip_amount / fare_amount) from trips where fare_amount > 0").fetchone()[0]
card = con.sql("select avg(tip_amount / fare_amount) from trips where fare_amount > 0 and payment_type = 1").fetchone()[0]
print(f"mean tip as a share of fare: all trips {naive:.1%}, card trips only {card:.1%}")
payment_type trips mean_tip tipped share
0 9561588 0.398 0.084 0.209
1 31052331 4.336 0.926 0.677
2 4456220 0.000 0.000 0.097
3 205542 0.010 0.003 0.004
4 576686 0.009 0.001 0.013
5 1 0.000 0.000 0.000
mean tip as a share of fare: all trips 18.3%, card trips only 26.5%
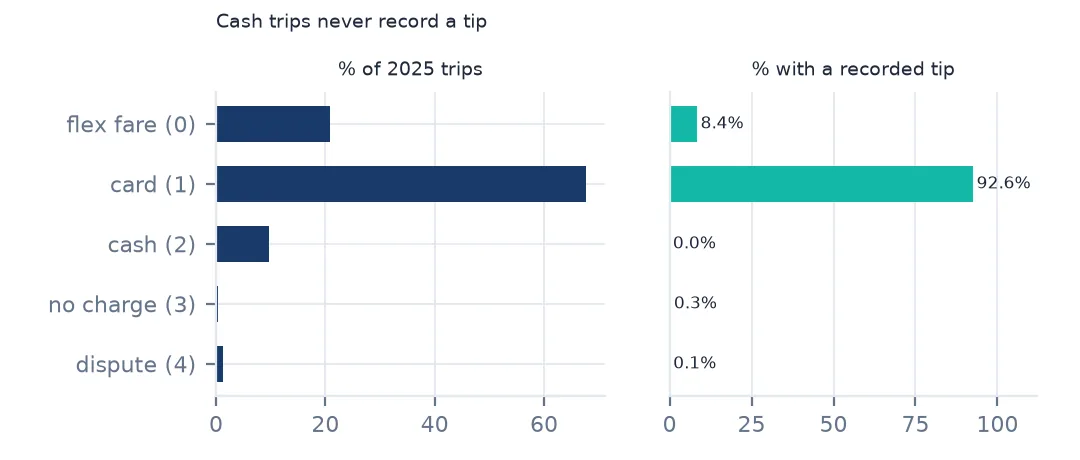
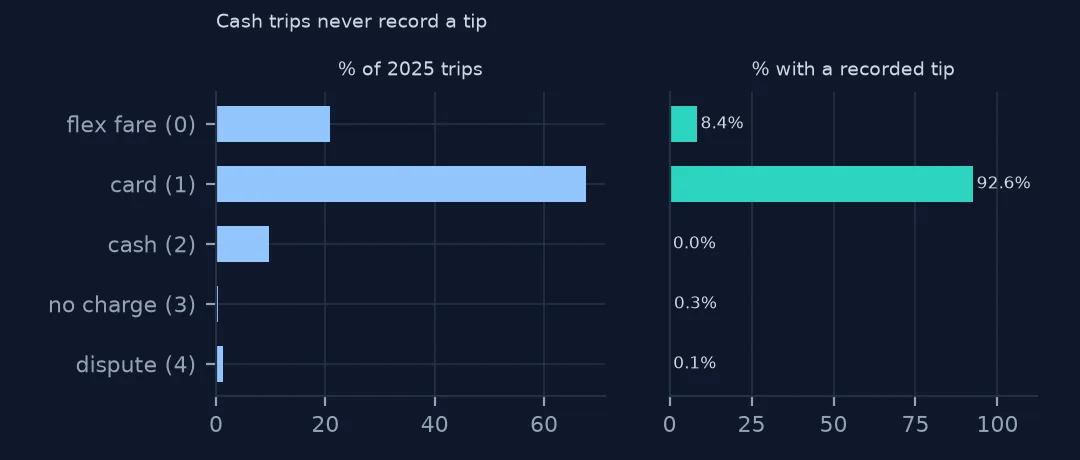
Card trips (type 1) are 67.7% of trips with a fare, and 92.6% of them carry a tip, averaging $4.34. Cash trips (9.7%) average $0.000: not one cash tip is in the data. Payment type 0, a fifth of trips, has tips on only 8.4%. Over all trips the average tip is 18.3% of the fare; over card trips it is 26.5%.
Which tips are recorded
1. Which payment types record tips
codes = {0: "flex fare / unknown", 1: "credit card", 2: "cash", 3: "no charge", 4: "dispute", 5: "unknown", 6: "voided"}
print({codes.get(int(r.payment_type), r.payment_type): f"{r.tipped:.2%} tipped" for r in t.itertuples()})
{'flex fare / unknown': '8.44% tipped', 'credit card': '92.63% tipped', 'cash': '0.01% tipped', 'no charge': '0.31% tipped', 'dispute': '0.09% tipped', 'unknown': '0.00% tipped'}
Only card payments record tips in any number. Cash shows 0.01% of trips with a tip — a handful of data-entry cases — and no-charge and disputed trips have essentially none, as you would expect.
2. Keep card trips for tip analysis
c = con.sql("""select tip_amount / fare_amount as rate from trips
               where payment_type = 1 and fare_amount >= 5 and tip_amount >= 0 using sample 2% (bernoulli, 7)""").df().rate
print(f"card trips sampled: {len(c):,}; no tip: {(c == 0).mean():.1%}; median rate {c.median():.1%}")
card trips sampled: 614,601; no tip: 7.4%; median rate 26.4%
In a 2% sample of card trips, 7.4% leave no tip and the median tip is 26.4% of the fare.
3. The screen's preset buttons
tot = con.sql("""select (tip_amount / (total_amount - tip_amount)) as r from trips
                 where payment_type = 1 and total_amount - tip_amount >= 5 and tip_amount > 0 using sample 2% (bernoulli, 7)""").df().r
near = {p: (tot.sub(p).abs() < 0.005).mean() for p in (0.15, 0.20, 0.25, 0.30)}
print("card tips within half a point of a preset, as a share of the amount before tip:", {f"{int(p * 100)}%": round(v, 3) for p, v in near.items()})
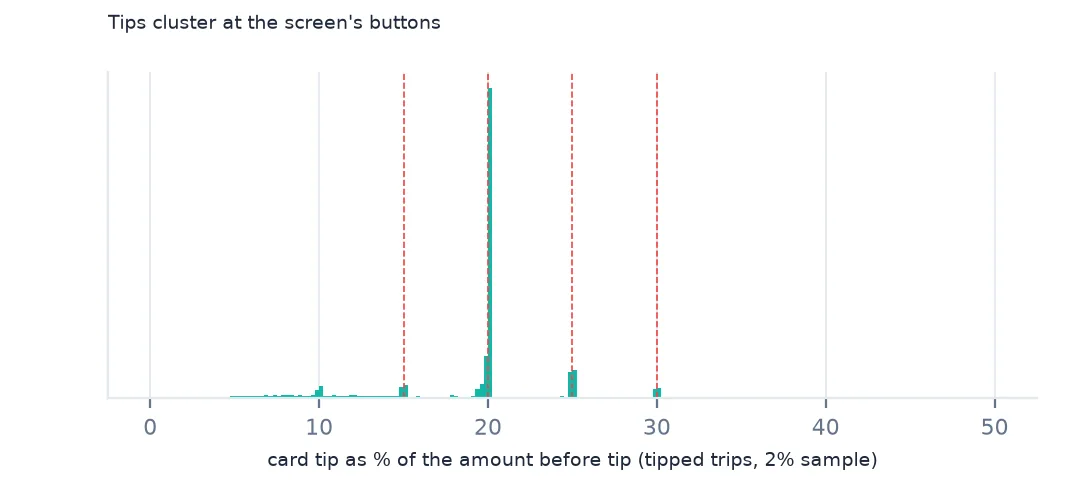
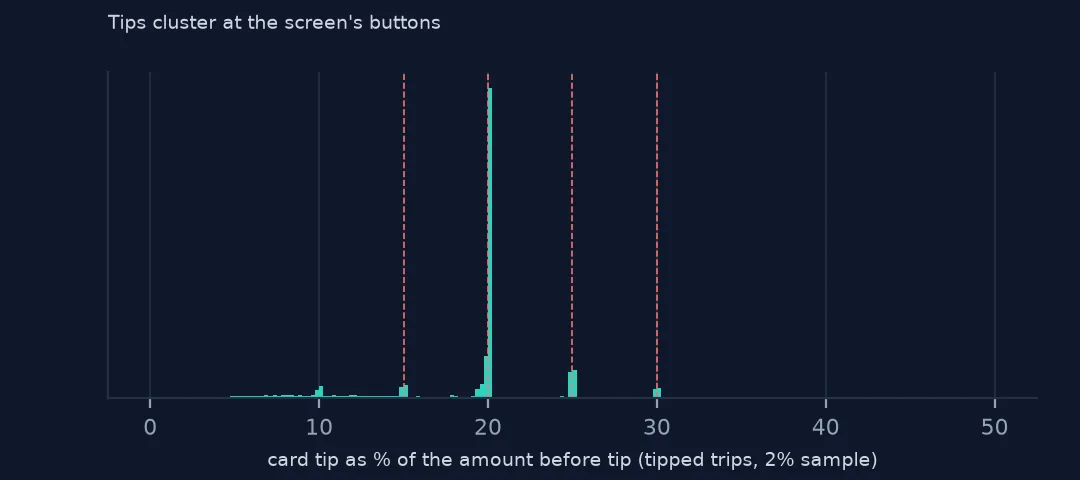
card tips within half a point of a preset, as a share of the amount before tip: {'15%': np.float64(0.044), '20%': np.float64(0.563), '25%': np.float64(0.085), '30%': np.float64(0.032)}
The card screen offers preset percentages of the amount before tip, and the data shows which one people press: 56.3% of card tips are within half a point of 20%, against 8.5% at 25% and 3.2% at 30%. Tips cluster at button values, so a tip "rate" is mostly a record of which button was pressed.
4. The cash share changes the average
m = con.sql("""select month(tpep_pickup_datetime) as m, avg((payment_type = 2)::int) as cash,
               avg(tip_amount) as all_trips, avg(tip_amount) filter (where payment_type = 1) as card
               from trips where fare_amount > 0 group by 1 order by 1""").df().set_index("m")
print(m.round(3).loc[[1, 6, 12]].to_string())
print(f"rank correlation across months of cash share with the all-trips mean tip: {m.cash.corr(m.all_trips, method='spearman'):+.2f}")
cash all_trips card
m
1 0.113 3.088 4.106
6 0.091 2.941 4.448
12 0.091 2.862 4.433
rank correlation across months of cash share with the all-trips mean tip: +0.04
The all-trips mean tip is well below the card mean in every month — $3.09 against $4.11 in January, $2.86 against $4.43 in December. The cash share moved little in 2025 (11.3% in January, 9.1% from June), so it barely explains the month-to-month changes (rank correlation +0.04); the gap is permanent rather than seasonal, and it is set by every unrecorded tip together.
Comparing places without the trap
The data used on this page
The NYC Taxi & Limousine Commission's yellow-taxi trip records for 2025. The TLC's data dictionary says it: "Cash tips are not included."
from pathlib import Path

import duckdb
import geopandas as gpd
import numpy as np
import pandas as pd
import requests

Path("data").mkdir(exist_ok=True)
TLC = "https://d37ci6vzurychx.cloudfront.net/trip-data/"
FILES = [f"yellow_tripdata_2025-{m:02d}.parquet" for m in range(1, 13)]
for name in FILES:
    if not Path(f"data/{name}").exists():
        with requests.get(TLC + name, stream=True, timeout=600) as r:      # 50-80 MB a month
            r.raise_for_status()
            with open(f"data/{name}", "wb") as f:
                for chunk in r.iter_content(1 << 20):
                    f.write(chunk)
# zones and lookup as the TLC served them on 15 October 2026 (it reissues them; the live copies are
# https://d37ci6vzurychx.cloudfront.net/misc/taxi_zones.zip and .../misc/taxi_zone_lookup.csv)
for name in ["nyc-taxi-zones-2026-10-15.zip", "nyc-taxi-zone-lookup-2026-10-15.csv"]:
    if not Path(f"data/{name}").exists():
        Path(f"data/{name}").write_bytes(requests.get(f"https://data.spatialworkflow.io/{name}", timeout=300).content)
zones = gpd.read_file("zip://data/nyc-taxi-zones-2026-10-15.zip!taxi_zones/taxi_zones.shp")    # EPSG:2263, feet
lookup = pd.read_csv("data/nyc-taxi-zone-lookup-2026-10-15.csv")

con = duckdb.connect()
con.sql("create view trips as select * from read_parquet('data/yellow_tripdata_2025-*.parquet', union_by_name = true)")
print(f"{con.sql('select count(*) from trips').fetchone()[0]:,} rows in trips; {len(zones)} zone polygons, {len(lookup)} lookup rows")
48,722,602 rows in trips; 263 zone polygons, 265 lookup rows
Example 1: tips by pickup borough, done right
b = con.sql("""select PULocationID as LocationID, avg(tip_amount / fare_amount) as rate, count(*) as n from trips
               where payment_type = 1 and fare_amount >= 5 and tip_amount >= 0 group by 1""").df().merge(lookup, on="LocationID")
print((b.groupby("Borough").apply(lambda g: (g.rate * g.n).sum() / g.n.sum(), include_groups=False)).round(3).to_dict())
con.register("lookup_df", lookup)
v = con.sql("""select l.Borough, t.VendorID, count(*) as n, avg((tip_amount > 0)::int) as tipped
               from trips t join lookup_df l on t.PULocationID = l.LocationID
               where payment_type = 1 and fare_amount >= 5 and tip_amount >= 0 and l.Borough in ('Bronx', 'Brooklyn', 'Manhattan')
                 and VendorID in (1, 2) group by 1, 2 order by 1, 2""").df()
print(v.round(3).to_string(index=False))
{'Bronx': 0.011, 'Brooklyn': 0.058, 'EWR': 0.12, 'Manhattan': 0.258, 'Queens': 0.204, 'Staten Island': 0.147, 'Unknown': 0.245}
Borough VendorID n tipped
Bronx 1 122010 0.005
Bronx 2 6104 0.669
Brooklyn 1 322929 0.047
Brooklyn 2 94914 0.875
Manhattan 1 5782096 0.914
Manhattan 2 20953679 0.953
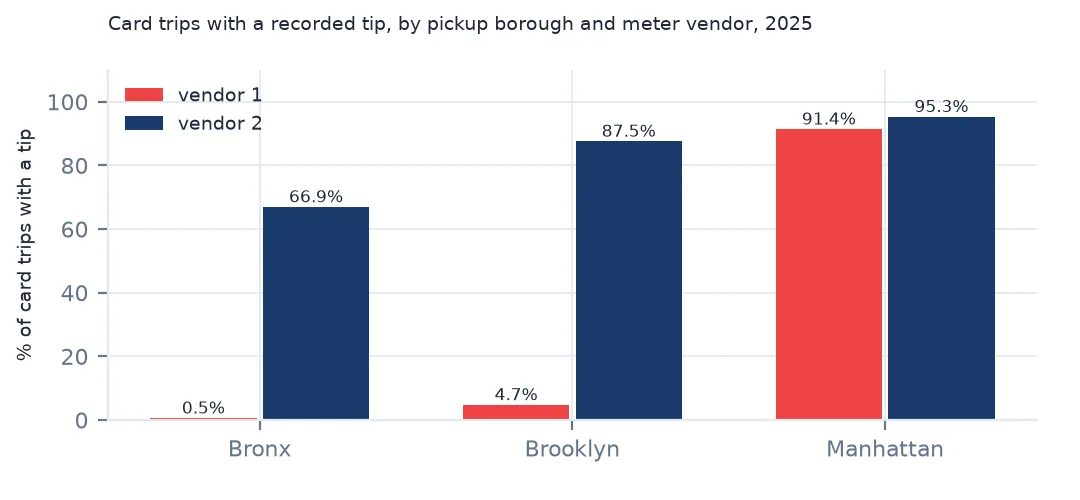
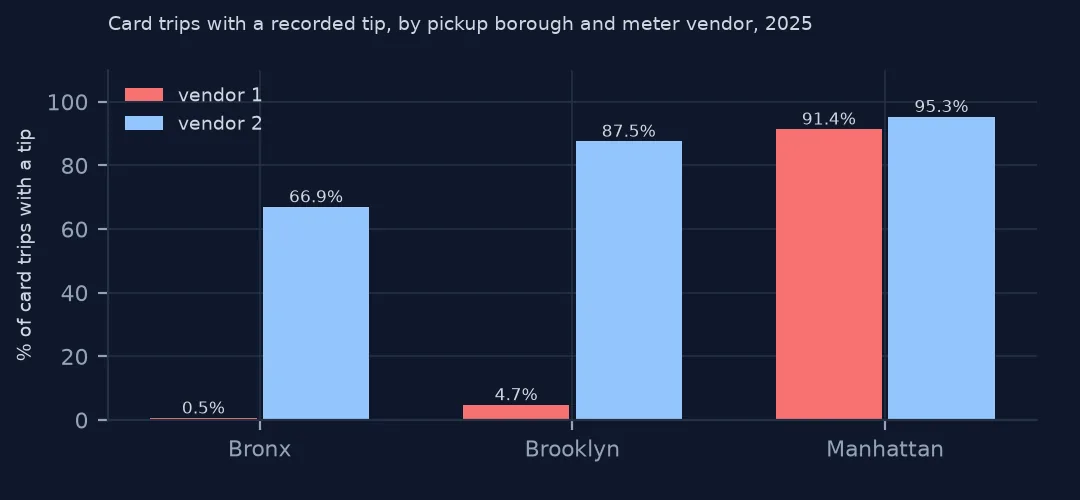
Even card-only, the boroughs look very different: 25.8% of the fare from Manhattan pickups, 20.4% from Queens, but 5.8% from Brooklyn and 1.1% from the Bronx. Split by vendor, the cause appears. In the Bronx, 122,010 card trips recorded by vendor 1 have a tip on 0.5% of them, while vendor 2's 6,104 have one on 66.9%; in Brooklyn the rates are 4.7% and 87.5%. In Manhattan both vendors record tips on more than nine trips in ten. Vendor 1's outer-borough card trips behave like trips whose tips are not recorded, and they make the outer boroughs look as if nobody tips.
Example 2: cash by borough
cb = con.sql("""select PULocationID as LocationID, avg((payment_type = 2)::int) as cash, count(*) as n from trips
                where payment_type in (1, 2) group by 1""").df().merge(lookup, on="LocationID")
print("cash share of card and cash trips:", (cb.groupby("Borough").apply(lambda g: (g.cash * g.n).sum() / g.n.sum(), include_groups=False)).round(3).to_dict())
cash share of card and cash trips: {'Bronx': 0.056, 'Brooklyn': 0.072, 'EWR': 0.062, 'Manhattan': 0.126, 'Queens': 0.181, 'Staten Island': 0.636, 'Unknown': 0.151}
Cash use differs by borough too: 63.6% of Staten Island's card-and-cash pickups are cash, 18.1% of Queens's and 12.6% of Manhattan's. An all-trips average tip would rank Staten Island lowest for that reason alone.
Why the tip column is incomplete
The tip field is filled by the meter system when the passenger adds a tip on the card screen. A cash tip is handed to the driver and never enters the system, so the TLC's dictionary states plainly that cash tips are not included. Any group with more cash payment, such as Staten Island's riders, will look as though it tips less, when the difference is in how the tip was paid.
The vendor split shows a second, undocumented gap of the same kind: one meter vendor's card trips outside Manhattan record almost no tips. Whatever the reason in that vendor's system, the effect on analysis is identical. The safe rule is to analyse tips only on card trips, and then to check that the rate is plausible within each vendor before comparing areas.
Other tip pitfalls
- Tip on fare or on total. The screen calculates on the amount before tip, including surcharges; a rate on the fare alone comes out higher.
- Negative tips. A few reversed rows carry negative tips; filter
tip_amount >= 0. - Flat fares. On the JFK flat fare the tip is a share of a fixed price; analyse airport trips separately.
- Ride-hail tips are recorded for every trip in the app, so comparing taxi and Uber tipping needs card-only taxi trips on one side.
Internal links
- Taxi trip records explained — payment types and fare parts
- Taxi trips with payment type 0 — the other payment-type trap
- How to analyse airport taxi trips — tips on airport trips
FAQ
Why are taxi tips zero for cash payments?
Cash tips go straight to the driver and are not entered into the meter, so the TLC records $0.00 for every cash trip.
What is the average taxi tip in New York?
On card trips in 2025, 26.5% of the fare on average and a median of 26.4%; most tippers press the 20% button.