
Taxi Trips With No Passenger Count or Rate Code: Payment Type 0
On this page
Problem statement
In recent yellow-taxi files a large block of rows has passenger_count, RatecodeID, store_and_fwd_flag and congestion_surcharge all empty, and a payment_type of 0 — a code older data dictionaries did not list. In 2025 that is 11,611,894 trips, 23.8% of the year. Code written for earlier years either crashes on the nulls, silently drops the rows in a filter such as passenger_count > 0, or counts them in averages where their empty fields become zeros. This page shows what the rows are, how fast they have grown, and how to handle them for each kind of analysis.
Quick answer
Payment type 0 marks flex-fare trips, booked through an app at a price quoted upfront. They are real trips with real times, zones and fares; keep them for counts and flows, and leave them out of anything that uses the passenger count, rate code, surcharges or tips.
p0 = con.sql("""select payment_type = 0 as p0, count(*) as n,
                avg((passenger_count is null)::int) as no_passengers, avg((RatecodeID is null)::int) as no_ratecode,
                avg((congestion_surcharge is null)::int) as no_surcharge, avg((store_and_fwd_flag is null)::int) as no_flag
                from trips where tpep_pickup_datetime >= '2025-01-01' group by 1 order by 1""").df()
print(p0.round(3).to_string(index=False))
print(f"payment type 0 in 2025: {p0.n.iloc[1] / p0.n.sum():.1%} of trips")
p0 n no_passengers no_ratecode no_surcharge no_flag
False 37110681 0.0 0.0 0.0 0.0
True 11611894 1.0 1.0 1.0 1.0
payment type 0 in 2025: 23.8% of trips
In every one of the 11,611,894 payment-type-0 rows of 2025, all four fields are empty, and in no other row is any of them empty. The pattern is not random missing data but a different kind of record.
What the rows are
1. Growing month by month
m = con.sql("""select strftime(tpep_pickup_datetime, '%Y-%m') as ym, avg((payment_type = 0)::int) as p0 from trips
               where tpep_pickup_datetime >= '2024-01-01' and tpep_pickup_datetime < '2026-01-01' group by 1 having count(*) > 1000 order by 1""").df()
print(m.set_index("ym").p0.round(3).to_dict())
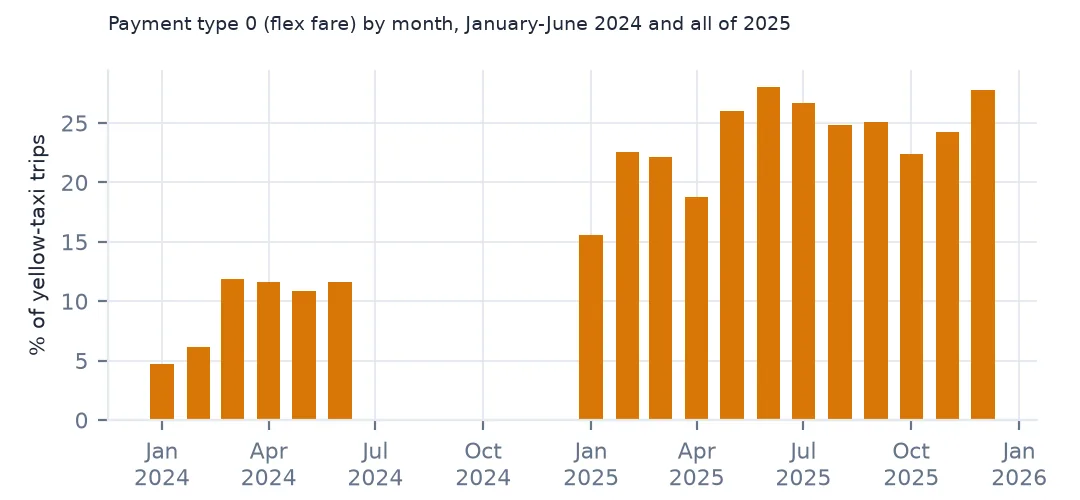
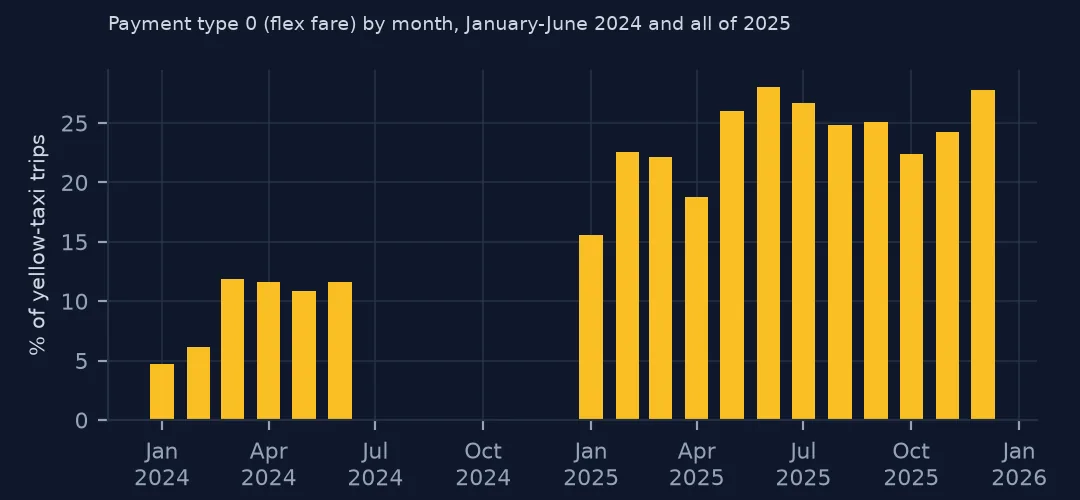
{'2024-01': 0.047, '2024-02': 0.062, '2024-03': 0.119, '2024-04': 0.116, '2024-05': 0.109, '2024-06': 0.116, '2025-01': 0.155, '2025-02': 0.226, '2025-03': 0.221, '2025-04': 0.188, '2025-05': 0.261, '2025-06': 0.281, '2025-07': 0.266, '2025-08': 0.248, '2025-09': 0.251, '2025-10': 0.224, '2025-11': 0.243, '2025-12': 0.278}
The share has grown steadily: 4.7% of trips in January 2024, 11.6% by June 2024, 15.5% in January 2025 and 27.8% in December 2025. A comparison of any field across these months is also a comparison of how many trips lack it.
2. Which vendors send them
v = con.sql("""select VendorID, avg((payment_type = 0)::int) as p0, count(*) as n from trips
               where tpep_pickup_datetime >= '2025-01-01' group by 1 order by 1""").df()
print(v.round(3).to_string(index=False))
VendorID p0 n
1 0.165 9586873
2 0.259 38575819
6 1.000 23982
7 0.000 535901
Vendor 2 (Curb) sends payment type 0 on 25.9% of its trips and vendor 1 on 16.5%; vendor 6 sends nothing else, vendor 7 never. The code follows the booking app and meter system the trip came through.
3. Fares and distances look different
d = con.sql("""select payment_type = 0 as p0, median(fare_amount) as fare, median(trip_distance) as miles,
               quantile_cont(trip_distance, 0.99) as p99_miles, max(trip_distance) as max_miles,
               avg(tip_amount) as tip from trips where tpep_pickup_datetime >= '2025-01-01' group by 1 order by 1""").df()
print(d.round(2).to_string(index=False))
p0 fare miles p99_miles max_miles tip
False 13.50 1.70 20.04 186967.57 3.63
True 16.15 2.52 15.93 397994.37 0.33
Payment-type-0 trips are longer (a median of 2.52 miles against 1.70) and cost more ($16.15 against $13.50), which fits app bookings from beyond the Manhattan core. Their recorded tip averages $0.33 against $3.63, because a flex-fare tip is not reliably in this column. Both kinds of trip have absurd maximum distances (397,994 and 186,968 miles), so the distance filter is needed either way.
4. Decide per analysis, and say so
uses = {"trip counts": "keep", "pickup and drop-off zones": "keep", "passengers per trip": "drop (null)",
        "tips": "drop (no tip field filled)", "speeds": "drop or check distances"}
for k, v in uses.items():
    print(f"{k:28s} {v}")
trip counts keep
pickup and drop-off zones keep
passengers per trip drop (null)
tips drop (no tip field filled)
speeds drop or check distances
A single global filter does not work: dropping the rows removes most of the growth of the market, keeping them turns their nulls into zeros in averages. Decide per measure and write the decision next to the result.
What dropping them does
The data used on this page
The NYC Taxi & Limousine Commission's yellow-taxi trip records for January–June 2024 and all of 2025. The TLC's 2025 data dictionary lists payment type 0 as "Flex Fare trip"; flex fares are prices quoted upfront when a taxi is booked through an app.
from pathlib import Path

import duckdb
import geopandas as gpd
import numpy as np
import pandas as pd
import requests

Path("data").mkdir(exist_ok=True)
TLC = "https://d37ci6vzurychx.cloudfront.net/trip-data/"
FILES = [f"yellow_tripdata_{y}-{m:02d}.parquet" for y, ms in [(2024, range(1, 7)), (2025, range(1, 13))] for m in ms]
for name in FILES:
    if not Path(f"data/{name}").exists():
        with requests.get(TLC + name, stream=True, timeout=600) as r:      # 50-80 MB a month
            r.raise_for_status()
            with open(f"data/{name}", "wb") as f:
                for chunk in r.iter_content(1 << 20):
                    f.write(chunk)
# zones and lookup as the TLC served them on 15 October 2026 (it reissues them; the live copies are
# https://d37ci6vzurychx.cloudfront.net/misc/taxi_zones.zip and .../misc/taxi_zone_lookup.csv)
for name in ["nyc-taxi-zones-2026-10-15.zip", "nyc-taxi-zone-lookup-2026-10-15.csv"]:
    if not Path(f"data/{name}").exists():
        Path(f"data/{name}").write_bytes(requests.get(f"https://data.spatialworkflow.io/{name}", timeout=300).content)
zones = gpd.read_file("zip://data/nyc-taxi-zones-2026-10-15.zip!taxi_zones/taxi_zones.shp")    # EPSG:2263, feet
lookup = pd.read_csv("data/nyc-taxi-zone-lookup-2026-10-15.csv")

con = duckdb.connect()
con.sql("create view trips as select * from read_parquet(['data/yellow_tripdata_2024-0[1-6].parquet', 'data/yellow_tripdata_2025-*.parquet'], union_by_name = true)")
print(f"{con.sql('select count(*) from trips').fetchone()[0]:,} rows in trips; {len(zones)} zone polygons, {len(lookup)} lookup rows")
69,054,695 rows in trips; 263 zone polygons, 265 lookup rows
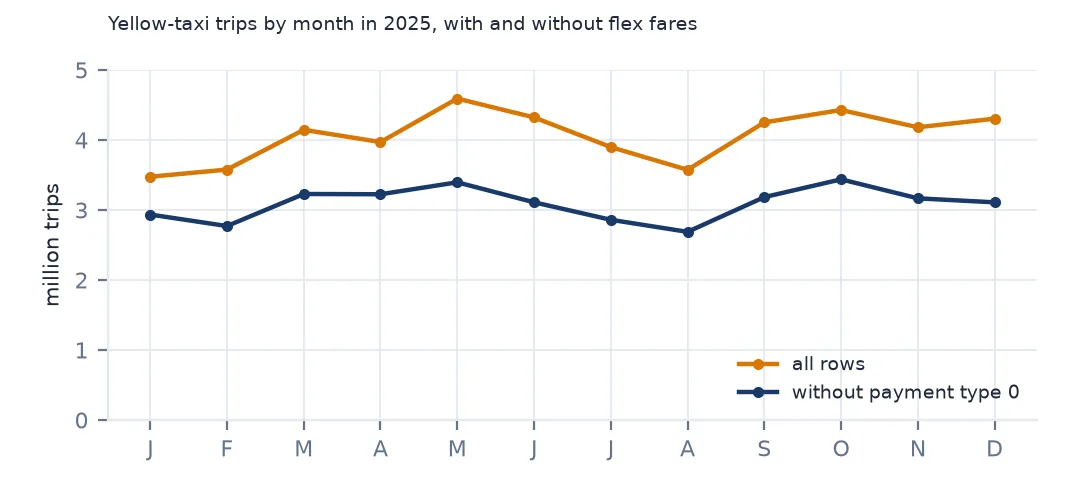
Example 1: what dropping them does to a count
c = con.sql("""select month(tpep_pickup_datetime) as m, count(*) as all_rows, count(*) filter (where payment_type <> 0) as without_p0
               from trips where tpep_pickup_datetime >= '2025-01-01' group by 1 order by 1""").df().set_index("m")
print(f"trips in 2025: {c.all_rows.sum():,} in all, {c.without_p0.sum():,} once payment type 0 is dropped")
print(f"growth January to December: {c.all_rows.iloc[-1] / c.all_rows.iloc[0] - 1:+.1%} counting all rows, "
      f"{c.without_p0.iloc[-1] / c.without_p0.iloc[0] - 1:+.1%} without")
trips in 2025: 48,722,575 in all, 37,110,681 once payment type 0 is dropped
growth January to December: +23.9% counting all rows, +5.9% without
Counting all rows, yellow-taxi trips grew 23.9% from January to December 2025; dropping payment type 0 the growth is 5.9%. The extra growth is entirely app-booked trips — a real change in the taxi business that the filter would hide.
Example 2: where flex-fare trips start
z = con.sql("""select PULocationID as LocationID, avg((payment_type = 0)::int) as p0, count(*) as n from trips
               where tpep_pickup_datetime >= '2025-01-01' group by 1""").df().merge(lookup, on="LocationID")
print("payment type 0 share by pickup borough:", (z.groupby("Borough").apply(lambda g: (g.p0 * g.n).sum() / g.n.sum(), include_groups=False)).round(3).to_dict())
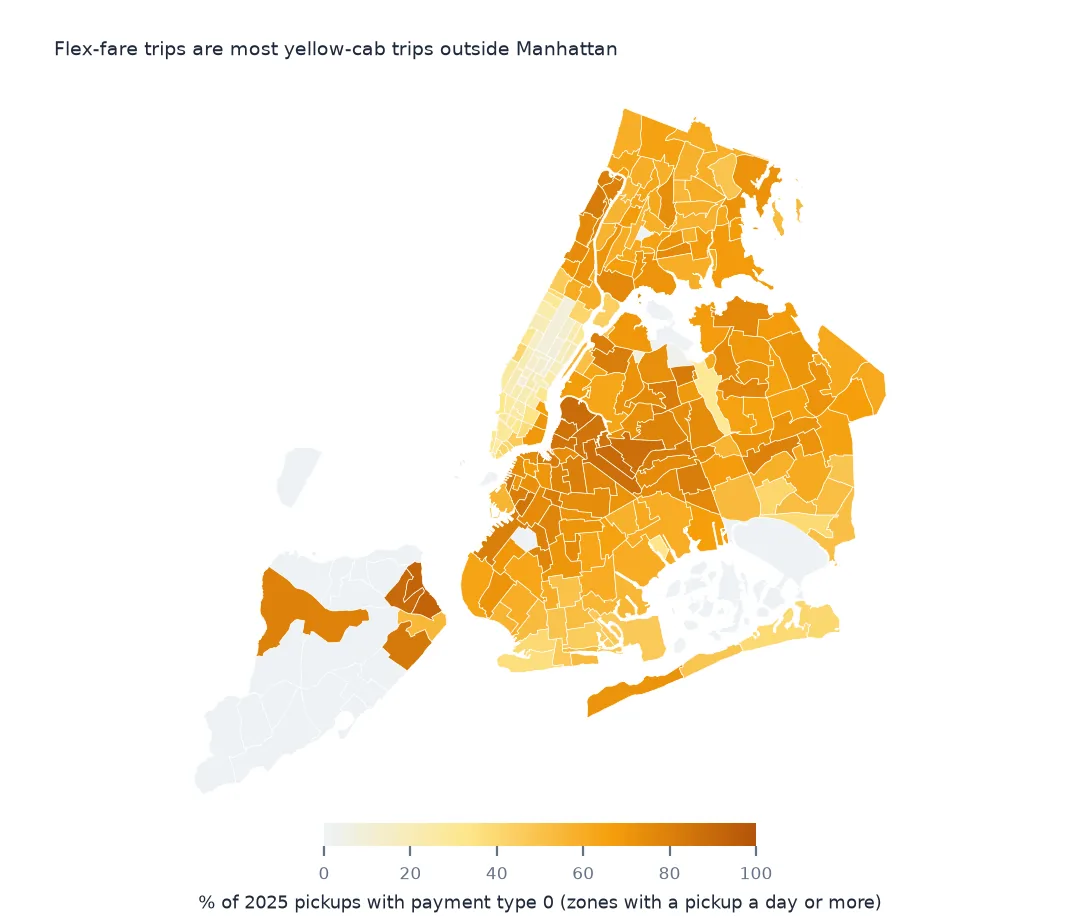
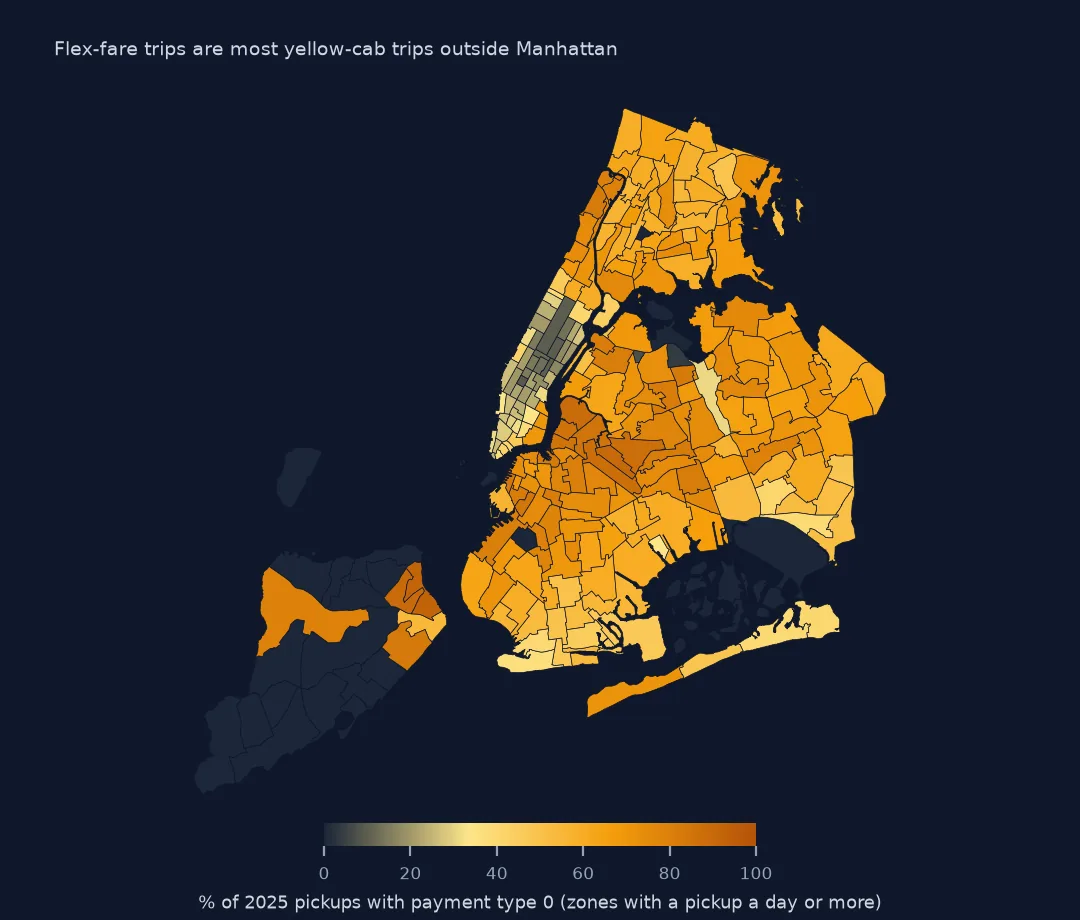
payment type 0 share by pickup borough: {'Bronx': 0.632, 'Brooklyn': 0.735, 'EWR': 0.003, 'Manhattan': 0.222, 'Queens': 0.172, 'Staten Island': 0.756, 'Unknown': 0.032}
Outside Manhattan, flex fares are most yellow-taxi trips: 75.6% of pickups on Staten Island, 73.5% in Brooklyn and 63.2% in the Bronx, against 22.2% in Manhattan and 17.2% in Queens. Drop them and the outer boroughs lose most of their taxi trips.
Flex fares and the trip record
The TLC introduced upfront "flex fare" pricing for app-booked yellow taxis at the end of 2023: the passenger is quoted a price before the ride, as with ride-hail, rather than paying what the meter shows. The trip still has a meter record, but the fields describing the metered fare's terms — rate code, passenger count entered on the meter, surcharges as separate items, payment method at the end — are not filled. The 2025 data dictionary lists payment type 0 as "Flex Fare trip".
The growth in the data tracks the uptake of app bookings. That makes payment type 0 one of the more interesting columns in the file, not a cleaning nuisance: it shows yellow cabs competing with Uber and Lyft on their own terms, especially outside Manhattan.
Pitfalls with these rows
- Hidden filters.
passenger_count > 0orRatecodeID = 1silently removes every flex-fare trip; check row counts after each filter. - Nulls in sums. DuckDB and pandas skip nulls in
sumandavg, butfillna(0)turns them into zero surcharges and zero passengers. - Fare composition. Their totals do not equal the sum of the parts, because the surcharge columns are empty.
- Older years. Before 2024 payment type 0 is rare, so long time series need the same rule applied throughout.
Internal links
- Taxi trip records explained — every field
- Taxi tips are zero for cash trips — the other payment-type trap
- How to compare Uber and Lyft with yellow taxis — app-booked trips in the high-volume file
FAQ
What is payment type 0 in NYC taxi data?
A flex-fare trip, priced upfront through an app. In 2025 it was 23.8% of yellow-taxi trips.
Why is passenger_count null in the taxi data?
Because the trip is a flex fare: on every payment-type-0 row in 2025, the passenger count, rate code, store-and-forward flag and congestion surcharge are empty.