
How to Compare Uber and Lyft with Yellow Taxis Using TLC High-Volume Data
On this page
Problem statement
Since 2019 the TLC has published every Uber and Lyft trip in New York in a "high-volume for-hire vehicle" file, alongside the yellow-taxi records. Together they show how the market divides — where each service picks up, at what hours, at what price per mile — and the ride-hail file has fields the taxi file lacks: when the ride was requested, when the car arrived and what the driver was paid. The two files have different column names, units and conventions, so a comparison needs care. This guide puts June 2025's 19,868,009 ride-hail trips beside the month's yellow-taxi trips.
Quick answer
Read both Parquet files with DuckDB and compare like with like: trip_miles and base_passenger_fare in the high-volume file against trip_distance and fare_amount in the yellow file, each before tips and surcharges. Licence HV0003 is Uber and HV0005 is Lyft.
cmp = con.sql("""
    select hvfhs_license_num as who, count(*) as trips, median(trip_miles) as miles,
           median(base_passenger_fare) as fare, median(base_passenger_fare / nullif(trip_miles, 0)) as fare_per_mile
    from hv where trip_miles > 0 group by 1
    union all
    select 'yellow', count(*), median(trip_distance), median(fare_amount), median(fare_amount / nullif(trip_distance, 0))
    from y where trip_distance > 0 and fare_amount > 0 and payment_type <> 0
    order by who""").df()
cmp["who"] = cmp.who.replace({"HV0003": "Uber", "HV0005": "Lyft"})
print(cmp.round(2).to_string(index=False))
print(f"ride-hail share of these June 2025 trips: {cmp[cmp.who != 'yellow'].trips.sum() / cmp.trips.sum():.1%}")
who trips miles fare fare_per_mile
Uber 14165137 3.08 20.53 6.52
Lyft 5700372 2.96 19.17 6.32
yellow 2999263 1.74 13.50 7.29
ride-hail share of these June 2025 trips: 86.9%
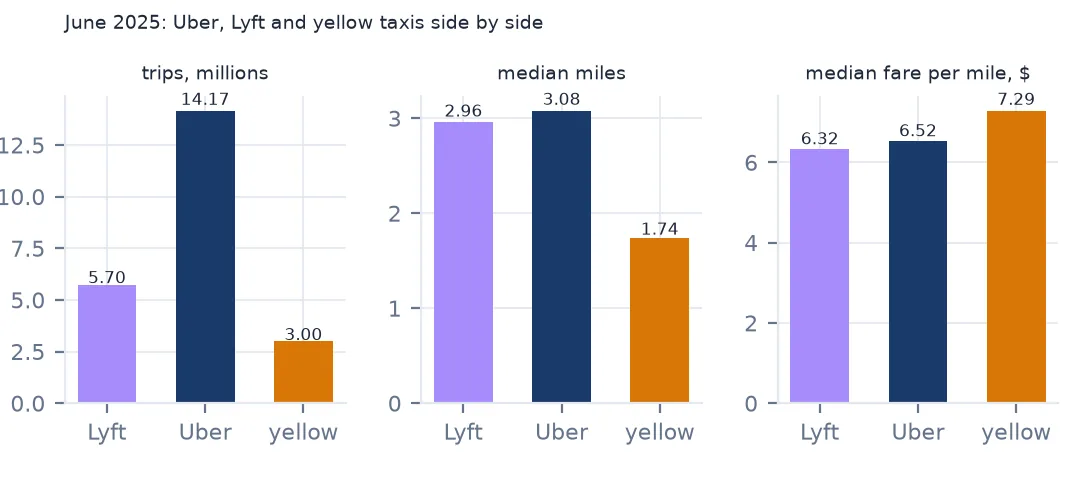
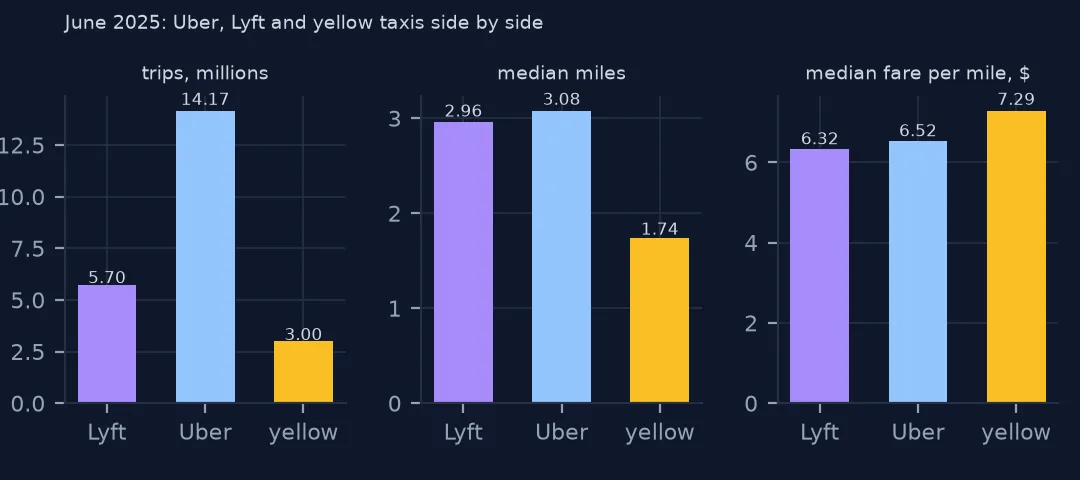
In June 2025 Uber made 14,165,137 trips, Lyft 5,700,372 and yellow taxis 2,999,263 (counting trips with a distance, a fare and a payment type): ride-hail had 86.9% of these trips. Ride-hail trips are longer (a median of 3.08 miles for Uber against 1.74 for a taxi) and cost more per trip, but less per mile — $6.52 for Uber and $6.32 for Lyft against $7.29 for a taxi — because short trips cost more per mile on any tariff.
Comparing two kinds of record
1. Different files, different columns
print("high-volume columns:", len(con.sql("describe hv").df()), "| yellow columns:", len(con.sql("describe y").df()))
print("only in the high-volume file:", [c for c in con.sql("describe hv").df().column_name if c in
      ("request_datetime", "on_scene_datetime", "driver_pay", "shared_request_flag", "wav_request_flag")])
high-volume columns: 25 | yellow columns: 20
only in the high-volume file: ['request_datetime', 'on_scene_datetime', 'driver_pay', 'shared_request_flag', 'wav_request_flag']
The high-volume file has 25 columns against the yellow file's 20, including the request time, the time the car arrived, the driver's pay and flags for shared and wheelchair-accessible requests. It has no payment type and no tip-by-cash problem: tips are paid in the app and recorded.
2. Market share by zone
z = con.sql("""select z, sum(hv) as hv, sum(yt) as yt from (
                 select PULocationID as z, count(*) as hv, 0 as yt from hv group by 1
                 union all select PULocationID, 0, count(*) from y where payment_type <> 0 group by 1) group by 1""").df()
z = z[z.z < 264].merge(lookup, left_on="z", right_on="LocationID")
z["taxi_share"] = z.yt / (z.yt + z.hv)
print("yellow share of pickups by borough:", (z.groupby("Borough").yt.sum() / z.groupby("Borough")[["yt", "hv"]].sum().sum(axis=1)).round(3).to_dict())
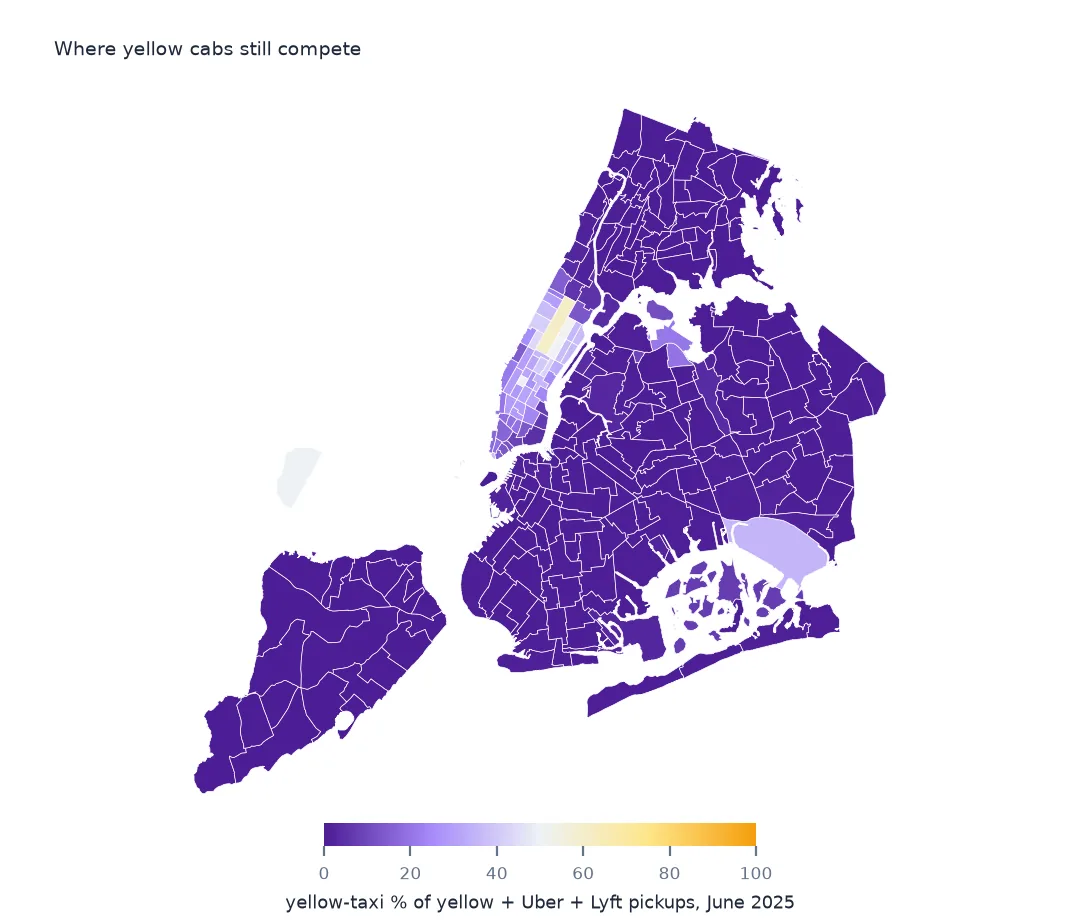
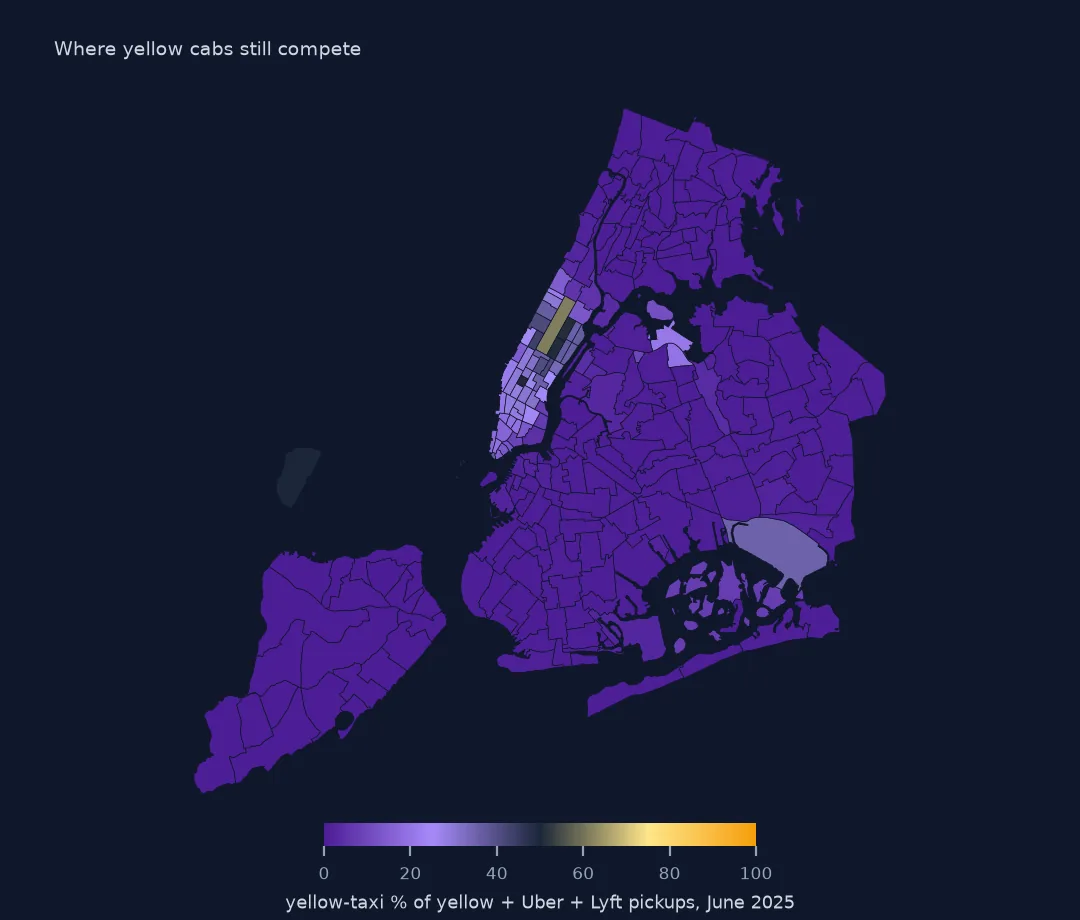
print(f"zones where yellow cabs have most pickups: {(z.taxi_share > 0.5).sum()} of {len(z)}")
yellow share of pickups by borough: {'Bronx': 0.003, 'Brooklyn': 0.006, 'EWR': 1.0, 'Manhattan': 0.276, 'Queens': 0.072, 'Staten Island': 0.0}
zones where yellow cabs have most pickups: 4 of 261
Yellow cabs take 27.6% of pickups in Manhattan, 7.2% in Queens (where the airports are), 0.6% in Brooklyn and 0.3% in the Bronx. In only 4 of 261 zones do yellow cabs make most of the pickups. Outside Manhattan the market is almost entirely ride-hail.
3. Waiting for the car
w = con.sql("""select hvfhs_license_num as who, median(epoch(on_scene_datetime - request_datetime)) / 60 as wait_min,
               quantile_cont(epoch(on_scene_datetime - request_datetime) / 60, 0.9) as p90
               from hv where on_scene_datetime is not null group by 1 order by 1""").df()
w["who"] = w.who.replace({"HV0003": "Uber", "HV0005": "Lyft"})
print(w.round(2).to_string(index=False))
print(f"trips with no on-scene time: {con.sql('select avg((on_scene_datetime is null)::int) from hv').fetchone()[0]:.1%}")
who wait_min p90
Uber 3.35 8.1
Lyft 4.02 8.6
trips with no on-scene time: 0.0%
From request to car on scene took a median of 3.35 minutes for Uber and 4.02 for Lyft; one request in ten waited more than about 8 minutes on either. Every trip in the June file has an on-scene time, so the wait can be measured for all of them — something the taxi file, with no request time, cannot do.
4. What the driver gets
pay = con.sql("""select hvfhs_license_num as who, sum(driver_pay) / sum(base_passenger_fare + tolls + bcf + sales_tax
                 + congestion_surcharge + coalesce(airport_fee, 0) + coalesce(cbd_congestion_fee, 0)) as driver_share,
                 sum(driver_pay) / sum(trip_time / 3600) as pay_per_trip_hour
                 from hv where base_passenger_fare > 0 group by 1 order by 1""").df()
pay["who"] = pay.who.replace({"HV0003": "Uber", "HV0005": "Lyft"})
print(pay.round(3).to_string(index=False))
who driver_share pay_per_trip_hour
Uber 0.635 65.073
Lyft 0.647 60.591
Drivers received 63.5% of what Uber passengers paid before tips, and 64.7% on Lyft. Per hour of passenger trip time, pay was $65.07 on Uber and $60.59 on Lyft — an upper bound on hourly earnings, because drivers also spend time waiting and driving to pickups, which the file does not record.
Hours and accessible rides
The data used on this page
The NYC Taxi & Limousine Commission's trip records for June 2025: the high-volume for-hire vehicle file (Uber and Lyft, licence numbers HV0003 and HV0005) and the yellow-taxi file; and the TLC's taxi zones.
from pathlib import Path

import duckdb
import geopandas as gpd
import numpy as np
import pandas as pd
import requests

Path("data").mkdir(exist_ok=True)
TLC = "https://d37ci6vzurychx.cloudfront.net/trip-data/"
FILES = ['fhvhv_tripdata_2025-06.parquet', 'yellow_tripdata_2025-06.parquet']
for name in FILES:
    if not Path(f"data/{name}").exists():
        with requests.get(TLC + name, stream=True, timeout=600) as r:      # 50-80 MB a month; the high-volume file is 490 MB
            r.raise_for_status()
            with open(f"data/{name}", "wb") as f:
                for chunk in r.iter_content(1 << 20):
                    f.write(chunk)
# zones and lookup as the TLC served them on 15 October 2026 (it reissues them; the live copies are
# https://d37ci6vzurychx.cloudfront.net/misc/taxi_zones.zip and .../misc/taxi_zone_lookup.csv)
for name in ["nyc-taxi-zones-2026-10-15.zip", "nyc-taxi-zone-lookup-2026-10-15.csv"]:
    if not Path(f"data/{name}").exists():
        Path(f"data/{name}").write_bytes(requests.get(f"https://data.spatialworkflow.io/{name}", timeout=300).content)
zones = gpd.read_file("zip://data/nyc-taxi-zones-2026-10-15.zip!taxi_zones/taxi_zones.shp")    # EPSG:2263, feet
lookup = pd.read_csv("data/nyc-taxi-zone-lookup-2026-10-15.csv")

con = duckdb.connect()
con.sql("create view hv as select * from read_parquet('data/fhvhv_tripdata_2025-06.parquet', union_by_name = true)")
con.sql("create view y as select * from read_parquet('data/yellow_tripdata_2025-06.parquet', union_by_name = true)")
print(f"{con.sql('select count(*) from hv').fetchone()[0]:,} rows in hv; {len(zones)} zone polygons, {len(lookup)} lookup rows")
print(f"{con.sql('select count(*) from y').fetchone()[0]:,} rows in y; {len(zones)} zone polygons, {len(lookup)} lookup rows")
19,868,009 rows in hv; 263 zone polygons, 265 lookup rows
4,322,960 rows in y; 263 zone polygons, 265 lookup rows
Example 1: the hours each serves
hh = con.sql("""select h, sum(hv) as hv, sum(yt) as yt from (
                select hour(pickup_datetime) as h, count(*) as hv, 0 as yt from hv group by 1
                union all select hour(tpep_pickup_datetime), 0, count(*) from y where payment_type <> 0 group by 1) group by 1 order by 1""").df().set_index("h")
sh = hh.yt / (hh.yt + hh.hv)
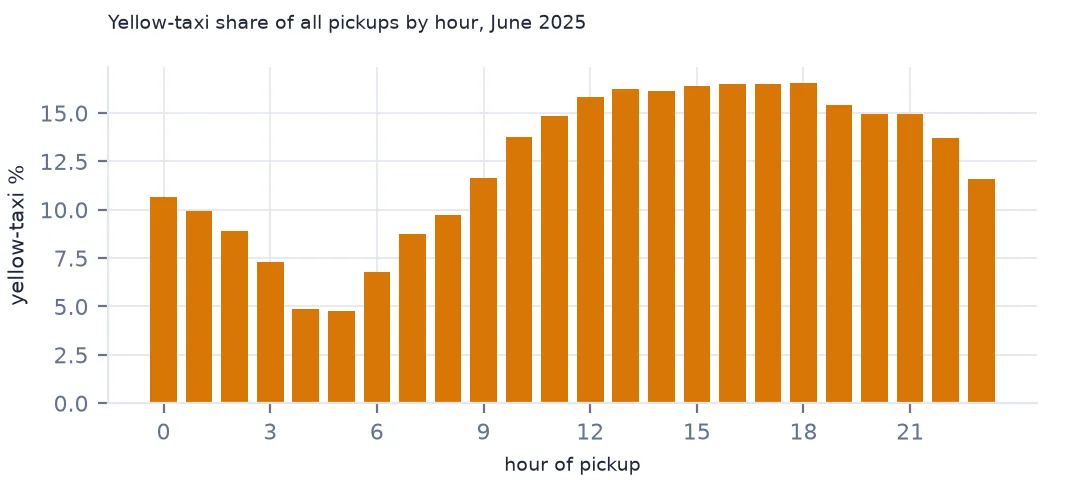
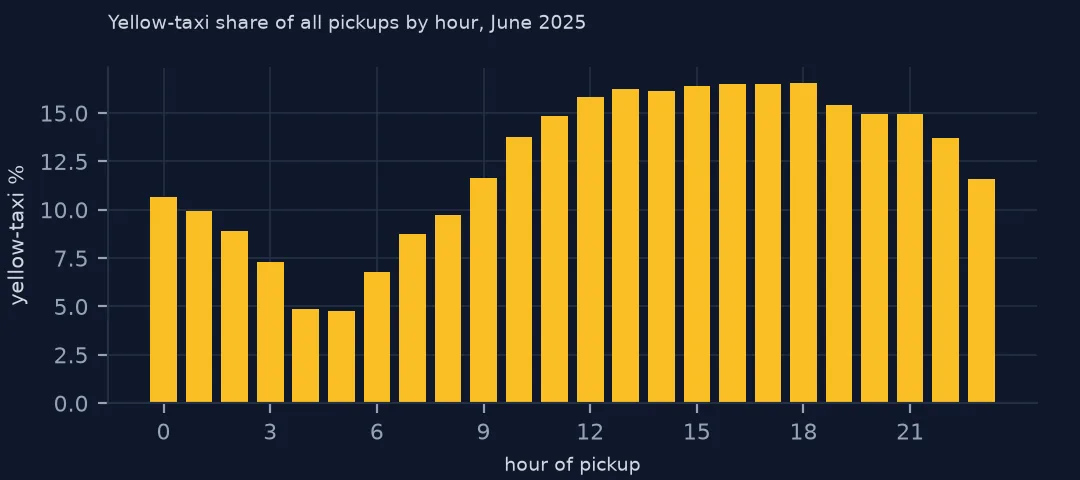
print(f"yellow share of pickups: highest {sh.max():.1%} at {sh.idxmax()}:00, lowest {sh.min():.1%} at {sh.idxmin()}:00")
yellow share of pickups: highest 16.5% at 18:00, lowest 4.7% at 5:00
The yellow share of pickups is highest at 18:00 (16.5%), when Manhattan workers leave the office, and lowest at 5:00 (4.7%).
Example 2: wheelchair-accessible requests
wav = con.sql("""select count(*) filter (where wav_request_flag = 'Y') as requested,
                 avg((wav_match_flag = 'Y')::int) filter (where wav_request_flag = 'Y') as matched from hv""").df().iloc[0]
print(f"wheelchair-accessible requests in June 2025: {wav.requested:,.0f}; served by an accessible vehicle: {wav.matched:.1%}")
wheelchair-accessible requests in June 2025: 61,917; served by an accessible vehicle: 100.0%
61,917 trips in June 2025 were requested in a wheelchair-accessible vehicle, and the file records an accessible vehicle on 100.0% of them. The file holds only completed trips, so requests that were never served do not appear, and this is not a measure of how many requests were met.
Two services, two record systems
Yellow taxis are hailed on the street or at ranks and metered; ride-hail trips are booked in an app and priced upfront. The records reflect that: the taxi file comes from meters and records payment at the end, the ride-hail file from the companies' dispatch systems and records the request, the match, the arrival and the split of the fare. Comparisons are fair for what both record — pickup and drop-off zones, times, distance, the base fare — and for little else.
The market picture is clear in June 2025: ride-hail carries most trips everywhere except a handful of Manhattan zones and the airports' taxi ranks, and its trips are longer. The yellow cab's niche is the short Manhattan trip, hailed rather than booked.
Differences that trip up comparisons
- Column names.
trip_milesagainsttrip_distance,base_passenger_fareagainstfare_amount,pickup_datetimeagainsttpep_pickup_datetime. trip_timeis in seconds. The yellow file has no duration column; compute it from the two timestamps.- File size. One month of the high-volume file is several times the size of the yellow one; read only the columns you need, which DuckDB does automatically.
- Other for-hire vehicles. Black cars, livery and smaller app companies are in a separate FHV file with fewer fields; the high-volume file holds only the companies the TLC licenses as high-volume.
Internal links
- How to analyse NYC taxi trip records — the yellow-taxi side
- Taxi trip records explained — yellow-taxi fields
- How to measure how many people live near a bike-share station — another shared-mobility service by zone
FAQ
How many Uber and Lyft trips are there in New York?
In June 2025, 14,165,137 Uber and 5,700,372 Lyft trips, against 2,999,263 yellow-taxi trips with a recorded fare.
Is Uber cheaper than a taxi in New York?
Per mile before tips and surcharges, yes in June 2025: $6.52 for Uber against $7.29 for a yellow taxi, though the median Uber trip was longer and cost more in total.