
311 Requests Closed Before They Were Created: Impossible Dates
On this page
Problem statement
Subtract created_date from closed_date in New York's 311 data and some results are negative: requests closed hours or days before anyone made them. Others are exactly zero, closed in the same second they arrived. Both distort any response-time statistic — negatives pull averages down, zeros make agencies look instant — and both have explanations in how agencies record their work. This page counts them in the 311,856 closed requests from July 2025, finds which agencies and complaint types produce them, and sets out a cleaning rule that keeps them visible.
Quick answer
Classify every request as open, negative, zero or ok before computing durations, compute statistics on the ok rows, and report the other counts beside the result. Do not clip negatives to zero: that hides them inside the fastest responses.
dur = (july.closed_date - july.created_date).dt.total_seconds()
print(f"July 2025 requests with a closed date: {july.closed_date.notna().sum():,}")
print(f"closed before created: {(dur < 0).sum():,}; closed in the same second: {(dur == 0).sum():,}; within one minute: {((dur > 0) & (dur < 60)).sum():,}")
print("negative durations by agency:", july[dur < 0].agency.value_counts().head(5).to_dict())
July 2025 requests with a closed date: 311,856
closed before created: 64; closed in the same second: 9,276; within one minute: 722
negative durations by agency: {'DOT': 58, 'DSNY': 6}
Of 311,856 closed July requests, 64 were closed before they were created and 9,276 in the same second; another 722 closed within a minute. The negatives come almost entirely from the transportation department (58) and sanitation (6).
Finding and handling impossible durations
1. How negative
neg = (dur[dur < 0] / 3600)
print(neg.describe(percentiles=[0.1, 0.5, 0.9]).round(2).to_string())
count 64.00
mean -119.42
std 82.16
min -312.03
10% -312.00
50% -96.02
90% -48.00
max -1.55
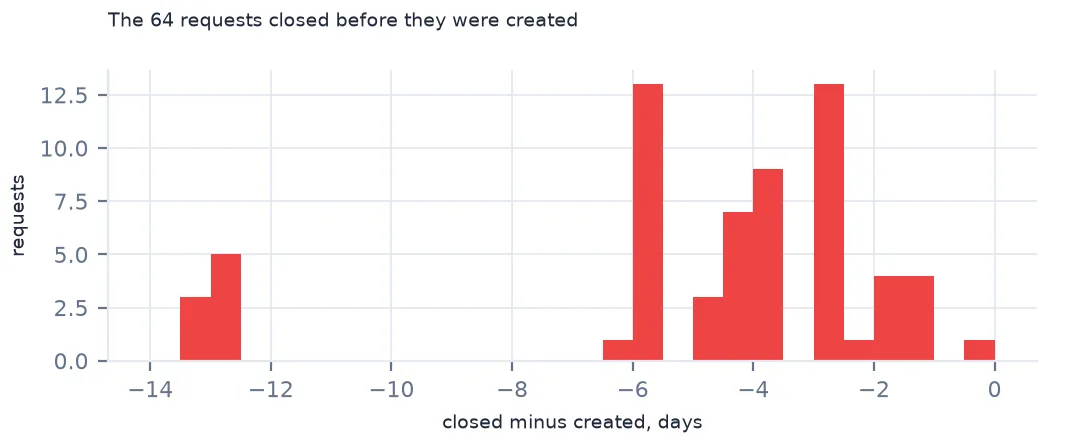
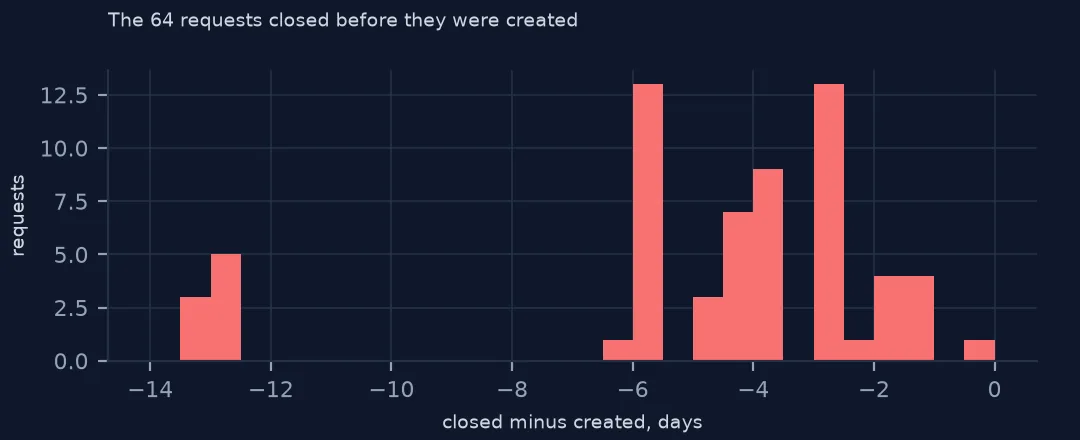
The negative durations are not rounding errors: the median is −96 hours, four days before creation, and the most negative are −312 hours, thirteen days. The smallest is −1.55 hours.
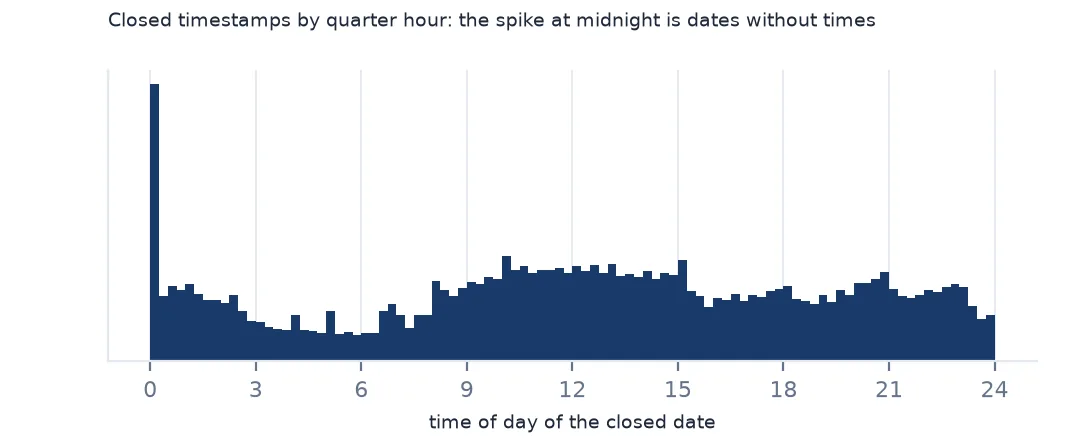
2. Dates at midnight
mid = july.closed_date.dt.time == pd.Timestamp("00:00:00").time()
print(f"closed dates exactly at midnight: {mid.mean():.1%}; among negative durations: {mid[dur < 0].mean():.1%}")
print(f"created dates exactly at midnight: {(july.created_date.dt.time == pd.Timestamp('00:00:00').time()).mean():.1%}")
closed dates exactly at midnight: 3.2%; among negative durations: 9.4%
created dates exactly at midnight: 0.1%
3.2% of closed dates fall exactly at midnight, against 0.1% of created dates; among the negative durations the share is 9.4%. A closed date entered as a day without a time lands at midnight, and if the work was recorded against an earlier date — the day a street light was already scheduled for repair — the close precedes the request.
3. Which complaint types
t = july[dur < 0].complaint_type.value_counts()
print("negative-duration requests by type:", t.head(5).to_dict())
print(f"share of each type's closed requests: {(t / july[july.closed_date.notna()].complaint_type.value_counts()).dropna().sort_values(ascending=False).head(3).round(3).to_dict()}")
negative-duration requests by type: {'Street Light Condition': 57, 'Graffiti': 6, 'Street Condition': 1}
share of each type's closed requests: {'Street Light Condition': 0.022, 'Graffiti': 0.004, 'Street Condition': 0.0}
Street light conditions account for 57 of the 64 negatives — 2.2% of all closed street-light requests — with graffiti and one street condition. The likeliest explanation is requests that join existing work orders: a light already reported and fixed, closed with the date of the earlier repair.
4. Clean and keep a flag
july["dur_h"] = dur / 3600
july["date_flag"] = np.select([july.closed_date.isna(), dur < 0, dur == 0], ["open", "negative", "zero"], "ok")
print(july.date_flag.value_counts().to_dict())
print(f"median hours to close, flagged rows dropped: {july.loc[july.date_flag == 'ok', 'dur_h'].median():.2f}; "
      f"with negatives clipped to 0: {july.dur_h.clip(lower=0).median():.2f}")
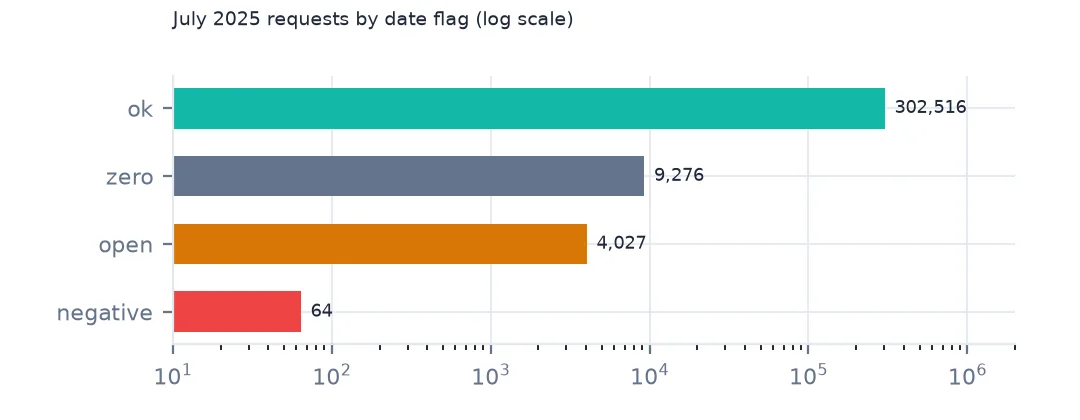
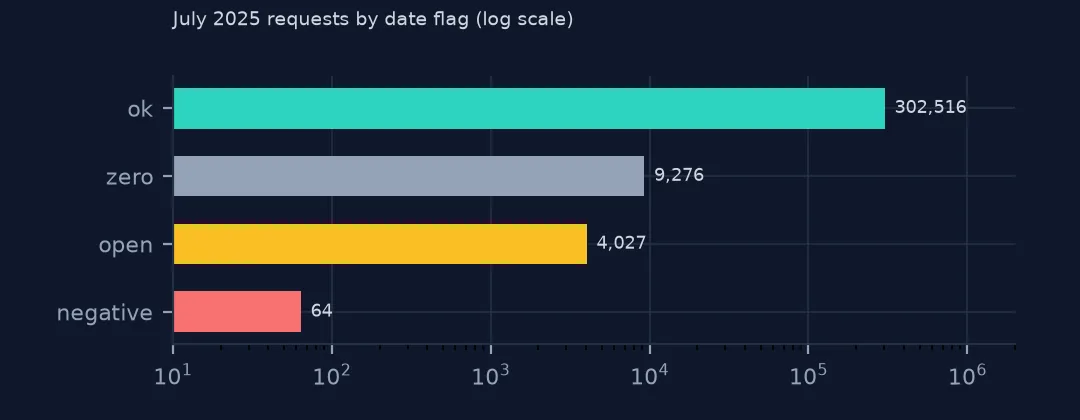
{'ok': 302516, 'zero': 9276, 'open': 4027, 'negative': 64}
median hours to close, flagged rows dropped: 5.39; with negatives clipped to 0: 4.62
The flag splits July into 302,516 usable durations, 9,276 zero, 4,027 open and 64 negative. The median of the usable ones is 5.39 hours; clipping negatives to zero and keeping the zeros would give 4.62 — a faster-looking city produced by bad rows.
Other date checks
The data used on this page
NYC 311 requests created in July 2025 (NYC Open Data, saved copy of 15 October 2026).
from pathlib import Path

import geopandas as gpd
import numpy as np
import pandas as pd
import requests

Path("data").mkdir(exist_ok=True)
# NYC 311 Service Requests (NYC Open Data, dataset erm2-nwe9) as queried on 15 October 2026 and saved on this site,
# because requests that are still open keep changing: every request created in July 2025, and the 2025 daily counts by
# agency, complaint type, borough and channel. The queries are in data/README.txt; the live API is
# https://data.cityofnewyork.us/resource/erm2-nwe9.csv
FILES = ["nyc-311-2025-daily-counts-2026-10-15.zip", "nyc-311-2025-07-requests-2026-10-15.zip", "nyc-census-2020-by-geography-2026-10-15.xlsx"]
for name in FILES:
    if not Path(f"data/{name}").exists():
        Path(f"data/{name}").write_bytes(requests.get(f"https://data.spatialworkflow.io/{name}", timeout=600).content)
daily = pd.read_csv("data/nyc-311-2025-daily-counts-2026-10-15.zip", parse_dates=["day"])
july = pd.read_csv("data/nyc-311-2025-07-requests-2026-10-15.zip", low_memory=False,
                   dtype={"unique_key": str, "incident_zip": str, "bbl": str, "community_board": str},
                   parse_dates=["created_date", "closed_date", "resolution_action_updated_date"])
cen = pd.read_excel("data/nyc-census-2020-by-geography-2026-10-15.xlsx", sheet_name="2010, 2020, and Change", skiprows=3)
boro_pop = cen[cen.GeoType == "Boro"].assign(b=lambda d: d.Name.str.upper()).set_index("b").Pop_20
print(f"NYC 311: {daily.n.sum():,} requests in the 2025 daily counts; {len(july):,} requests created in July 2025")
NYC 311: 3,655,042 requests in the 2025 daily counts; 315,883 requests created in July 2025
Example 1: resolution updates before creation
ru = (july.resolution_action_updated_date - july.created_date).dt.total_seconds()
print(f"resolution action updated before created: {(ru < 0).sum():,}; after closing: {(july.resolution_action_updated_date > july.closed_date).sum():,}")
resolution action updated before created: 2,810; after closing: 199,988
The resolution update date is even less ordered: 2,810 requests have a resolution update before creation, and 199,988 have one after closing, which is normal — agencies keep adding notes after a request is closed. It is not a resolution time.
Example 2: closed dates far in the future
far = july[july.closed_date > pd.Timestamp("2026-10-15")]
print(f"closed dates after the download date: {len(far)}")
print(f"closed more than a year after creation: {(july.dur_h > 365 * 24).sum():,}")
closed dates after the download date: 0
closed more than a year after creation: 1,165
No closed date lies after the download date, but 1,165 July requests took more than a year to close, mostly the slow categories where requests wait for scheduled work.
Why dates go backwards
311 dates come from different systems. The created date is stamped by the 311 platform when the request arrives; the closed date is set by the agency's own work-management system, sometimes by a person typing a date, sometimes when a linked work order closes. When a new request is attached to an existing work order, as appears to happen with street lights — a street light already reported by someone else — the agency may close it with the work order's dates, which can precede the new request. Same-second closures are usually automatic: a duplicate merged into an open request, a referral to another agency, or a request handled entirely by the 311 system.
None of this is visible in the data except through the arithmetic, which is why the classification step belongs at the start of any duration analysis.
Related checks
- Open requests have no closed date and are the slowest of all; exclude them from medians but report their count.
- Daylight-saving time can create one-hour negatives around the November change; none appear in July.
- Midnight timestamps mark dates without times; treat durations under a day for those rows as approximate.
- Updates after the download can change these counts; record your download date.
Internal links
- How to measure 311 response times — the durations these rows break
- 311 data explained — created, closed and updated dates
- Bike-share trips with negative durations — the same symptom elsewhere
FAQ
Why do some 311 requests have a closed date before the created date?
Most likely because they were attached to existing work orders and closed with that work's earlier date; in July 2025, 57 of the 64 cases were street-light requests.
Should I drop 311 requests that closed instantly?
Drop them from response-time statistics but count them: 9,276 July 2025 requests closed in the same second they were created.