
How to Relate Heat and Hot Water Complaints to Outdoor Temperature
On this page
Problem statement
From October to May, New York landlords must keep apartments warm: at least 68 °F indoors during the day when it is below 55 °F outside, and at least 62 °F at night. When they do not, tenants call 311, and heat and hot water became the third most common complaint of 2025 with 315,946 requests. How closely do the complaints follow the weather? This guide joins the daily heat complaint counts to daily temperatures from the Central Park weather station, measures the relationship across the heat season, and finds the threshold where complaints take off.
Quick answer
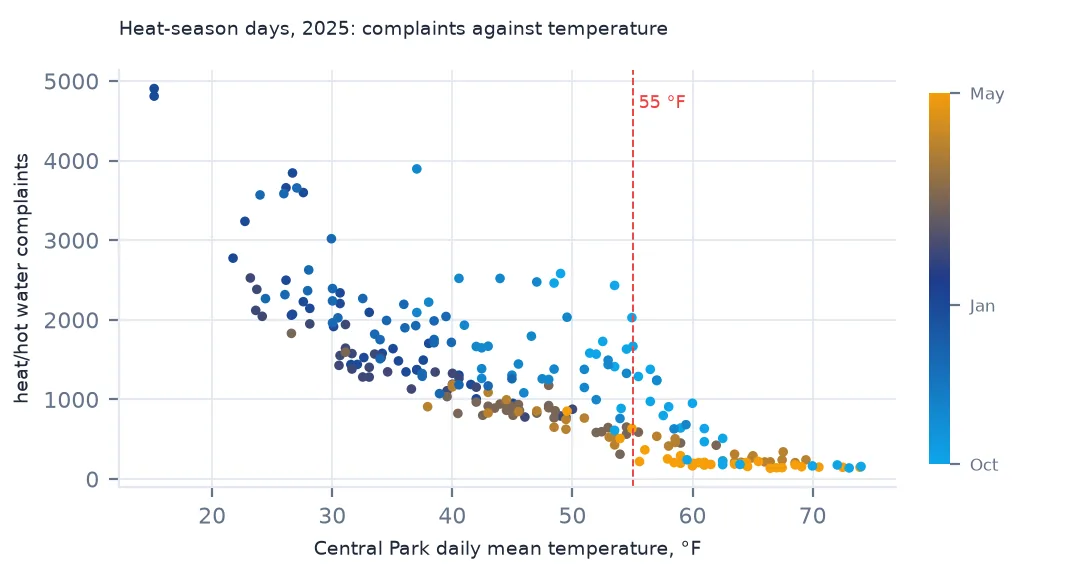
Sum the daily HEAT/HOT WATER counts, join GHCN-Daily mean temperature for Central Park on the date, and restrict to the heat season (October–May). The rank correlation in 2025 is −0.85: the colder the day, the more complaints.
heat = daily[daily.complaint_type == "HEAT/HOT WATER"].groupby("day").n.sum()
j = pd.DataFrame({"complaints": heat, "tmean": wx.tmean, "tmin": wx.tmin}).dropna()
season = j[(j.index.month >= 10) | (j.index.month <= 5)]
print(f"heat/hot water complaints in 2025: {heat.sum():,}; heat-season days: {len(season)}")
print(f"rank correlation of daily complaints with the day's mean temperature (heat season): {season.complaints.corr(season.tmean, method='spearman'):+.2f}")
print("median complaints a day by mean temperature, °F:", season.complaints.groupby(pd.cut(season.tmean, [0, 25, 35, 45, 55, 65, 90])).median().to_dict())
heat/hot water complaints in 2025: 315,946; heat-season days: 243
rank correlation of daily complaints with the day's mean temperature (heat season): -0.85
median complaints a day by mean temperature, °F: {Interval(0, 25, closed='right'): 2650.5, Interval(25, 35, closed='right'): 1955.5, Interval(35, 45, closed='right'): 1305.0, Interval(45, 55, closed='right'): 885.0, Interval(55, 65, closed='right'): 293.0, Interval(65, 90, closed='right'): 171.0}
Across the 243 heat-season days of 2025 the rank correlation between daily complaints and the day's mean temperature is −0.85. On days averaging below 25 °F the median was 2,650.5 complaints; between 45 and 55 °F, 885; above 65 °F, 171.
Complaints against the thermometer
1. One complaint type, every day
print(f"days with counts: {heat.size}; busiest {heat.idxmax():%a %d %b} ({heat.max():,}); quietest {heat.idxmin():%a %d %b} ({heat.min():,})")
print("by month:", heat.groupby(heat.index.month).sum().to_dict())
days with counts: 365; busiest Wed 22 Jan (4,905); quietest Fri 04 Jul (63)
by month: {1: 67229, 2: 40699, 3: 26276, 4: 16824, 5: 7463, 6: 4217, 7: 3008, 8: 2929, 9: 3595, 10: 31858, 11: 47946, 12: 63902}
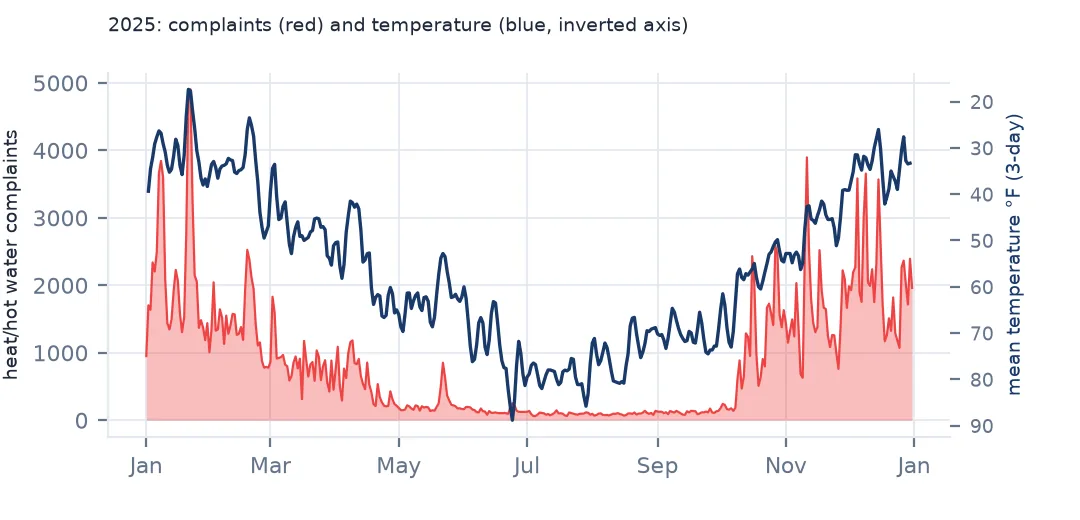
The busiest day was Wednesday 22 January (4,905 complaints), the day after the coldest day of the year; the quietest was the Fourth of July (63). Monthly totals fall from 67,229 in January to 2,929 in August and jump back to 31,858 in October, when the heat season starts.
2. Daily temperature from the Central Park station
print(f"Central Park 2025: mean {wx.tmean.mean():.1f} °F; coldest day {wx.tmean.idxmin():%d %b} ({wx.tmean.min():.1f} °F); "
      f"days below 55 °F mean: {(wx.tmean < 55).sum()}")
Central Park 2025: mean 55.7 °F; coldest day 21 Jan (15.2 °F); days below 55 °F mean: 174
Central Park's 2025 mean temperature was 55.7 °F, and the coldest day 21 January, with a mean of 15.2 °F. 174 days averaged below 55 °F — the outdoor threshold in the heat law.
3. Same day, not days later
for lag in [0, 1, 2, 3]:
    print(f"complaints against mean temperature {lag} day(s) earlier: rho {season.complaints.corr(season.tmean.shift(lag), method='spearman'):+.3f}")
complaints against mean temperature 0 day(s) earlier: rho -0.852
complaints against mean temperature 1 day(s) earlier: rho -0.760
complaints against mean temperature 2 day(s) earlier: rho -0.687
complaints against mean temperature 3 day(s) earlier: rho -0.662
The same day's temperature explains complaints best (−0.852); the correlation weakens with each day of lag. Tenants call when the apartment is cold, which happens the same day, not days later.
4. A simple model
s = season.assign(cold=(65 - season.tmean).clip(lower=0), weekend=season.index.dayofweek >= 5)
b = np.polyfit(s.cold, s.complaints, 1)
print(f"each °F below 65 °F adds about {b[0]:.0f} complaints a day (intercept {b[1]:.0f})")
print(f"weekend days average {s.complaints[s.weekend].mean():,.0f} complaints against {s.complaints[~s.weekend].mean():,.0f} on weekdays")
each °F below 65 °F adds about 58 complaints a day (intercept 155)
weekend days average 1,055 complaints against 1,319 on weekdays
A straight line through the heat season says each degree below 65 °F adds about 58 complaints a day across the city. Weekends average 1,055 complaints against 1,319 on weekdays, because fewer people call on weekends whatever the temperature.
The first cold snap, and the boroughs
The data used on this page
NYC 311 service requests: daily counts for 2025 by complaint type (saved copy of an NYC Open Data query), and NOAA NCEI GHCN-Daily temperatures for Central Park (USW00094728).
from pathlib import Path

import geopandas as gpd
import numpy as np
import pandas as pd
import requests

Path("data").mkdir(exist_ok=True)
# NYC 311 Service Requests (NYC Open Data, dataset erm2-nwe9) as queried on 15 October 2026 and saved on this site,
# because requests that are still open keep changing: every request created in July 2025, and the 2025 daily counts by
# agency, complaint type, borough and channel. The queries are in data/README.txt; the live API is
# https://data.cityofnewyork.us/resource/erm2-nwe9.csv
FILES = ["nyc-311-2025-daily-counts-2026-10-15.zip", "nyc-311-2025-07-requests-2026-10-15.zip", "nyc-census-2020-by-geography-2026-10-15.xlsx"]
for name in FILES:
    if not Path(f"data/{name}").exists():
        Path(f"data/{name}").write_bytes(requests.get(f"https://data.spatialworkflow.io/{name}", timeout=600).content)
daily = pd.read_csv("data/nyc-311-2025-daily-counts-2026-10-15.zip", parse_dates=["day"])
july = pd.read_csv("data/nyc-311-2025-07-requests-2026-10-15.zip", low_memory=False,
                   dtype={"unique_key": str, "incident_zip": str, "bbl": str, "community_board": str},
                   parse_dates=["created_date", "closed_date", "resolution_action_updated_date"])
cen = pd.read_excel("data/nyc-census-2020-by-geography-2026-10-15.xlsx", sheet_name="2010, 2020, and Change", skiprows=3)
boro_pop = cen[cen.GeoType == "Boro"].assign(b=lambda d: d.Name.str.upper()).set_index("b").Pop_20
f = Path("data/USW00094728.csv")                                                   # Central Park, NOAA GHCN-Daily
if not f.exists():
    f.write_bytes(requests.get("https://www.ncei.noaa.gov/data/global-historical-climatology-network-daily/access/USW00094728.csv", timeout=300).content)
w = pd.read_csv(f, usecols=["DATE", "TMAX", "TMIN"], parse_dates=["DATE"], low_memory=False).set_index("DATE").loc["2025"]
wx = pd.DataFrame({"tmax": w.TMAX / 10 * 9 / 5 + 32, "tmin": w.TMIN / 10 * 9 / 5 + 32})          # tenths of °C to °F
wx["tmean"] = (wx.tmax + wx.tmin) / 2
print(f"NYC 311: {daily.n.sum():,} requests in the 2025 daily counts; {len(july):,} requests created in July 2025")
NYC 311: 3,655,042 requests in the 2025 daily counts; 315,883 requests created in July 2025
Example 1: the first cold snap of autumn
autumn = j.loc["2025-09-15":"2025-11-30"]
first = autumn[autumn.complaints > 1000].index[0]
print(f"first day with more than 1,000 complaints: {first:%a %d %b}, mean temperature {autumn.tmean[first]:.1f} °F")
print(autumn.loc[first - pd.Timedelta(days=3):first + pd.Timedelta(days=1), ["complaints", "tmean"]].round(1).to_string())
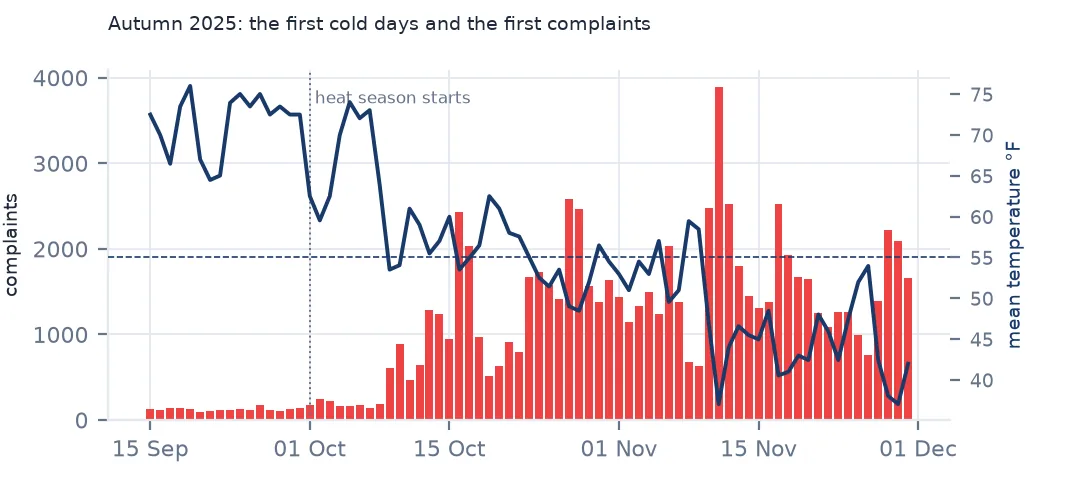
first day with more than 1,000 complaints: Mon 13 Oct, mean temperature 55.5 °F
complaints tmean
2025-10-10 887 54.0
2025-10-11 469 61.0
2025-10-12 641 59.0
2025-10-13 1288 55.5
2025-10-14 1236 57.0
The first day of autumn with more than 1,000 complaints was Monday 13 October, at a mean of 55.5 °F — right at the legal threshold, two weeks into the heat season.
Example 2: by borough
hb = daily[daily.complaint_type == "HEAT/HOT WATER"].groupby("borough").n.sum()
print("heat/hot water complaints by borough:", hb.sort_values(ascending=False).to_dict())
heat/hot water complaints by borough: {'BRONX': 112368, 'BROOKLYN': 82248, 'MANHATTAN': 76747, 'QUEENS': 41395, 'STATEN ISLAND': 3187, 'Unspecified': 1}
The Bronx filed 112,368 heat complaints in 2025, more than Brooklyn (82,248) despite having about half Brooklyn's population, and Staten Island only 3,187: the complaints follow the housing stock — large, older rental buildings — as well as the weather.
Weather as the driver, buildings as the filter
Heat complaints are one of the few 311 series with an obvious physical driver, which makes them a good place to test methods: the weather explains most of the day-to-day variation, and what is left is about buildings and tenants. A building with a failing boiler generates complaints whenever it is cold; a well-run building generates none. Mapping the residuals — places with more complaints than their weather would predict — finds the problem buildings, which is how the housing department targets inspections.
Central Park is one station for the whole city; outer neighbourhoods can be a few degrees colder on clear nights, and minimum temperature matters at night when the 62 °F rule applies. For finer work, use several stations or gridded temperatures.
Things to watch
- Hot water is year-round. The complaint type mixes heat and hot water; summer counts are mostly hot water.
- Units. GHCN-Daily stores temperatures in tenths of a degree Celsius; convert before comparing with the °F thresholds in the law.
- Repeat complaints from the same building on consecutive days are common; deduplicate before counting buildings.
- Holidays reduce calls the same way weekends do.
Internal links
- How to analyse NYC 311 service requests — the data
- How much rain and cold cut bike-share ridership — another city series against daily weather
- How to calculate the SPI in Python — reading GHCN-Daily files
FAQ
How strongly do heat complaints follow the temperature in New York?
Very strongly: a rank correlation of −0.85 between daily complaints and Central Park's mean temperature across the 2025 heat season.
When does the heat season start in New York?
On 1 October; in 2025 complaints first passed 1,000 a day on 13 October, at a mean of 55.5 °F.