
How to Measure 311 Response Times by Agency and Complaint Type
On this page
Problem statement
How long does the city take to deal with a 311 request? Every record has a created date and, once closed, a closed date, so the arithmetic is easy; the meaning is not. Agencies close requests at different points — when they refer it, when an officer arrives, when the repair is done — and some requests are closed in zero seconds, some before they were created, and some never. This guide measures time to close for the 315,883 requests created in July 2025, by agency, complaint type, hour and borough, and shows which summary statistics survive the data's quirks.
Quick answer
Compute closed_date − created_date, drop zero and negative durations and open requests (and report how many), and summarise with the median and a high percentile by agency or complaint type. Never compare agencies on the mean.
j = july.assign(hours=(july.closed_date - july.created_date).dt.total_seconds() / 3600)
ok = j[(j.hours > 0) & j.closed_date.notna()]
r = ok.groupby("agency").hours.agg(["size", "median", lambda h: h.quantile(0.9)]).rename(columns={"<lambda_0>": "p90"})
print(r[r["size"] >= 1000].sort_values("median").round(1).to_string())
size median p90
agency
NYPD 149770 1.1 5.9
DHS 6090 8.2 145.6
DEP 20208 19.1 160.5
DSNY 31926 39.4 341.1
DOT 17355 62.8 384.4
DCWP 1985 85.5 755.3
DOHMH 5477 118.3 1440.4
HPD 43942 218.6 981.0
DPR 12831 332.0 4944.0
DOB 8792 421.1 5672.5
TLC 2671 1627.7 6359.6
EDC 1324 8759.7 9097.9
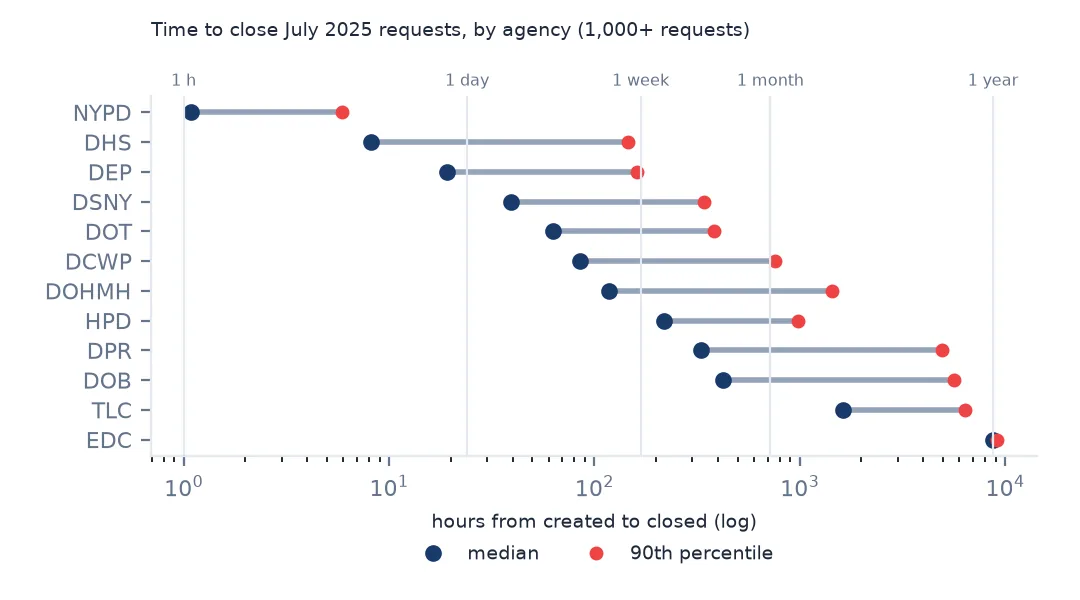
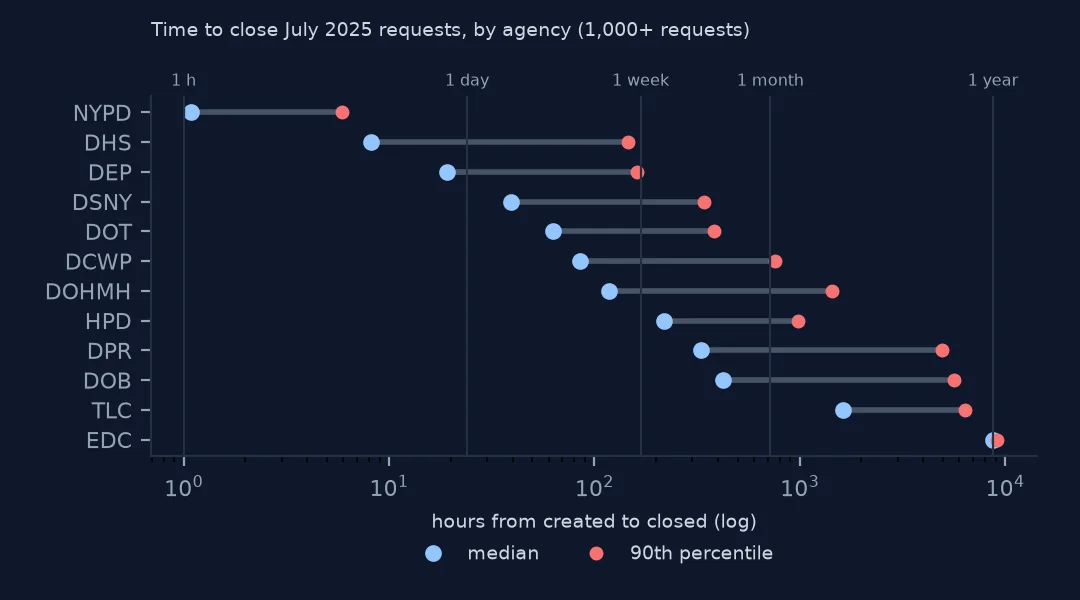
The police close their requests fastest — a median of 1.1 hours — because closing means an officer responded. Homeless services (DHS) take 8.2 hours, environmental protection (DEP) 19.1, sanitation 39.4 and transportation 62.8. Housing (HPD) takes a median of 218.6 hours, about nine days, parks (DPR) 332, buildings (DOB) 421, and the Economic Development Corporation, which handles helicopter noise, 8,759.7 hours — a year.
From two dates to a response time
1. Created, closed and resolution update
print(f"July requests closed by mid-October 2026: {july.closed_date.notna().mean():.1%}; still open: {(july.status != 'Closed').mean():.1%}")
print(f"closed in exactly zero seconds: {(j.hours == 0).sum():,}; closed before created: {(j.hours < 0).sum():,}")
July requests closed by mid-October 2026: 98.7%; still open: 1.4%
closed in exactly zero seconds: 9,276; closed before created: 64
By the time the data was saved, 98.7% of July's requests had been closed and 1.4% were still open. 9,276 were closed in the same second they were created — automatic closures, such as referrals to another agency — and 64 were closed before they were created (impossible dates).
2. Medians, not means
print(f"all agencies: mean {ok.hours.mean():.1f} h, median {ok.hours.median():.1f} h, 90th percentile {ok.hours.quantile(0.9):.1f} h")all agencies: mean 277.3 h, median 5.4 h, 90th percentile 549.4 h
Across all agencies the mean is 277.3 hours and the median 5.4: a long tail of slow cases drags the mean up fifty-fold. One request in ten takes more than 549.4 hours. Use medians and percentiles.
3. By complaint type
t = ok.groupby("complaint_type").hours.agg(["size", "median"])
t = t[t["size"] >= 1000].sort_values("median")
print("fastest:", t.head(4)["median"].round(1).to_dict())
print("slowest:", t.tail(4)["median"].round(1).to_dict())
fastest: {'Traffic': 0.3, 'Vendor Enforcement': 0.3, 'Drug Activity': 0.5, 'Illegal Fireworks': 0.8}
slowest: {'Dead/Dying Tree': 1608.0, 'Building/Use': 2594.8, 'For Hire Vehicle Complaint': 2877.8, 'Noise - Helicopter': 8759.7}
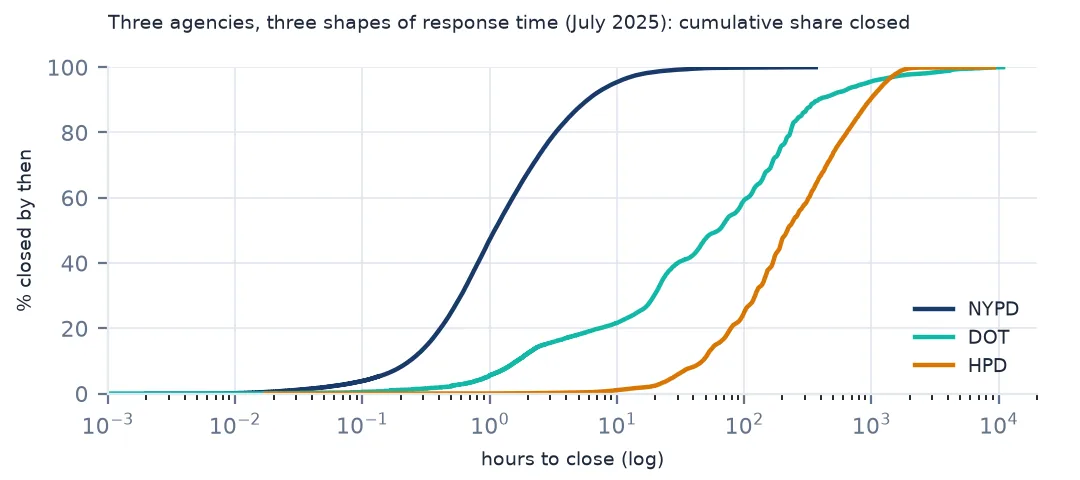
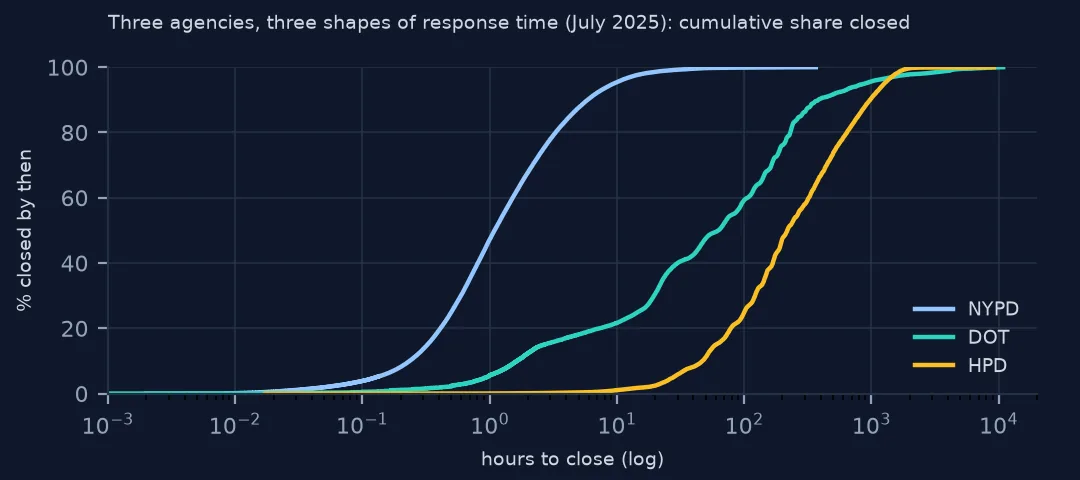
By complaint type the fastest are police matters closed within the hour — traffic (0.3 hours), vendor enforcement, drug activity, illegal fireworks. The slowest involve inspections or other bodies: dead or dying trees (1,608.0 hours), building use (2,594.8), for-hire vehicle complaints (2,877.8) and helicopter noise (8,759.7).
4. Open requests are part of the answer
from datetime import datetime
op = july[july.closed_date.isna()]
print(f"open July requests: {len(op):,}; by agency: {op.agency.value_counts().head(4).to_dict()}")
open July requests: 4,027; by agency: {'DPR': 2120, 'DSNY': 489, 'DOT': 459, 'DOHMH': 374}
4,027 July requests were still open fifteen months later, more than half of them with the parks department (2,120). A median computed only on closed requests understates the time for agencies with many open ones; report the open count beside it, or use survival methods that treat open requests as censored.
Hours of the day and boroughs
The data used on this page
NYC 311 service requests created in July 2025 from NYC Open Data, as they stood on 15 October 2026 (saved copy).
from pathlib import Path

import geopandas as gpd
import numpy as np
import pandas as pd
import requests

Path("data").mkdir(exist_ok=True)
# NYC 311 Service Requests (NYC Open Data, dataset erm2-nwe9) as queried on 15 October 2026 and saved on this site,
# because requests that are still open keep changing: every request created in July 2025, and the 2025 daily counts by
# agency, complaint type, borough and channel. The queries are in data/README.txt; the live API is
# https://data.cityofnewyork.us/resource/erm2-nwe9.csv
FILES = ["nyc-311-2025-daily-counts-2026-10-15.zip", "nyc-311-2025-07-requests-2026-10-15.zip", "nyc-census-2020-by-geography-2026-10-15.xlsx"]
for name in FILES:
    if not Path(f"data/{name}").exists():
        Path(f"data/{name}").write_bytes(requests.get(f"https://data.spatialworkflow.io/{name}", timeout=600).content)
daily = pd.read_csv("data/nyc-311-2025-daily-counts-2026-10-15.zip", parse_dates=["day"])
july = pd.read_csv("data/nyc-311-2025-07-requests-2026-10-15.zip", low_memory=False,
                   dtype={"unique_key": str, "incident_zip": str, "bbl": str, "community_board": str},
                   parse_dates=["created_date", "closed_date", "resolution_action_updated_date"])
cen = pd.read_excel("data/nyc-census-2020-by-geography-2026-10-15.xlsx", sheet_name="2010, 2020, and Change", skiprows=3)
boro_pop = cen[cen.GeoType == "Boro"].assign(b=lambda d: d.Name.str.upper()).set_index("b").Pop_20
print(f"NYC 311: {daily.n.sum():,} requests in the 2025 daily counts; {len(july):,} requests created in July 2025")
NYC 311: 3,655,042 requests in the 2025 daily counts; 315,883 requests created in July 2025
Example 1: time of day
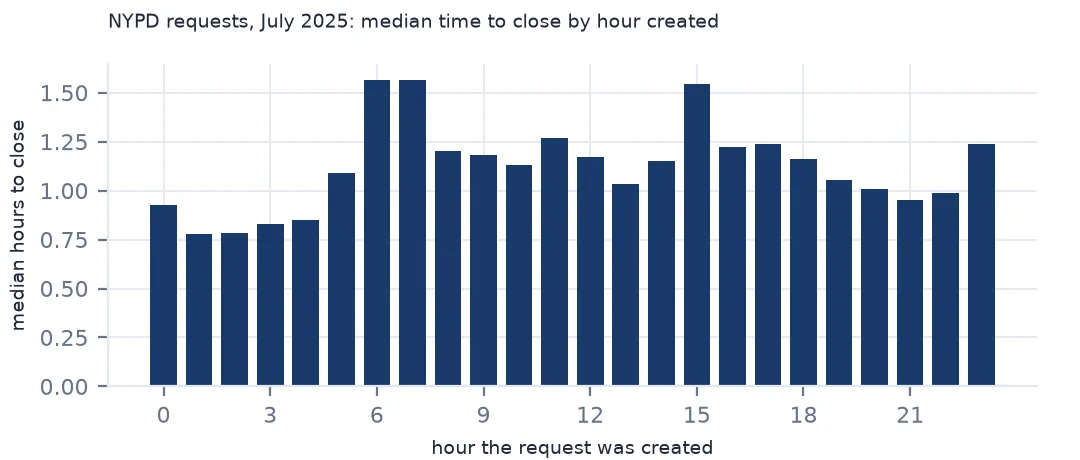
nypd = ok[ok.agency == "NYPD"]
h = nypd.groupby(nypd.created_date.dt.hour).hours.median()
print(f"NYPD median hours to close by hour created: fastest {h.min():.2f} at {h.idxmin()}:00, slowest {h.max():.2f} at {h.idxmax()}:00")
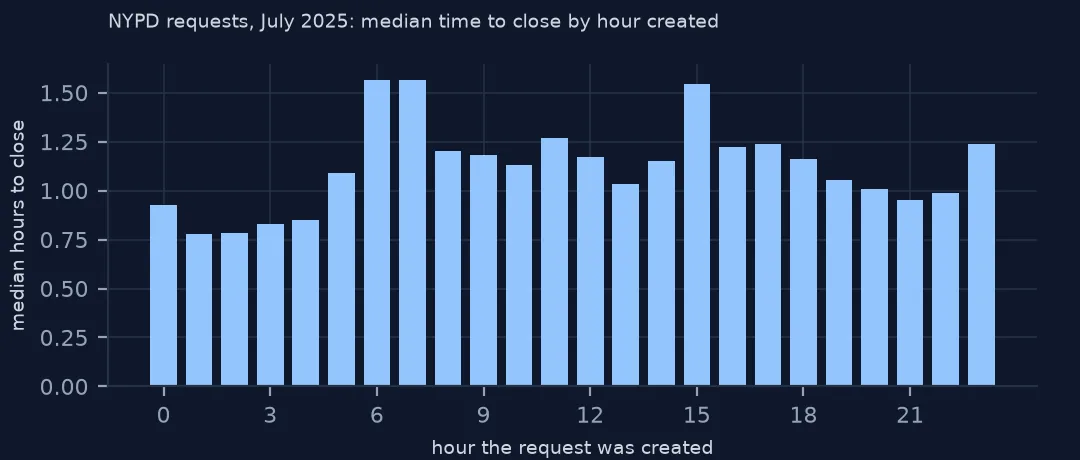
NYPD median hours to close by hour created: fastest 0.78 at 1:00, slowest 1.57 at 6:00
Police requests made at 1:00 close fastest (median 0.78 hours) and those made at 6:00 slowest (1.57).
Example 2: by borough
print("median hours to close, illegal parking, by borough:",
      ok[ok.complaint_type == "Illegal Parking"].groupby("borough").hours.median().round(2).to_dict())
median hours to close, illegal parking, by borough: {'BRONX': 2.86, 'BROOKLYN': 1.45, 'MANHATTAN': 0.99, 'QUEENS': 1.22, 'STATEN ISLAND': 1.78, 'Unspecified': 5.58}
For illegal parking the median ranges from 0.99 hours in Manhattan to 2.86 in the Bronx — a gap worth investigating, but one that also reflects how and when precincts close parking complaints.
What closed means
A closed date marks when the agency closed the request in its system, not when the problem went away. The police close a noise complaint after an officer responds, whether or not the noise stopped; the housing department closes a heat complaint after an inspection or after the landlord restores heat; the parks department may close a tree request when the work is scheduled. Response times are therefore comparable within an agency and complaint type, across places and over time, but not across agencies as a measure of service quality.
The resolution description says what was done, in free text chosen from each agency's templates. Grouping response times by resolution — "no evidence of the violation", "issued a summons", "referred" — separates the meanings that a single closed date mixes together.
Pitfalls in duration analysis
- Recent requests are not finished. A month that ended recently has more open requests; measure from a period well in the past, as here.
- Zero-second closes are referrals or automatic closures; keep them out of response-time statistics but count them.
- Time zones. Dates are local New York time without an offset; a daylight-saving change can make an hour appear twice.
- Annual closures. Some agencies close batches on a schedule, which shows as a spike at a fixed duration.
Internal links
- 311 data explained — the dates in a record
- 311 requests closed before they were created — negative durations
- Bike-share trips with negative durations — the same problem in another dataset
FAQ
How quickly does NYC respond to 311 complaints?
It depends on the agency: in July 2025 the median time to close was 1.1 hours for police requests and 218.6 hours for housing requests.
Why are some 311 requests closed immediately?
They were referred or closed automatically; 9,276 July 2025 requests were closed in the same second they were created.