
311 Counts Inflated by Duplicates: One Problem, Many Requests
On this page
Problem statement
One loud party, five neighbours calling: five 311 requests. One drug corner, one determined resident calling every night: a thousand requests a month. 311 counts requests, not problems, and the gap varies by complaint type and place, so rankings built on raw counts reward the places with the most persistent callers. This guide finds repeat requests in July 2025 — the same complaint type at the same address within 24 hours — measures how much they inflate counts, and turns requests into incidents.
Quick answer
Sort requests by time, group by complaint type and address, and compute the gap to the previous request in the group. Treat a request within 24 hours of the previous one as a repeat, and number incidents with a cumulative sum of the non-repeats.
k = july.dropna(subset=["incident_address"]).sort_values("created_date")
k["prev"] = k.groupby(["complaint_type", "incident_address"]).created_date.shift()
k["gap_h"] = (k.created_date - k.prev).dt.total_seconds() / 3600
rep = k.gap_h <= 24
print(f"July requests with an address: {len(k):,}; repeating the same type at the same address within 24 hours: {rep.sum():,} ({rep.mean():.1%})")
print(f"distinct type-address incidents if repeats within 24 h are merged: {len(k) - rep.sum():,}")
July requests with an address: 304,060; repeating the same type at the same address within 24 hours: 70,442 (23.2%)
distinct type-address incidents if repeats within 24 h are merged: 233,618
Of 304,060 July requests with an address, 70,442 (23.2%) repeat the same complaint type at the same address within 24 hours of the previous one. Merging them leaves 233,618 incidents.
From requests to incidents
1. Which types repeat most
r = rep.groupby(k.complaint_type).mean()
n = k.complaint_type.value_counts()
print(r[n[n >= 2000].index].sort_values(ascending=False).head(6).round(3).to_dict())
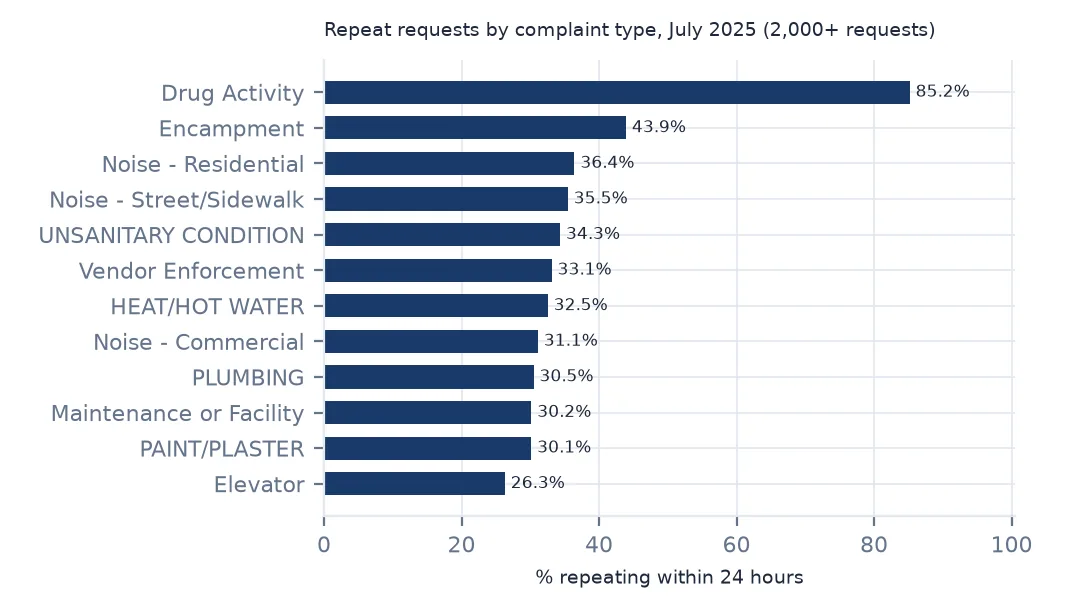
{'Drug Activity': 0.852, 'Encampment': 0.439, 'Noise - Residential': 0.364, 'Noise - Street/Sidewalk': 0.355, 'UNSANITARY CONDITION': 0.343, 'Vendor Enforcement': 0.331}
Repeats depend on the complaint. 85.2% of drug-activity requests repeat within 24 hours — a few addresses called in again and again — and 43.9% of encampment requests. Residential and street noise repeat in about a third of cases, like unsanitary conditions; vendor enforcement 33.1%.
2. How quickly
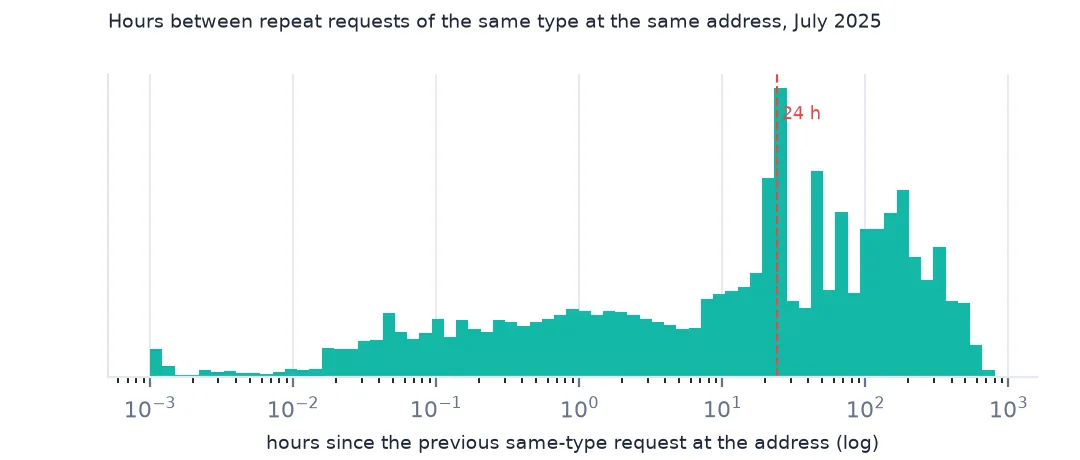
print("gap to the previous same-type request at the address, hours:", k.gap_h.dropna().describe(percentiles=[0.1, 0.25, 0.5]).round(2)[["10%", "25%", "50%"]].to_dict())gap to the previous same-type request at the address, hours: {'10%': 0.02, '25%': 0.45, '50%': 17.18}
Where there is a previous request, the median gap is 17.18 hours, but a quarter come within 0.45 hours and a tenth within about a minute (0.02 hours) — neighbours calling about the same event.
3. The heaviest repeat addresses
top = k.groupby(["complaint_type", "incident_address"]).size().sort_values(ascending=False).head(5)
print(top.to_string())
complaint_type incident_address
Drug Activity 82-68 164 STREET 1083
Illegal Parking 5-47 50 AVENUE 828
Traffic 78-15 PARSONS BOULEVARD 671
Illegal Parking 34-16 ASTORIA BOULEVARD SOUTH 667
298 CLASSON AVENUE 656
The heaviest repeat addresses are extreme: 1,083 drug-activity requests at 82-68 164 Street in Queens in a single month, 828 illegal-parking requests at 5-47 50 Avenue, 671 traffic requests at 78-15 Parsons Boulevard. A handful of addresses like these can dominate a neighbourhood's or a hexagon's total.
4. Count incidents, not requests
inc = k.assign(new=~rep).assign(incident=lambda d: d.groupby(["complaint_type", "incident_address"]).new.cumsum())
per = inc.groupby(["complaint_type", "incident_address", "incident"]).size()
print(f"incidents: {len(per):,}; mean requests per incident {per.mean():.2f}; incidents with 5+ requests: {(per >= 5).sum():,}")
incidents: 233,618; mean requests per incident 1.30; incidents with 5+ requests: 2,881
Numbered as incidents, July has 233,618, with 1.30 requests per incident on average; 2,881 incidents attracted five or more requests.
Rankings after deduplication
The data used on this page
NYC 311 requests created in July 2025 (NYC Open Data, saved copy).
from pathlib import Path

import geopandas as gpd
import numpy as np
import pandas as pd
import requests

Path("data").mkdir(exist_ok=True)
# NYC 311 Service Requests (NYC Open Data, dataset erm2-nwe9) as queried on 15 October 2026 and saved on this site,
# because requests that are still open keep changing: every request created in July 2025, and the 2025 daily counts by
# agency, complaint type, borough and channel. The queries are in data/README.txt; the live API is
# https://data.cityofnewyork.us/resource/erm2-nwe9.csv
FILES = ["nyc-311-2025-daily-counts-2026-10-15.zip", "nyc-311-2025-07-requests-2026-10-15.zip", "nyc-census-2020-by-geography-2026-10-15.xlsx"]
for name in FILES:
    if not Path(f"data/{name}").exists():
        Path(f"data/{name}").write_bytes(requests.get(f"https://data.spatialworkflow.io/{name}", timeout=600).content)
daily = pd.read_csv("data/nyc-311-2025-daily-counts-2026-10-15.zip", parse_dates=["day"])
july = pd.read_csv("data/nyc-311-2025-07-requests-2026-10-15.zip", low_memory=False,
                   dtype={"unique_key": str, "incident_zip": str, "bbl": str, "community_board": str},
                   parse_dates=["created_date", "closed_date", "resolution_action_updated_date"])
cen = pd.read_excel("data/nyc-census-2020-by-geography-2026-10-15.xlsx", sheet_name="2010, 2020, and Change", skiprows=3)
boro_pop = cen[cen.GeoType == "Boro"].assign(b=lambda d: d.Name.str.upper()).set_index("b").Pop_20
print(f"NYC 311: {daily.n.sum():,} requests in the 2025 daily counts; {len(july):,} requests created in July 2025")
NYC 311: 3,655,042 requests in the 2025 daily counts; 315,883 requests created in July 2025
Example 1: what duplicates do to a ranking
raw = k.groupby("borough").size()
ded = k[~rep].groupby("borough").size()
print("requests by borough:", raw.to_dict())
print("after merging 24-hour repeats:", ded.to_dict())
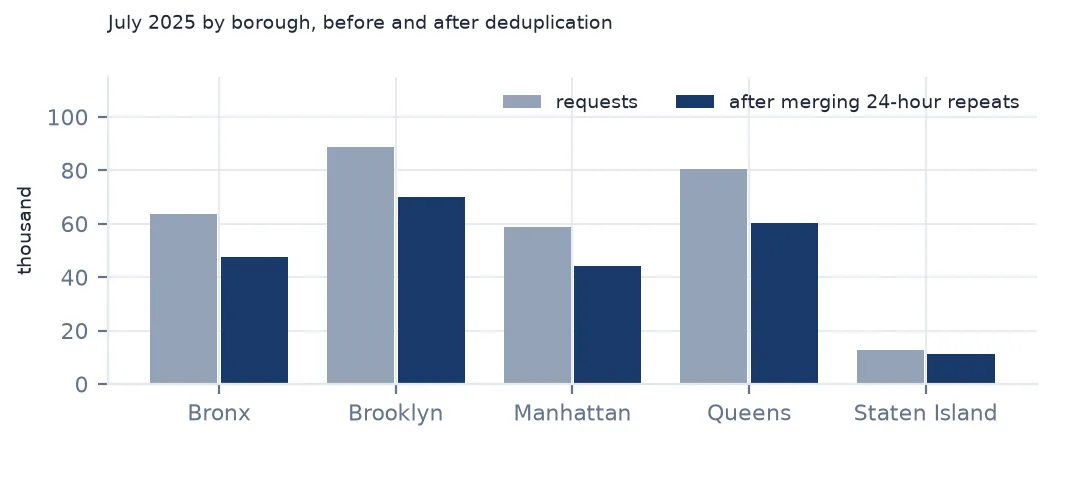
requests by borough: {'BRONX': 63455, 'BROOKLYN': 88687, 'MANHATTAN': 58681, 'QUEENS': 80457, 'STATEN ISLAND': 12728, 'Unspecified': 52}
after merging 24-hour repeats: {'BRONX': 47626, 'BROOKLYN': 70049, 'MANHATTAN': 44287, 'QUEENS': 60410, 'STATEN ISLAND': 11203, 'Unspecified': 43}
Deduplication shifts the boroughs unevenly: the Bronx loses a quarter of its requests (63,455 to 47,626), Staten Island about an eighth (12,728 to 11,203). Comparisons between places change with it.
Example 2: the status 311 gives a duplicate
print("statuses of repeat requests:", k[rep].status.value_counts().head(3).to_dict())statuses of repeat requests: {'Closed': 70047, 'In Progress': 330, 'Pending': 34}
Repeat requests are closed like any other (70,047 of them closed); 311 does not mark them as duplicates in the published data, so the analyst has to.
Why there is no duplicate flag
311 treats each call as a request in its own right, because each is a resident asking for service, and agencies often handle several requests about one problem in one visit. The published data keeps them all and does not say which belong together. The 24-hour, same-type, same-address rule here is one reasonable definition of an incident; a party might deserve a few hours, a pothole several weeks. Choose the window per complaint type when it matters, and report results both ways.
Repeat callers are also information: a thousand calls about one corner say something real about how long a problem persisted and how strongly someone felt about it. Deduplication is for measuring how many problems there were, not for discarding what residents said.
Pitfalls in deduplication
- Addresses vary in spelling. "164 STREET" and "164 ST" would not match; normalise or use coordinates within a few metres.
- Missing addresses (a few percent of July requests) cannot be deduplicated this way; use coordinates or leave them as single requests.
- Window choice. 24 hours suits noise and parking; structural problems need longer windows.
- Chains. A gap rule links a request to the previous one, so a nightly caller forms one long incident; cap incident length if that matters.
Internal links
- 311 data explained — requests and incidents
- How to find 311 complaint hotspots with H3 — hotspots made of one address
- How to deduplicate addresses — matching the same address written differently
FAQ
How many 311 requests are duplicates?
In July 2025, 23.2% of requests with an address repeated the same complaint type at the same address within 24 hours.
Which 311 complaints repeat the most?
Drug activity (85.2% repeats within 24 hours in July 2025) and encampments (43.9%).