
How to Analyse NYC 311 Service Requests in Python
On this page
Problem statement
New York's 311 line takes every non-emergency request a resident makes — a car blocking a driveway, a neighbour's party, no heat in the apartment — and the city publishes each one as open data: 3,655,042 requests created in 2025, each with a time, agency, complaint type, location and outcome. The full dataset runs to tens of millions of rows since 2010 and keeps changing as requests are closed, so analysis starts with choosing a slice. This guide works with two saved slices — the 2025 daily counts by type, agency, borough and channel, and every request created in July 2025 — to show what New Yorkers complain about, to whom, when, and how much per resident.
Quick answer
For counts over a long period, query the Socrata API with $select, $group and count(*) rather than downloading records; for maps and durations, download a month of records with the columns you need. Then normalise by population before comparing places.
types = daily.groupby("complaint_type").n.sum().sort_values(ascending=False)
print(f"{types.sum():,} service requests created in 2025, {types.size} complaint types")
print("ten most common:", types.head(10).to_dict())
print(f"top ten share: {types.head(10).sum() / types.sum():.1%}")
3,655,042 service requests created in 2025, 193 complaint types
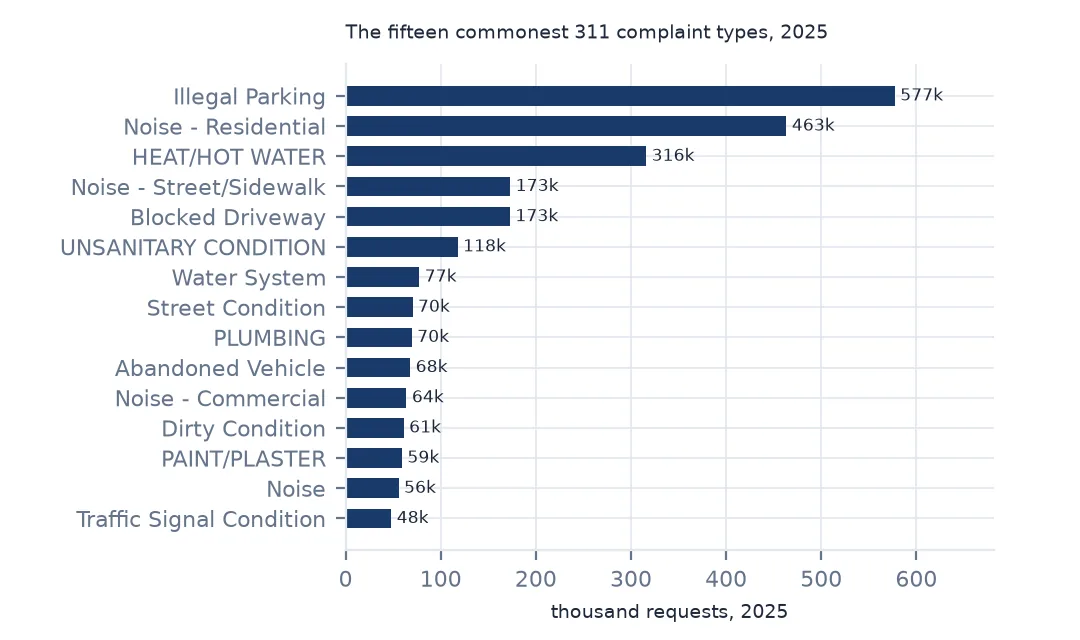
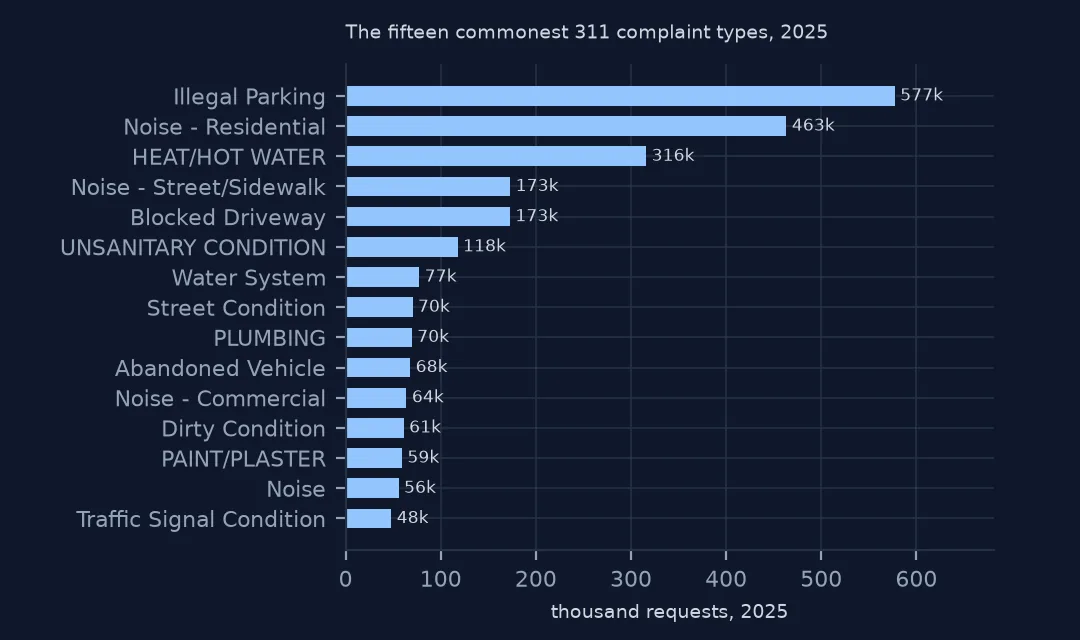
ten most common: {'Illegal Parking': 577257, 'Noise - Residential': 463349, 'HEAT/HOT WATER': 315946, 'Noise - Street/Sidewalk': 173049, 'Blocked Driveway': 172723, 'UNSANITARY CONDITION': 117749, 'Water System': 77442, 'Street Condition': 70330, 'PLUMBING': 69548, 'Abandoned Vehicle': 67903}
top ten share: 57.6%
2025 brought 3,655,042 requests across 193 complaint types. Illegal parking leads (577,257), then residential noise (463,349) and heat or hot water (315,946); the ten commonest types make up 57.6% of all requests.
Counting, routing and normalising
1. Two tables: daily counts and July's requests
print(f"daily table: {len(daily):,} rows of day x agency x type x borough x channel; July requests: {len(july):,} rows, {july.shape[1]} columns")
print(f"July in the daily table: {daily[daily.day.dt.month == 7].n.sum():,} — the same requests counted two ways")
daily table: 295,407 rows of day x agency x type x borough x channel; July requests: 315,883 rows, 18 columns
July in the daily table: 315,883 — the same requests counted two ways
The daily table has 295,407 rows, one for each combination of day, agency, type, borough and channel that occurred; the July table has 315,883 requests with 18 columns. Both count July the same — 315,883 — which is a useful check that the two queries agree.
2. Who handles them
ag = daily.groupby("agency").n.sum().sort_values(ascending=False)
print("by agency:", (ag / ag.sum()).head(6).round(3).to_dict())
ch = daily.groupby("open_data_channel_type").n.sum()
print("by channel:", (ch / ch.sum()).round(3).to_dict())
by agency: {'NYPD': 0.47, 'HPD': 0.212, 'DSNY': 0.089, 'DOT': 0.058, 'DEP': 0.054, 'DPR': 0.03}
by channel: {'MOBILE': 0.234, 'ONLINE': 0.428, 'OTHER': 0.0, 'PHONE': 0.265, 'UNKNOWN': 0.072}
The police (NYPD) handle 47.0% of requests — parking, noise, blocked driveways — and the housing department (HPD) 21.2%. 42.8% of requests arrive online, 26.5% by phone and 23.4% through the mobile app.
3. Per resident by borough
bp = boro_pop.reindex(["BRONX", "BROOKLYN", "MANHATTAN", "QUEENS", "STATEN ISLAND"])
bn = daily.groupby("borough").n.sum().reindex(bp.index)
print("requests per 1,000 residents in 2025:", (1000 * bn / bp).round(0).to_dict())
requests per 1,000 residents in 2025: {'BRONX': 568.0, 'BROOKLYN': 394.0, 'MANHATTAN': 428.0, 'QUEENS': 365.0, 'STATEN ISLAND': 271.0}
Per resident the Bronx files the most: 568 requests per 1,000 people in 2025, against 394 in Brooklyn, 428 in Manhattan and 271 on Staten Island. Brooklyn has the most requests in total; the Bronx the most relative to its population, driven by heat, housing and noise complaints.
4. Map one month of requests
pts = july.dropna(subset=["latitude", "longitude"])
pts = gpd.GeoDataFrame(pts, geometry=gpd.points_from_xy(pts.longitude, pts.latitude), crs=4326)
print(f"July requests with coordinates: {len(pts):,} of {len(july):,} ({len(pts) / len(july):.1%})")
print("top July types:", pts.complaint_type.value_counts().head(5).to_dict())
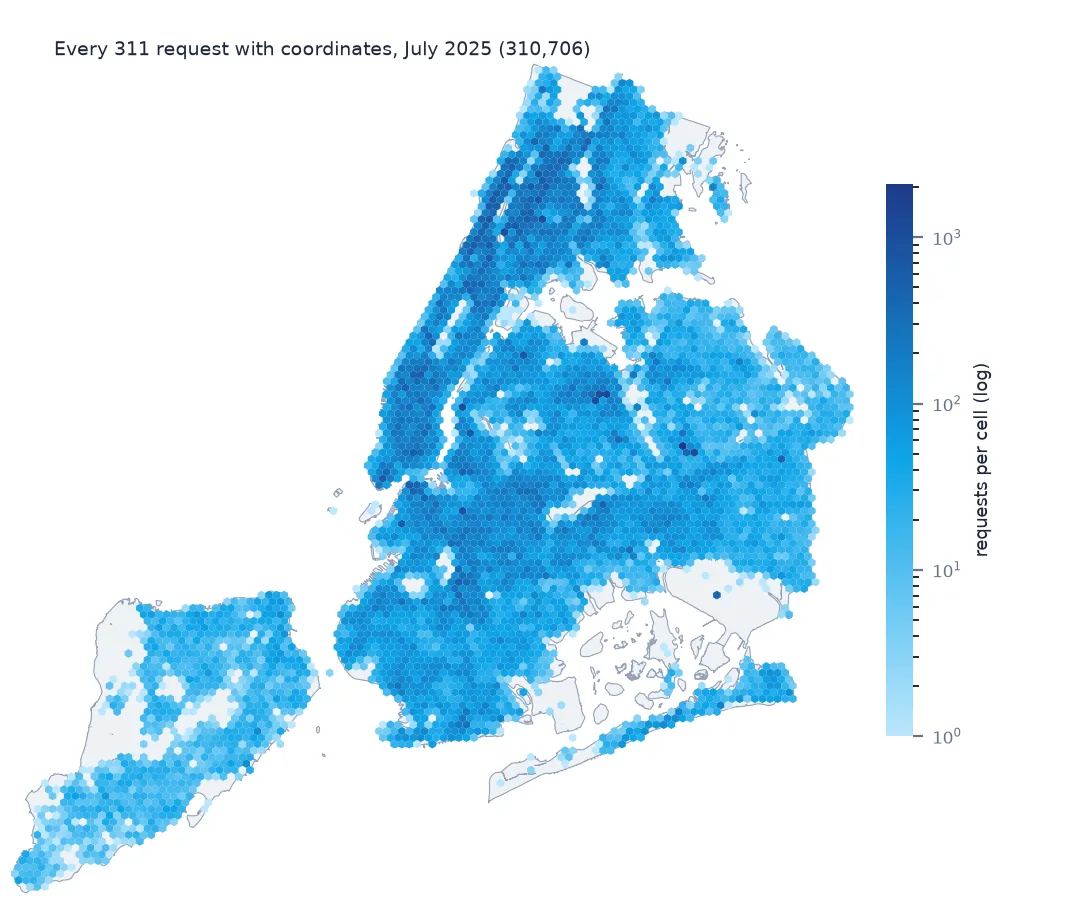
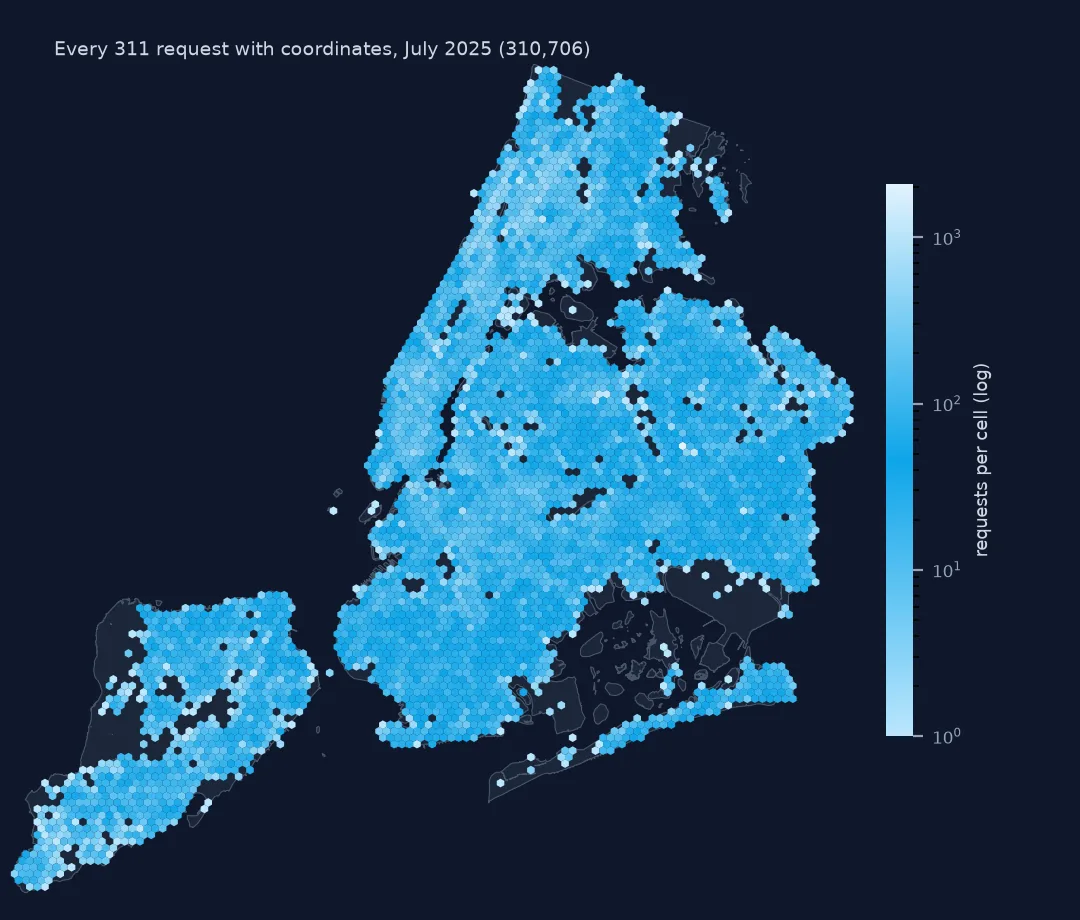
July requests with coordinates: 310,706 of 315,883 (98.4%)
top July types: {'Illegal Parking': 46660, 'Noise - Residential': 26542, 'Noise - Street/Sidewalk': 23090, 'Water System': 14756, 'Blocked Driveway': 13373}
98.4% of July requests have coordinates, enough for a map; the rest are not random (311 requests with no location). Illegal parking and residential and street noise lead in July.
The year and its seasons
The data used on this page
NYC 311 service requests from NYC Open Data (dataset erm2-nwe9): the daily counts for 2025 and every request created in July 2025, as queried on 15 October 2026 and saved on this site; and NYC City Planning's 2020 Census population tables.
from pathlib import Path

import geopandas as gpd
import numpy as np
import pandas as pd
import requests

Path("data").mkdir(exist_ok=True)
# NYC 311 Service Requests (NYC Open Data, dataset erm2-nwe9) as queried on 15 October 2026 and saved on this site,
# because requests that are still open keep changing: every request created in July 2025, and the 2025 daily counts by
# agency, complaint type, borough and channel. The queries are in data/README.txt; the live API is
# https://data.cityofnewyork.us/resource/erm2-nwe9.csv
FILES = ["nyc-311-2025-daily-counts-2026-10-15.zip", "nyc-311-2025-07-requests-2026-10-15.zip", "nyc-census-2020-by-geography-2026-10-15.xlsx"]
for name in FILES:
    if not Path(f"data/{name}").exists():
        Path(f"data/{name}").write_bytes(requests.get(f"https://data.spatialworkflow.io/{name}", timeout=600).content)
daily = pd.read_csv("data/nyc-311-2025-daily-counts-2026-10-15.zip", parse_dates=["day"])
july = pd.read_csv("data/nyc-311-2025-07-requests-2026-10-15.zip", low_memory=False,
                   dtype={"unique_key": str, "incident_zip": str, "bbl": str, "community_board": str},
                   parse_dates=["created_date", "closed_date", "resolution_action_updated_date"])
cen = pd.read_excel("data/nyc-census-2020-by-geography-2026-10-15.xlsx", sheet_name="2010, 2020, and Change", skiprows=3)
boro_pop = cen[cen.GeoType == "Boro"].assign(b=lambda d: d.Name.str.upper()).set_index("b").Pop_20
print(f"NYC 311: {daily.n.sum():,} requests in the 2025 daily counts; {len(july):,} requests created in July 2025")
NYC 311: 3,655,042 requests in the 2025 daily counts; 315,883 requests created in July 2025
Example 1: the year day by day
d = daily.groupby("day").n.sum()
print(f"busiest day {d.idxmax():%a %d %b} ({d.max():,}); quietest {d.idxmin():%a %d %b} ({d.min():,}); median {d.median():,.0f}")
print("mean by weekday:", d.groupby(d.index.dayofweek).mean().round(0).rename(dict(enumerate(["Mon", "Tue", "Wed", "Thu", "Fri", "Sat", "Sun"]))).to_dict())
busiest day Mon 15 Dec (16,388); quietest Thu 25 Dec (6,216); median 9,933
mean by weekday: {'Mon': 10524.0, 'Tue': 10484.0, 'Wed': 10115.0, 'Thu': 10116.0, 'Fri': 10240.0, 'Sat': 9311.0, 'Sun': 9305.0}
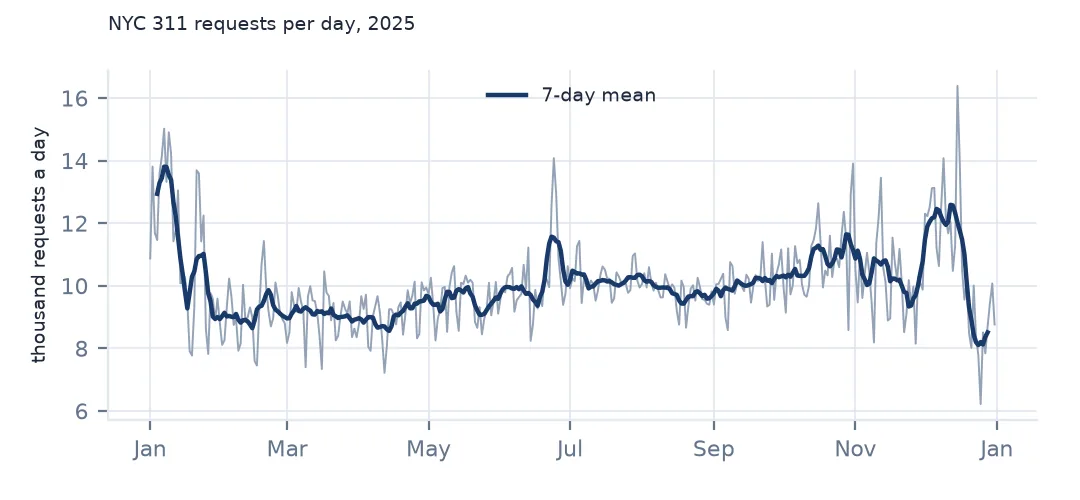
The busiest day of 2025 was Monday 15 December (16,388 requests), during a cold spell; the quietest Christmas Day (6,216). Weekdays average between 10,115 and 10,524 requests, Saturdays and Sundays about 9,305 to 9,311.
Example 2: the seasons of complaint types
m = daily.pivot_table(index=daily.day.dt.month, columns="complaint_type", values="n", aggfunc="sum").fillna(0)
for t in ["HEAT/HOT WATER", "Noise - Residential", "Illegal Parking", "Street Condition"]:
    print(f"{t:22s} peak month {m[t].idxmax():2d}, low month {m[t].idxmin():2d}, ratio {m[t].max() / m[t].min():.1f}")
HEAT/HOT WATER peak month 1, low month 8, ratio 23.0
Noise - Residential peak month 1, low month 7, ratio 2.7
Illegal Parking peak month 9, low month 2, ratio 1.3
Street Condition peak month 5, low month 11, ratio 1.8
Complaint types have their own seasons. Heat and hot water peaks in January and bottoms out in August, 23 times lower; residential noise peaks in January too (New Year), illegal parking barely varies (1.3 times between months), and street conditions peak in May, pothole season.
What 311 data measures
A 311 request records that someone called, clicked or tapped to ask the city for something. It measures the meeting of a problem with a resident willing and able to report it — so it reflects how people use 311 as much as how often problems occur. Areas with more renters, more people at home, or more trust in the city tend to report more; a quiet street with tolerant neighbours files fewer noise complaints than a lively one with impatient ones.
That makes 311 excellent for questions about service demand and response, and good for spotting change over time in the same place, but weaker as a measure of absolute conditions. 311 data explained goes through the fields and what they can support.
Practical points
- The dataset changes. Open requests are updated and closed; save the slice you analyse with its download date, as these pages do.
- API limits. Without an app token the Socrata API throttles; aggregate in the query with
$groupinstead of pulling millions of rows. - Complaint types change over the years (HPD's older types are written in capitals); check the list for each period.
- Borough "Unspecified" holds a few thousand requests a year with no borough.
Internal links
- 311 data explained — what a request record is
- How to map 311 complaints per resident — normalising by population
- How to analyse NYC taxi trip records — another New York open dataset at scale
FAQ
How many 311 requests does New York get a year?
3,655,042 were created in 2025, a median of 9,933 a day.
What do New Yorkers complain about most?
Illegal parking (577,257 requests in 2025), residential noise (463,349) and lack of heat or hot water (315,946).