
311 Data Explained: What a Service Request Does and Does Not Measure
On this page
Problem statement
311 data is often used as if it were a sensor: noise complaints as a noise map, heat complaints as a map of cold apartments, illegal-parking requests as a map of illegal parking. It is something else — a log of requests made by people, routed to agencies and closed by them — and the difference decides what conclusions it can carry. This page goes through the fields of a New York 311 record using every request from July 2025: complaint types and descriptors, agencies, channels, statuses and dates, and the gap between a request and an incident.
Quick answer
Each row is one request: who it went to (agency), what it was about (complaint_type, refined by descriptor), where (incident_address, coordinates), how it arrived (open_data_channel_type), and what happened (status, closed_date, resolution_description). Several rows can describe one problem, and many problems never produce a row.
print(f"July 2025: {len(july):,} requests; distinct complaint types {july.complaint_type.nunique()}, descriptors {july.descriptor.nunique()}")
print("status:", july.status.value_counts(normalize=True).round(3).to_dict())
print(f"closed date filled: {july.closed_date.notna().mean():.1%}; resolution update date filled: {july.resolution_action_updated_date.notna().mean():.1%}")
July 2025: 315,883 requests; distinct complaint types 171, descriptors 805
status: {'Closed': 0.986, 'In Progress': 0.01, 'Pending': 0.001, 'Assigned': 0.001, 'Open': 0.001, 'Started': 0.0, 'Unspecified': 0.0}
closed date filled: 98.7%; resolution update date filled: 99.4%
July 2025's 315,883 requests use 171 complaint types and 805 descriptors. 98.6% were closed when the data was saved, fifteen months later; the rest are in progress, pending or open. 98.7% have a closed date and 99.4% a resolution update date.
The fields of a request
1. Complaint type and descriptor
t = july[july.complaint_type == "Noise - Residential"].descriptor.value_counts()
print("Noise - Residential descriptors:", t.to_dict())
print("complaint types written in capitals (older HPD categories):", sorted({c for c in july.complaint_type.unique() if c.isupper()})[:6])
Noise - Residential descriptors: {'Loud Music/Party': 15990, 'Banging/Pounding': 7952, 'Loud Talking': 2437, 'Loud Television': 280}
complaint types written in capitals (older HPD categories): ['APPLIANCE', 'DOOR/WINDOW', 'ELECTRIC', 'ELEVATOR', 'FLOORING/STAIRS', 'GENERAL']
The complaint type is the category the caller or app chose; the descriptor refines it. Residential noise splits into loud music or parties (15,990 in July), banging (7,952), loud talking and loud television. Some complaint types are in capitals — APPLIANCE, ELEVATOR, PLUMBING — a naming convention carried over from the housing department's older categories.
2. Agencies and routing
x = july.groupby("agency").complaint_type.nunique().sort_values(ascending=False)
print("complaint types per agency:", x.head(6).to_dict())
print("NYPD's share of July requests:", round((july.agency == "NYPD").mean(), 3))
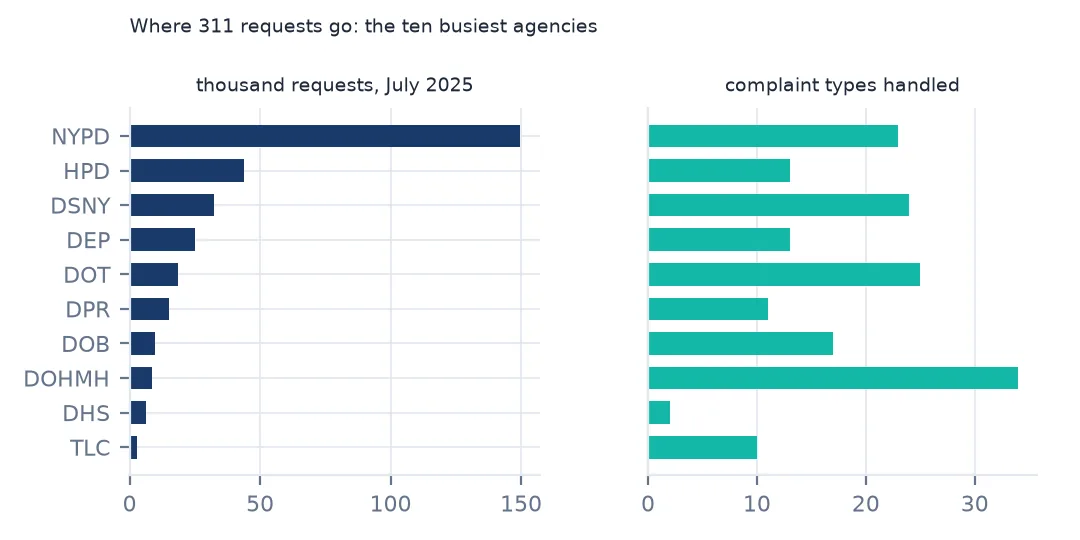
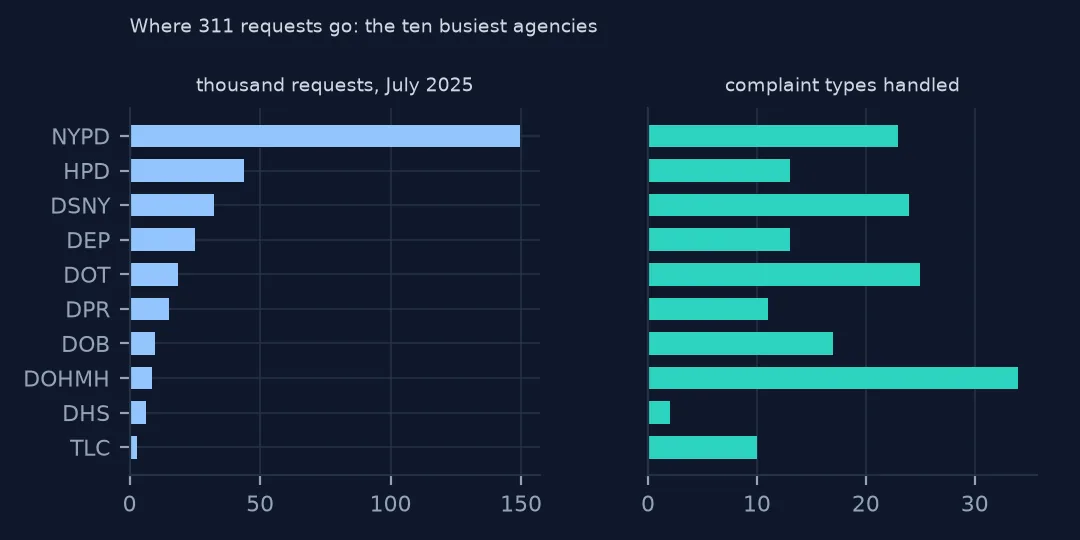
complaint types per agency: {'DOHMH': 34, 'DOT': 25, 'DSNY': 24, 'NYPD': 23, 'DOB': 17, 'DEP': 13}
NYPD's share of July requests: 0.474
Each agency handles a family of types: the health department (DOHMH) 34 in July, transportation (DOT) 25, sanitation (DSNY) 24, police 23. The police alone handled 0.474 of July's requests, because parking and noise go to them.
3. Channels: who reports
ch = pd.crosstab(july.complaint_type, july.open_data_channel_type, normalize="index")
top = july.complaint_type.value_counts().head(6).index
print(ch.loc[top].round(2).to_string())
open_data_channel_type MOBILE ONLINE OTHER PHONE UNKNOWN
complaint_type
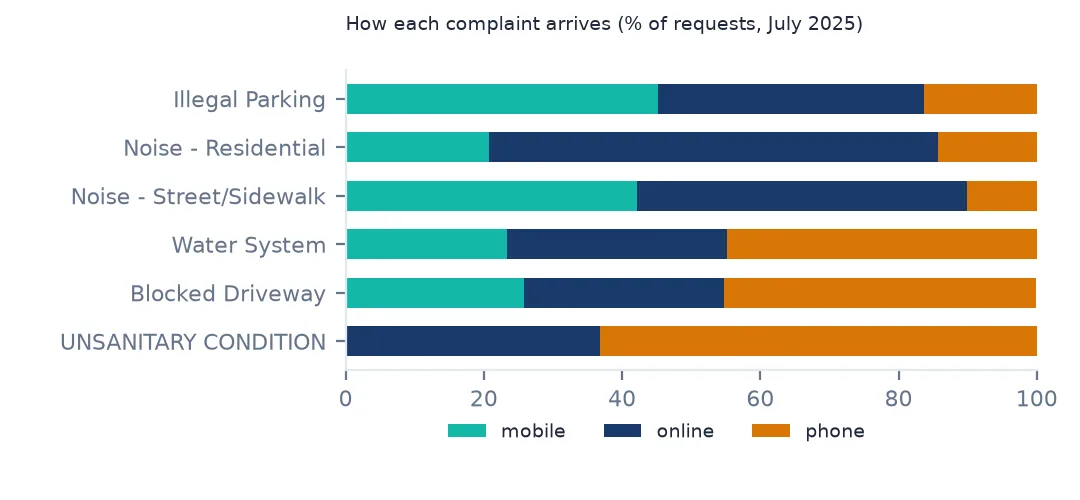
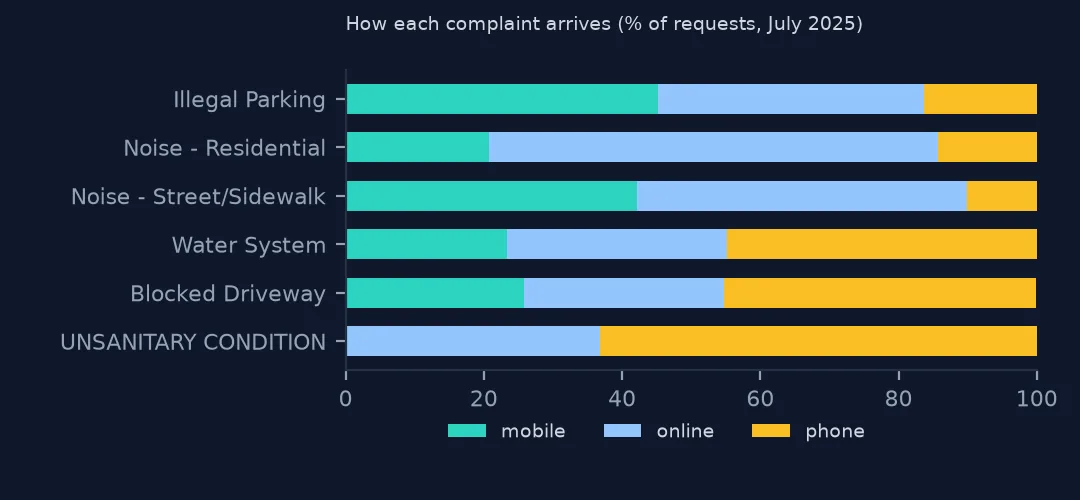
Illegal Parking 0.45 0.38 0.0 0.16 0.0
Noise - Residential 0.21 0.65 0.0 0.14 0.0
Noise - Street/Sidewalk 0.42 0.48 0.0 0.10 0.0
Water System 0.23 0.32 0.0 0.45 0.0
Blocked Driveway 0.26 0.29 0.0 0.45 0.0
UNSANITARY CONDITION 0.00 0.37 0.0 0.63 0.0
The channel depends on the complaint. Illegal parking is reported mostly from phones in the app (45%), residential noise mostly online (65%), and unsanitary conditions mostly by phone call (63%). Each channel reaches different people, so a change in channel use — a new app feature, a phone outage — changes the counts.
4. A request is not an incident
same = july.groupby(["complaint_type", "incident_address", july.created_date.dt.date]).size()
print(f"type x address x day groups: {len(same):,} for {len(july):,} requests; groups with more than one request: {(same > 1).mean():.1%}, "
      f"holding {same[same > 1].sum() / same.sum():.1%} of requests")
type x address x day groups: 248,744 for 315,883 requests; groups with more than one request: 12.8%, holding 28.7% of requests
Grouping by type, address and day leaves 248,744 groups for 315,883 requests: 12.8% of the groups have more than one request, and they hold 28.7% of all requests. Several neighbours call about one party; one person reports the same blocked hydrant three times. A count of requests overstates the count of incidents, by different amounts for different types (311 counts inflated by duplicates).
Locations and channels over time
The data used on this page
NYC 311 service requests from NYC Open Data: every request created in July 2025 and the 2025 daily counts, as queried on 15 October 2026 and saved on this site.
from pathlib import Path

import geopandas as gpd
import numpy as np
import pandas as pd
import requests

Path("data").mkdir(exist_ok=True)
# NYC 311 Service Requests (NYC Open Data, dataset erm2-nwe9) as queried on 15 October 2026 and saved on this site,
# because requests that are still open keep changing: every request created in July 2025, and the 2025 daily counts by
# agency, complaint type, borough and channel. The queries are in data/README.txt; the live API is
# https://data.cityofnewyork.us/resource/erm2-nwe9.csv
FILES = ["nyc-311-2025-daily-counts-2026-10-15.zip", "nyc-311-2025-07-requests-2026-10-15.zip", "nyc-census-2020-by-geography-2026-10-15.xlsx"]
for name in FILES:
    if not Path(f"data/{name}").exists():
        Path(f"data/{name}").write_bytes(requests.get(f"https://data.spatialworkflow.io/{name}", timeout=600).content)
daily = pd.read_csv("data/nyc-311-2025-daily-counts-2026-10-15.zip", parse_dates=["day"])
july = pd.read_csv("data/nyc-311-2025-07-requests-2026-10-15.zip", low_memory=False,
                   dtype={"unique_key": str, "incident_zip": str, "bbl": str, "community_board": str},
                   parse_dates=["created_date", "closed_date", "resolution_action_updated_date"])
cen = pd.read_excel("data/nyc-census-2020-by-geography-2026-10-15.xlsx", sheet_name="2010, 2020, and Change", skiprows=3)
boro_pop = cen[cen.GeoType == "Boro"].assign(b=lambda d: d.Name.str.upper()).set_index("b").Pop_20
print(f"NYC 311: {daily.n.sum():,} requests in the 2025 daily counts; {len(july):,} requests created in July 2025")
NYC 311: 3,655,042 requests in the 2025 daily counts; 315,883 requests created in July 2025
Example 1: location types
print("noise locations:", july[july.complaint_type.str.startswith("Noise")].location_type.value_counts().head(5).to_dict())noise locations: {'Street/Sidewalk': 27006, 'Residential Building/House': 26643, 'Store/Commercial': 2398, 'Club/Bar/Restaurant': 1578, 'Above Address': 1324}
For noise, the location type says where the noise was: street or sidewalk (27,006) and residential buildings (26,643) far ahead of stores, bars and clubs.
Example 2: how much the channel mix moved during 2025
c = daily.pivot_table(index=daily.day.dt.month, columns="open_data_channel_type", values="n", aggfunc="sum")
print("online share by month:", (c.ONLINE / c.sum(axis=1)).round(3).to_dict())
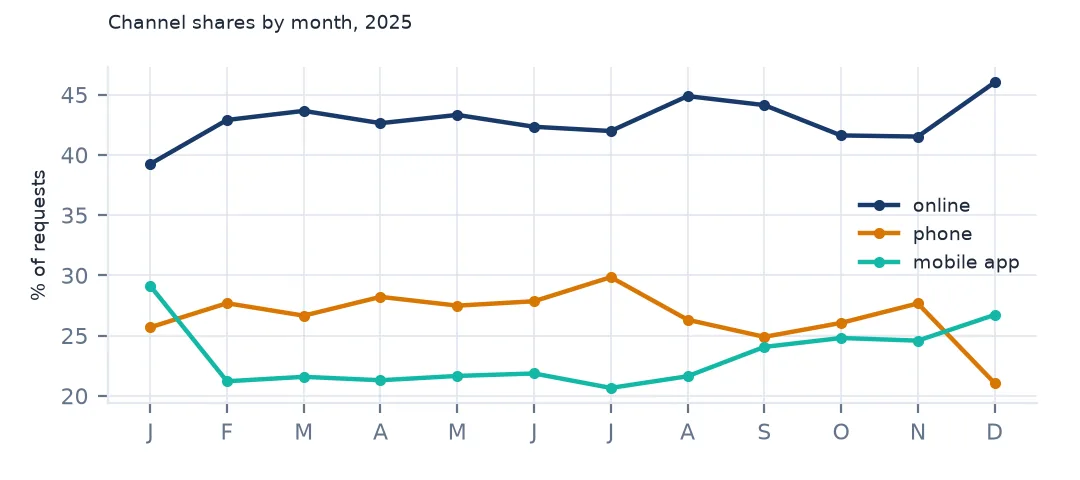
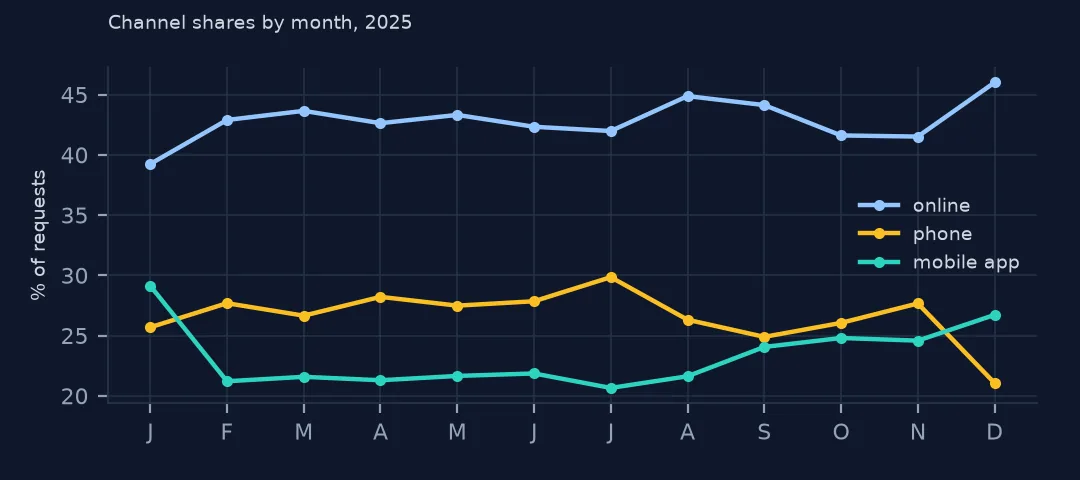
online share by month: {1: 0.392, 2: 0.429, 3: 0.437, 4: 0.426, 5: 0.433, 6: 0.423, 7: 0.42, 8: 0.449, 9: 0.441, 10: 0.416, 11: 0.415, 12: 0.46}
The online share of requests moved between 39.2% in January and 46.0% in December 2025 — enough to matter when comparing months.
Requests, not incidents
Every 311 analysis rests on two filters between the world and the data. First, a problem has to be noticed and reported: that depends on who lives there, whether they know about 311, whether they expect it to help, and whether they would rather not involve the police. Second, the report has to be routed and recorded: complaint types are chosen from menus that change, and agencies close requests in different ways, some immediately on referral, some after an inspection.
So 311 counts compare well within one complaint type, one area and a short period, and badly across types, places with different populations, or years with different systems. Normalising by population helps with the second; deduplicating helps with repeat reports; nothing in the data itself corrects for who chooses to call.
Fields that mislead
closed_dateis administrative. A request may be closed when referred, when an officer arrives, or when the problem is fixed; see 311 response times.resolution_action_updated_dateoften falls after the close date; it is the last update, not the resolution time.statuschanges until a request is closed; save the date of your download.- Coordinates are geocoded from the address or intersection and can be missing for street segments.
Internal links
- How to analyse NYC 311 service requests — loading and counting
- 311 counts inflated by duplicates — requests against incidents
- How to measure 311 response times — the dates in a record
FAQ
Do 311 complaints measure how often problems happen?
No — they measure reports. In July 2025, 28.7% of requests shared a type, address and day with another request, and problems nobody reports never appear.
What is the difference between complaint type and descriptor?
The complaint type is the category (Noise - Residential); the descriptor refines it (Loud Music/Party).