
How to Map 311 Complaints per Resident by Neighbourhood
On this page
Problem statement
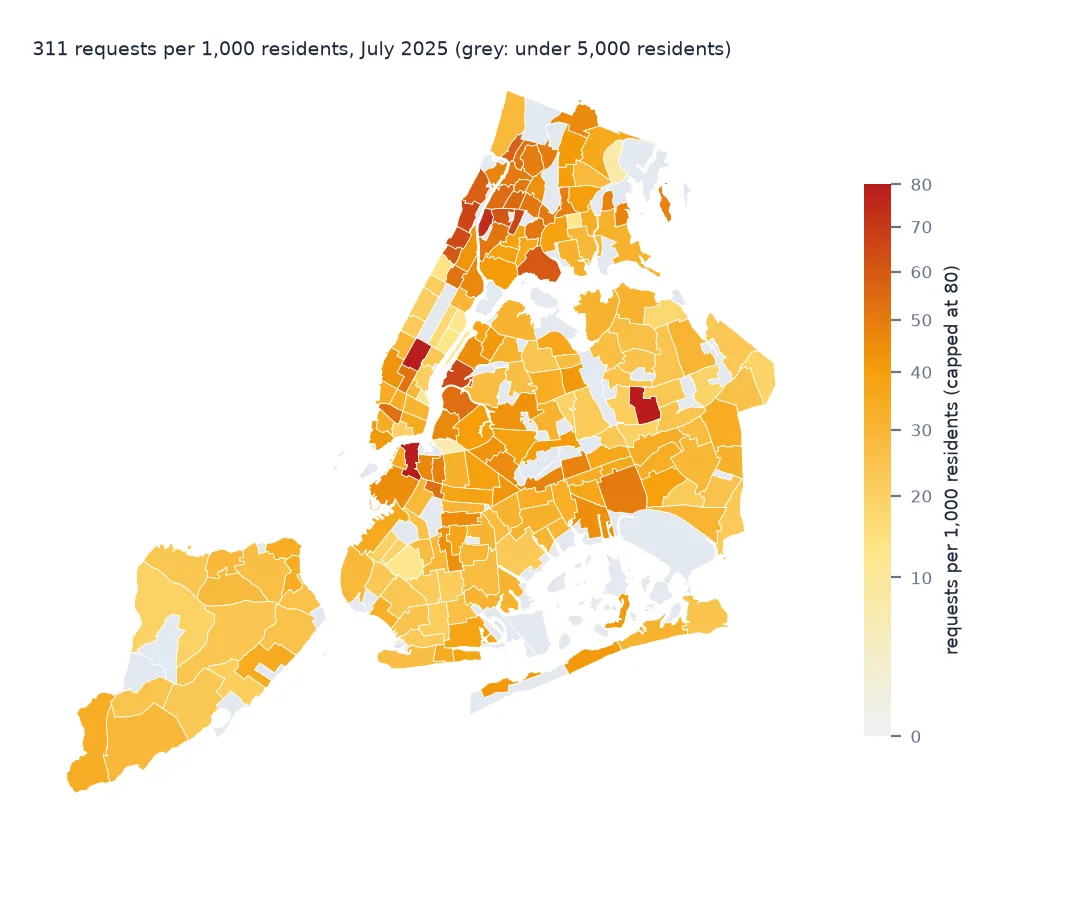
A map of raw 311 counts is a population map with extra steps: the busiest neighbourhoods are the most populous ones. Dividing by residents fixes that and creates new problems — business districts with few residents shoot to the top, and a single address with a thousand calls can make a neighbourhood look troubled. This guide joins the July 2025 requests to New York's 262 Neighborhood Tabulation Areas, divides by their 2020 Census population, and works through what the rates show and where they mislead.
Quick answer
Spatially join request points to NTA polygons, count per NTA, divide by the NTA's population from City Planning's 2020 Census table, and show rates only for residential NTAs (here 5,000 people or more). Check the top of the ranking for single addresses.
pts = july.dropna(subset=["latitude", "longitude"])
pts = gpd.GeoDataFrame(pts[["complaint_type"]], geometry=gpd.points_from_xy(pts.longitude, pts.latitude), crs=4326)
j = gpd.sjoin(pts, nta[["NTA2020", "geometry"]], predicate="within", how="inner")
c = j.groupby("NTA2020").size().rename("requests")
m = nta.merge(c, on="NTA2020", how="left").fillna({"requests": 0})
m["per_1000"] = 1000 * m.requests / m.Pop_20
res = m[m.Pop_20 >= 5000]
print(f"July requests joined to neighbourhoods: {len(j):,}; residential NTAs (5,000+ people): {len(res)}")
print("most per 1,000 residents:", res.nlargest(5, "per_1000")[["NTAName", "per_1000"]].round(1).values.tolist())
print("fewest:", res.nsmallest(3, "per_1000")[["NTAName", "per_1000"]].round(1).values.tolist())
July requests joined to neighbourhoods: 310,622; residential NTAs (5,000+ people): 197
most per 1,000 residents: [['Midtown-Times Square', 141.9], ['Pomonok-Electchester-Hillcrest', 128.1], ['Downtown Brooklyn-DUMBO-Boerum Hill', 81.1], ['Highbridge', 73.9], ['Claremont Village-Claremont (East)', 66.3]]
fewest: [['South Williamsburg', 6.5], ['Co-op City', 7.7], ['Stuyvesant Town-Peter Cooper Village', 10.3]]
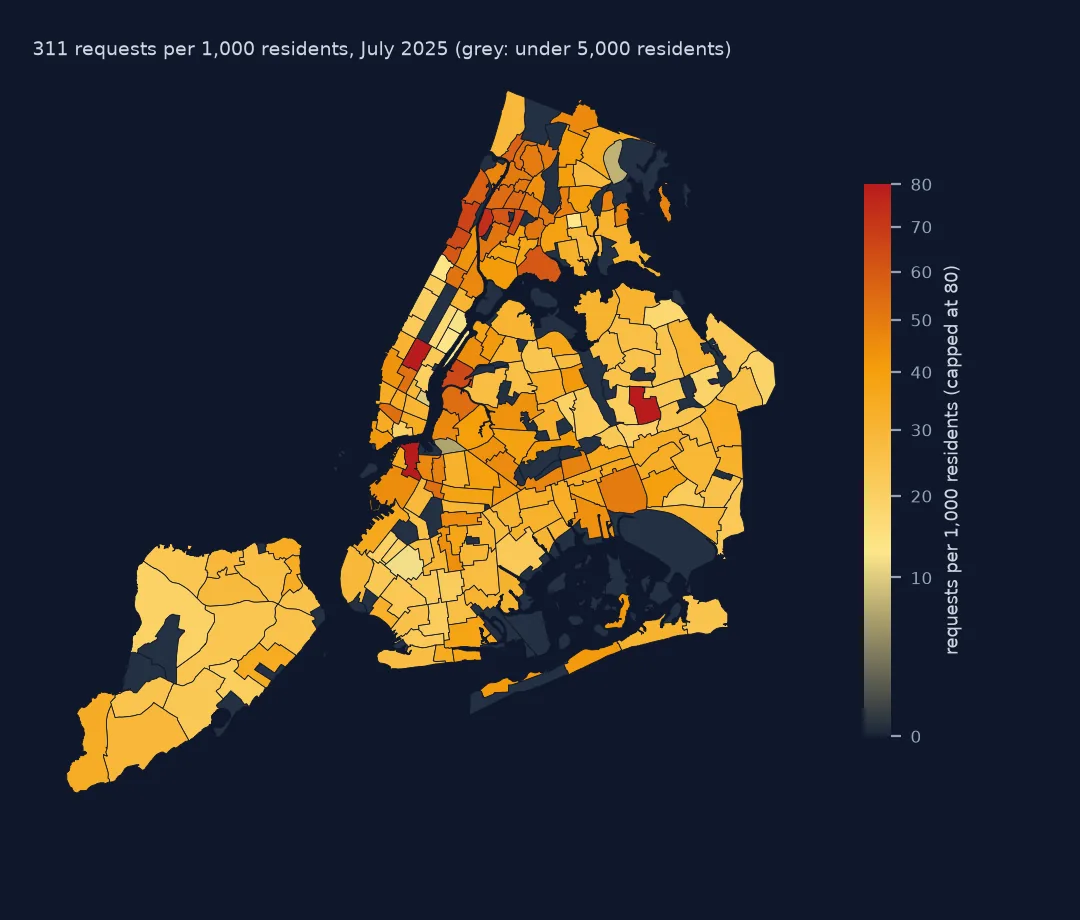
310,622 July requests fall in an NTA, and 197 NTAs have at least 5,000 residents. Midtown-Times Square has the highest rate, 141.9 requests per 1,000 residents in one month — many visitors and businesses, few residents. Second is Pomonok-Electchester-Hillcrest in Queens (128.1), where one address accounts for a large part of the total, as step 3 shows. The fewest are in South Williamsburg (6.5) and Co-op City (7.7).
Joining, dividing and checking
1. Neighbourhoods and their population
print(f"{len(nta)} NTAs; population 2020: {nta.Pop_20.sum():,}; NTAs with fewer than 1,000 people (parks, airports, cemeteries): {(nta.Pop_20 < 1000).sum()}")262 NTAs; population 2020: 8,804,190; NTAs with fewer than 1,000 people (parks, airports, cemeteries): 63
The 262 NTAs hold 8,804,190 people in 2020. 63 have fewer than 1,000 — parks, cemeteries, airports, industrial zones — and any rate for them is meaningless.
2. Points into polygons
print(f"points outside every NTA: {len(pts) - len(j):,}")
print("requests in NTAs with under 1,000 residents:", int(m[m.Pop_20 < 1000].requests.sum()))
points outside every NTA: 84
requests in NTAs with under 1,000 residents: 3322
Only 84 requests with coordinates fall outside every NTA (in the water or just past the city line). The non-residential NTAs received 3,322 July requests — real requests with nobody to divide them by; show them as counts.
3. Count against rate
print("most requests (count):", m.nlargest(3, "requests")[["NTAName", "requests"]].values.tolist())
rk = res[["requests", "per_1000"]].rank(ascending=False)
print(f"rank correlation of count with rate: {rk.requests.corr(rk.per_1000, method='spearman'):.2f}")
second = res.nlargest(2, "per_1000").iloc[1]
inside = july.loc[j[j.NTA2020 == second.NTA2020].index]
a = inside.groupby(["incident_address", "complaint_type"]).size().sort_values(ascending=False)
print(f"{second.NTAName}: {len(inside):,} requests; busiest address and type: {a.index[0][0]}, {a.index[0][1]} ({a.iloc[0]:,})")
most requests (count): [['Washington Heights (South)', 4765.0], ['Pomonok-Electchester-Hillcrest', 4568.0], ['Washington Heights (North)', 4209.0]]
rank correlation of count with rate: 0.64
Pomonok-Electchester-Hillcrest: 4,568 requests; busiest address and type: 82-68 164 STREET, Drug Activity (1,083)
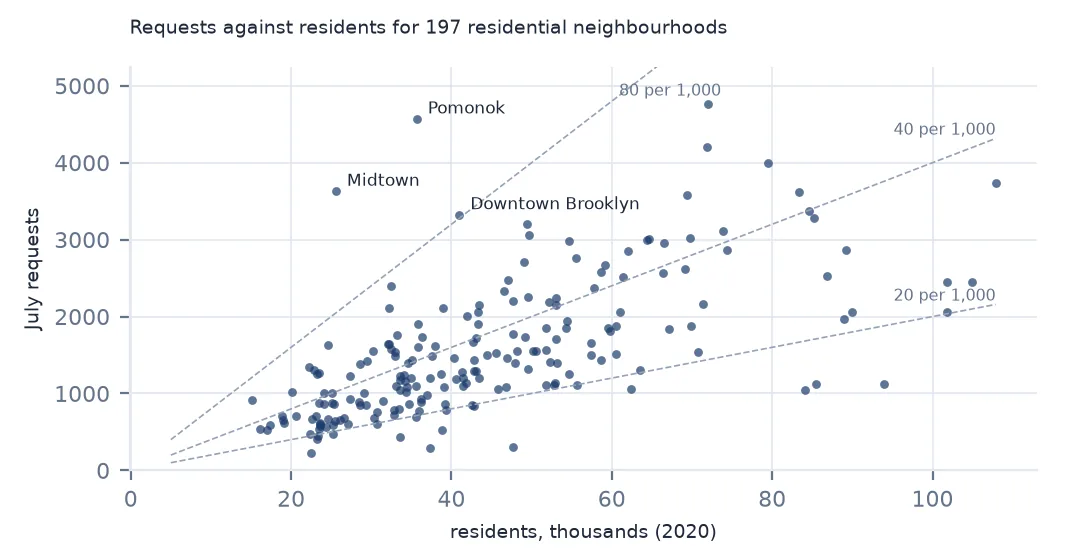
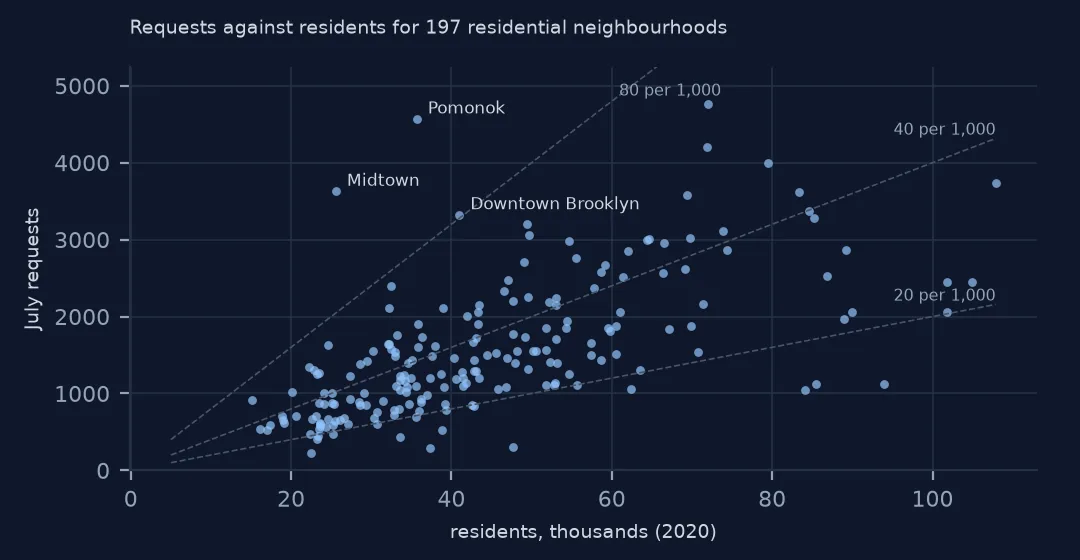
By count, Washington Heights South and North and Pomonok lead. In Pomonok, a single address on 164th Street is behind nearly a quarter of the month's 4,568 requests: 1,083 drug-activity calls. Count and rate rank NTAs differently (rank correlation 0.64), so the map you publish answers a different question depending on which you choose.
4. Different complaints, different maps
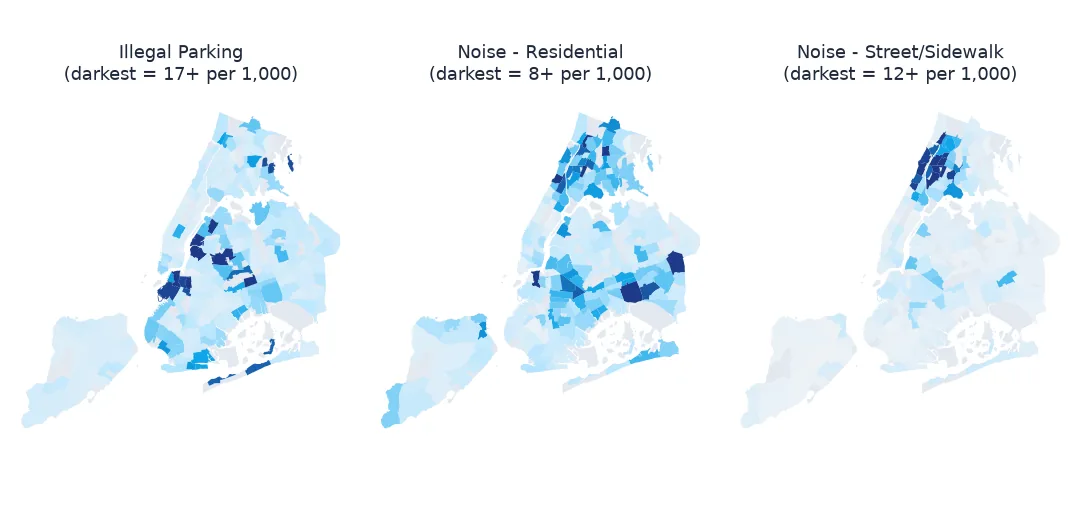
for t in ["Illegal Parking", "Noise - Residential", "Noise - Street/Sidewalk"]:
    ct = j[j.complaint_type == t].groupby("NTA2020").size()
    r = (1000 * ct / nta.set_index("NTA2020").Pop_20).reindex(res.NTA2020).dropna()
    print(f"{t}: highest per 1,000 in {nta.set_index('NTA2020').NTAName[r.idxmax()]} ({r.max():.1f})")
Illegal Parking: highest per 1,000 in Downtown Brooklyn-DUMBO-Boerum Hill (39.0)
Noise - Residential: highest per 1,000 in Queens Village (10.8)
Noise - Street/Sidewalk: highest per 1,000 in Claremont Village-Claremont (East) (25.8)
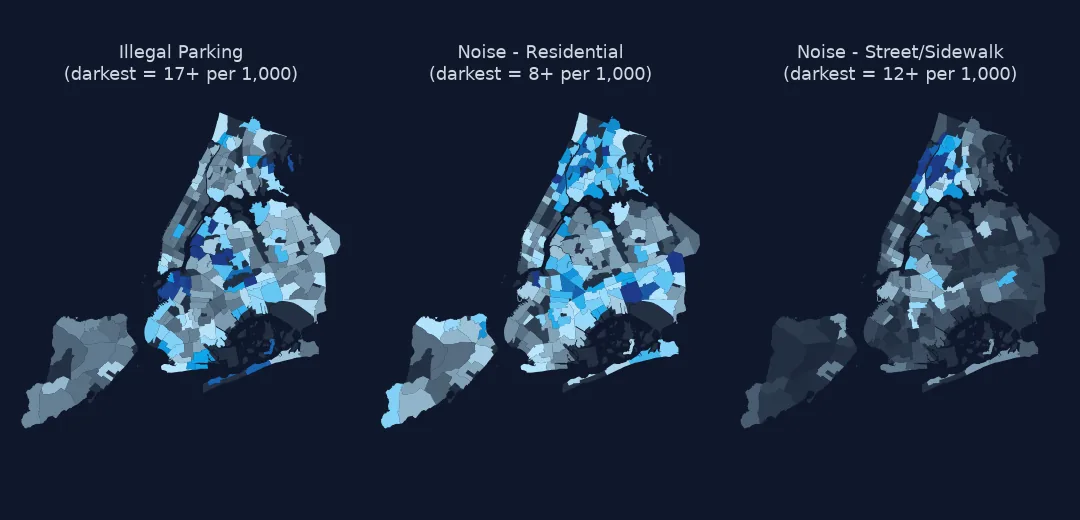
Each complaint type has its own geography: illegal parking per resident is highest in Downtown Brooklyn-DUMBO-Boerum Hill (39.0 per 1,000), residential noise in Queens Village (10.8) and street noise in Claremont Village in the Bronx (25.8).
Boroughs and concentration
The data used on this page
NYC 311 requests created in July 2025 (NYC Open Data, saved copy), the 2020 Neighborhood Tabulation Areas (saved copy) and NYC City Planning's 2020 Census population by NTA (saved copy).
from pathlib import Path

import geopandas as gpd
import numpy as np
import pandas as pd
import requests

Path("data").mkdir(exist_ok=True)
# NYC 311 Service Requests (NYC Open Data, dataset erm2-nwe9) as queried on 15 October 2026 and saved on this site,
# because requests that are still open keep changing: every request created in July 2025, and the 2025 daily counts by
# agency, complaint type, borough and channel. The queries are in data/README.txt; the live API is
# https://data.cityofnewyork.us/resource/erm2-nwe9.csv
FILES = ["nyc-311-2025-daily-counts-2026-10-15.zip", "nyc-311-2025-07-requests-2026-10-15.zip", "nyc-census-2020-by-geography-2026-10-15.xlsx", "nyc-nta-2020-2026-10-15.zip"]
for name in FILES:
    if not Path(f"data/{name}").exists():
        Path(f"data/{name}").write_bytes(requests.get(f"https://data.spatialworkflow.io/{name}", timeout=600).content)
daily = pd.read_csv("data/nyc-311-2025-daily-counts-2026-10-15.zip", parse_dates=["day"])
july = pd.read_csv("data/nyc-311-2025-07-requests-2026-10-15.zip", low_memory=False,
                   dtype={"unique_key": str, "incident_zip": str, "bbl": str, "community_board": str},
                   parse_dates=["created_date", "closed_date", "resolution_action_updated_date"])
cen = pd.read_excel("data/nyc-census-2020-by-geography-2026-10-15.xlsx", sheet_name="2010, 2020, and Change", skiprows=3)
boro_pop = cen[cen.GeoType == "Boro"].assign(b=lambda d: d.Name.str.upper()).set_index("b").Pop_20
from shapely import wkt
n = pd.read_csv("data/nyc-nta-2020-2026-10-15.zip")
nta = gpd.GeoDataFrame(n.drop(columns="the_geom"), geometry=n.the_geom.map(wkt.loads), crs=4326)
nta = nta.merge(cen[cen.GeoType == "NTA2020"][["GeoID", "Pop_20"]].rename(columns={"GeoID": "NTA2020"}), on="NTA2020", how="left")
print(f"NYC 311: {daily.n.sum():,} requests in the 2025 daily counts; {len(july):,} requests created in July 2025")
NYC 311: 3,655,042 requests in the 2025 daily counts; 315,883 requests created in July 2025
Example 1: by borough within the map
b = m.groupby("BoroName")[["requests", "Pop_20"]].sum()
print("July requests per 1,000 residents by borough:", (1000 * b.requests / b.Pop_20).round(1).to_dict())
July requests per 1,000 residents by borough: {'Bronx': 44.0, 'Brooklyn': 33.0, 'Manhattan': 35.8, 'Queens': 34.0, 'Staten Island': 26.5}
By borough, the Bronx has the most July requests per resident (44.0 per 1,000) and Staten Island the fewest (26.5).
Example 2: share from the busiest neighbourhoods
s = m.requests.sort_values(ascending=False)
print(f"top 10% of NTAs: {s.head(len(s) // 10).sum() / s.sum():.1%} of requests")
top 10% of NTAs: 27.6% of requests
The busiest tenth of NTAs receive 27.6% of all July requests.
Rates for people, counts for places
Dividing by residents is right when the question is about residents: how much a neighbourhood's people use 311, or how exposed they are to noise or housing problems. It is wrong for places where most activity comes from non-residents — Midtown, airports, parks — where requests per square kilometre or per visitor would be the better denominator. A map of 311 rates should mask or separately mark those areas, as the 5,000-resident threshold here does.
The Pomonok case shows the other trap: a rate built from requests is sensitive to repeat callers. Before mapping rates, merge repeat requests into incidents or at least check whether a single address drives a neighbourhood's figure.
Choices that change the map
- Population year. 2020 Census counts are the denominator; neighbourhoods that grew since then look busier than they are.
- Population threshold. 5,000 residents is a judgement; show which NTAs are masked.
- Month. July is noise season; heat complaints make a winter map look very different.
- NTA version. The 2020 NTAs differ from the 2010 ones; join requests by location, not by a code from another dataset.
Internal links
- How to analyse NYC 311 service requests — the data
- How to find 311 complaint hotspots with H3 — hexagons instead of neighbourhoods
- NTA codes do not match the boundaries — the 2010 and 2020 NTAs
FAQ
Which New York neighbourhood makes the most 311 complaints per resident?
In July 2025, Midtown-Times Square (141.9 per 1,000 residents), because it has few residents; among residential neighbourhoods, Pomonok-Electchester-Hillcrest, driven by one address.
What population data matches NYC's neighbourhoods?
City Planning's 2020 Census tables by Neighborhood Tabulation Area, which share the NTA2020 codes of the boundary file.