
How to Calculate Traffic Speeds by Hour from Taxi Trips
On this page
Problem statement
Taxi trips are a city-wide speed sensor: each one has a start time, an end time and a metered distance. Turning them into "how fast does traffic move at 8 a.m.?" takes three decisions that change the answer — which trips to throw out as impossible, whether to average speeds or divide total distance by total time, and which trips to compare. This guide makes those decisions on the 48,722,602 yellow-taxi trips of 2025 and produces weekday and weekend speed profiles by hour, by zone and by month.
Quick answer
Filter to plausible trips (distance and duration in a believable range, payment type not 0), group by hour, and divide the sum of distances by the sum of durations. That is the average speed of the taxi fleet in that hour, not the average of trip speeds.
ok = """trip_distance between 0.3 and 30 and epoch(tpep_dropoff_datetime - tpep_pickup_datetime) between 60 and 10800
        and payment_type <> 0"""
hr = con.sql(f"""
    select hour(tpep_pickup_datetime) as h,
           sum(trip_distance) / sum(epoch(tpep_dropoff_datetime - tpep_pickup_datetime) / 3600) as mph
    from trips where isodow(tpep_pickup_datetime) <= 5 and {ok} group by 1 order by 1""").df().set_index("h").mph
print(f"weekday taxi speed, 2025: slowest {hr.min():.1f} mph at {hr.idxmin()}:00, fastest {hr.max():.1f} mph at {hr.idxmax()}:00")
print(hr.round(1).loc[[0, 5, 8, 12, 15, 18, 21]].to_dict())
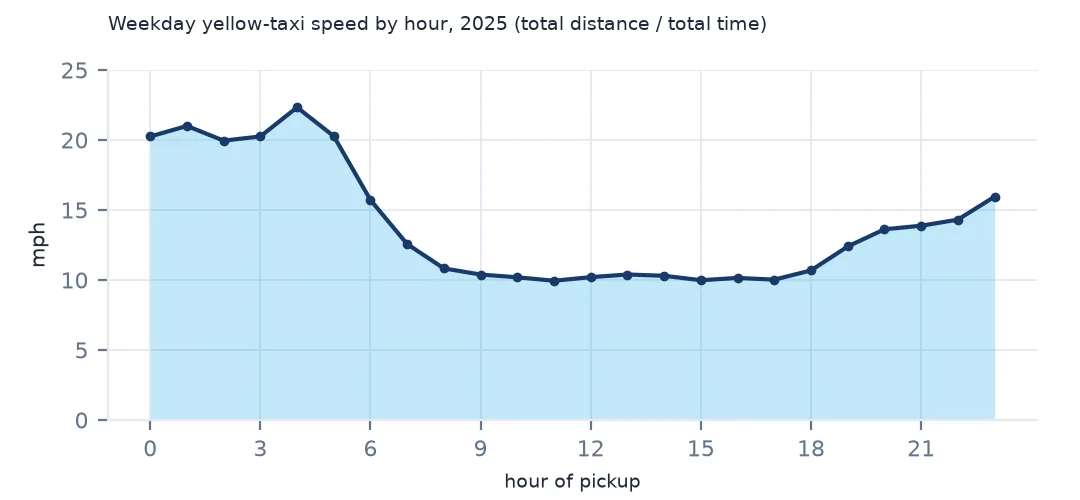
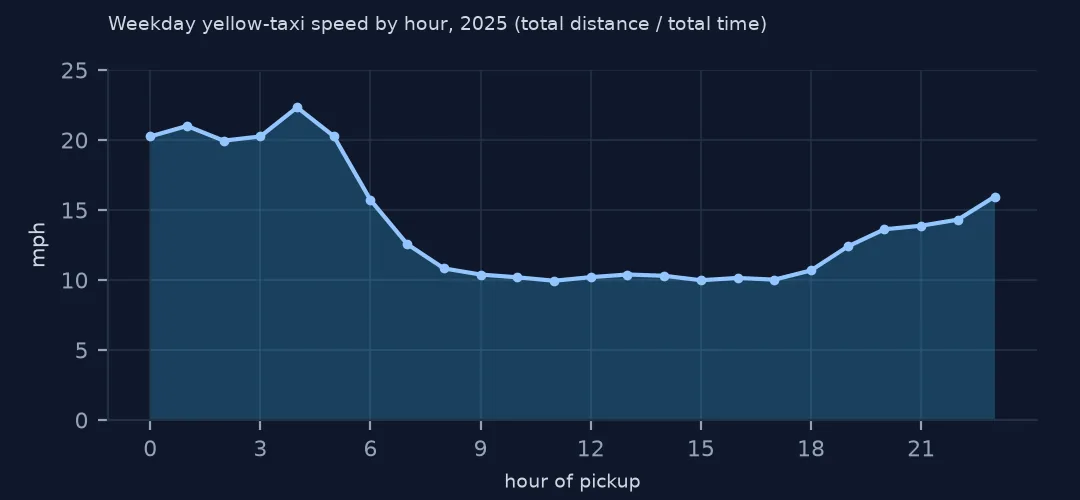
weekday taxi speed, 2025: slowest 9.9 mph at 11:00, fastest 22.3 mph at 4:00
{0: 20.3, 5: 20.3, 8: 10.8, 12: 10.2, 15: 10.0, 18: 10.7, 21: 13.9}
On weekdays in 2025 taxis averaged 22.3 mph at 4:00 and 9.9 mph at 11:00. Speeds fall by half between 5:00 and 8:00 and stay near 10 mph through the working day, rising again only after the evening peak.
Cleaning trips into speeds
1. Duration and distance on each trip
d = con.sql("""select epoch(tpep_dropoff_datetime - tpep_pickup_datetime) / 60 as minutes, trip_distance as miles
               from trips where payment_type <> 0 using sample 1% (bernoulli, 42)""").df()
print(d.describe(percentiles=[0.01, 0.5, 0.99]).round(2).to_string())
minutes miles
count 371393.00 371393.00
mean 16.99 3.53
std 29.47 55.46
min -51.15 0.00
1% 0.00 0.00
50% 12.43 1.70
99% 74.30 20.03
max 4359.33 19457.90
A 1% sample is enough to see the shape. The median trip lasts 12.43 minutes and covers 1.70 miles, but the extremes are impossible: a duration of −51 minutes, one of 4,359 minutes, a distance of 19,457.9 miles. The 99th percentiles (74.3 minutes, 20.03 miles) are where real trips end.
2. Drop what cannot be a trip
bad = con.sql("""select count(*) as n,
      count(*) filter (where trip_distance <= 0) as zero_miles,
      count(*) filter (where epoch(tpep_dropoff_datetime - tpep_pickup_datetime) < 60) as under_a_minute,
      count(*) filter (where trip_distance / nullif(epoch(tpep_dropoff_datetime - tpep_pickup_datetime) / 3600, 0) > 80) as over_80_mph
      from trips where payment_type <> 0""").df().iloc[0]
print({k: f"{v / bad.n:.2%}" for k, v in bad.items() if k != "n"})
{'zero_miles': '1.34%', 'under_a_minute': '2.84%', 'over_80_mph': '0.02%'}
1.34% of trips have zero distance and 2.84% last under a minute — cancelled or test trips — while only 0.02% imply more than 80 mph. Dropping them barely changes a count but matters for speed, because a zero-distance trip pulls an average down and a one-second trip with a distance sends it to infinity.
3. Total distance over total time
both = con.sql(f"""select sum(trip_distance) / sum(epoch(tpep_dropoff_datetime - tpep_pickup_datetime) / 3600) as ratio_of_sums,
                         avg(trip_distance / (epoch(tpep_dropoff_datetime - tpep_pickup_datetime) / 3600)) as mean_of_ratios,
                         median(trip_distance / (epoch(tpep_dropoff_datetime - tpep_pickup_datetime) / 3600)) as median_trip
                  from trips where {ok}""").df().round(2)
print(both.to_string(index=False))
ratio_of_sums mean_of_ratios median_trip
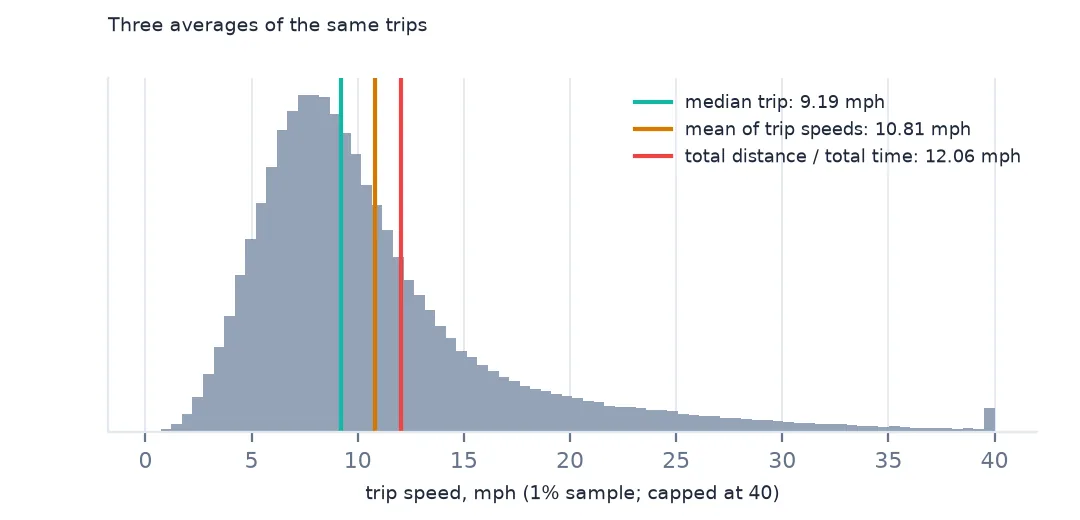
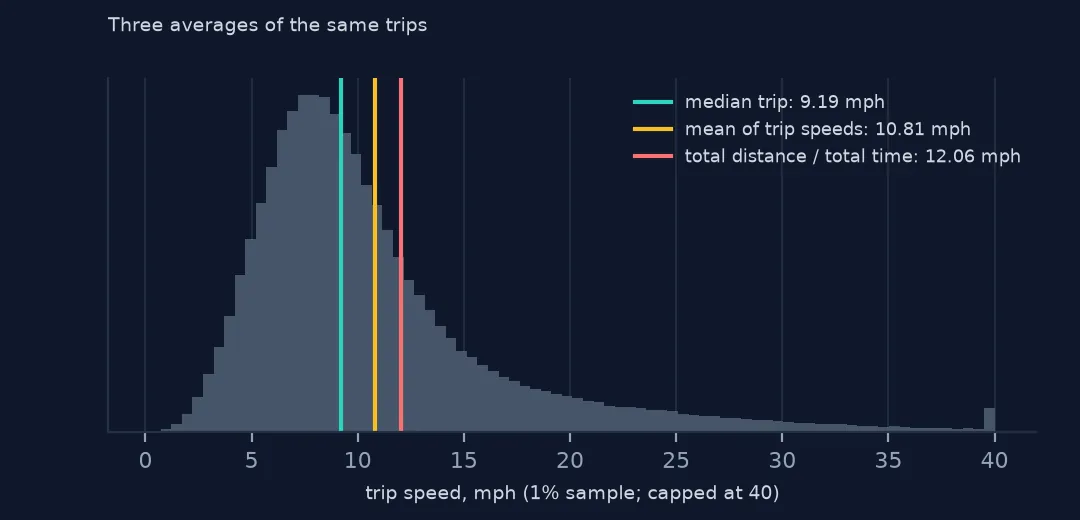
12.06 10.81 9.19
The three ways of averaging disagree by a third: total distance over total time gives 12.06 mph, the mean of per-trip speeds 10.81 and the median trip 9.19. The ratio of sums is the right one for traffic, because it weights each trip by its length; a short crawl across Midtown and a fast run on the highway then count in proportion to the road they used.
4. Speed by zone
zs = con.sql(f"""select PULocationID as LocationID, count(*) as n,
                 sum(trip_distance) / sum(epoch(tpep_dropoff_datetime - tpep_pickup_datetime) / 3600) as mph
                 from trips where PULocationID = DOLocationID and {ok} and isodow(tpep_pickup_datetime) <= 5
                 and hour(tpep_pickup_datetime) between 8 and 18 group by 1 having count(*) >= 500""").df()
zs = zs.merge(lookup, on="LocationID")
print(f"{len(zs)} zones with 500+ internal weekday trips; slowest:")
print(zs.nsmallest(4, "mph")[["Zone", "Borough", "n", "mph"]].round(2).to_string(index=False))
56 zones with 500+ internal weekday trips; slowest:
Zone Borough n mph
Midtown Center Manhattan 36604 4.12
Times Sq/Theatre District Manhattan 13201 4.26
Midtown East Manhattan 20811 4.44
Garment District Manhattan 2180 4.51
Trips that start and end in the same zone measure that zone's streets. Of the 56 zones with enough of them, the slowest are Midtown Center (4.12 mph), Times Square (4.26), Midtown East and the Garment District — walking pace, on weekdays between 8:00 and 18:00.
Weekends and months
The data used on this page
The NYC Taxi & Limousine Commission's yellow-taxi trip records for 2025 and its taxi zones. trip_distance is the metered distance in miles; the speeds are door-to-door averages including stops at lights, not speeds on a road segment.
from pathlib import Path

import duckdb
import geopandas as gpd
import numpy as np
import pandas as pd
import requests

Path("data").mkdir(exist_ok=True)
TLC = "https://d37ci6vzurychx.cloudfront.net/trip-data/"
FILES = [f"yellow_tripdata_2025-{m:02d}.parquet" for m in range(1, 13)]
for name in FILES:
    if not Path(f"data/{name}").exists():
        with requests.get(TLC + name, stream=True, timeout=600) as r:      # 50-80 MB a month
            r.raise_for_status()
            with open(f"data/{name}", "wb") as f:
                for chunk in r.iter_content(1 << 20):
                    f.write(chunk)
# zones and lookup as the TLC served them on 15 October 2026 (it reissues them; the live copies are
# https://d37ci6vzurychx.cloudfront.net/misc/taxi_zones.zip and .../misc/taxi_zone_lookup.csv)
for name in ["nyc-taxi-zones-2026-10-15.zip", "nyc-taxi-zone-lookup-2026-10-15.csv"]:
    if not Path(f"data/{name}").exists():
        Path(f"data/{name}").write_bytes(requests.get(f"https://data.spatialworkflow.io/{name}", timeout=300).content)
zones = gpd.read_file("zip://data/nyc-taxi-zones-2026-10-15.zip!taxi_zones/taxi_zones.shp")    # EPSG:2263, feet
lookup = pd.read_csv("data/nyc-taxi-zone-lookup-2026-10-15.csv")

con = duckdb.connect()
con.sql("create view trips as select * from read_parquet('data/yellow_tripdata_2025-*.parquet', union_by_name = true)")
print(f"{con.sql('select count(*) from trips').fetchone()[0]:,} rows in trips; {len(zones)} zone polygons, {len(lookup)} lookup rows")
48,722,602 rows in trips; 263 zone polygons, 265 lookup rows
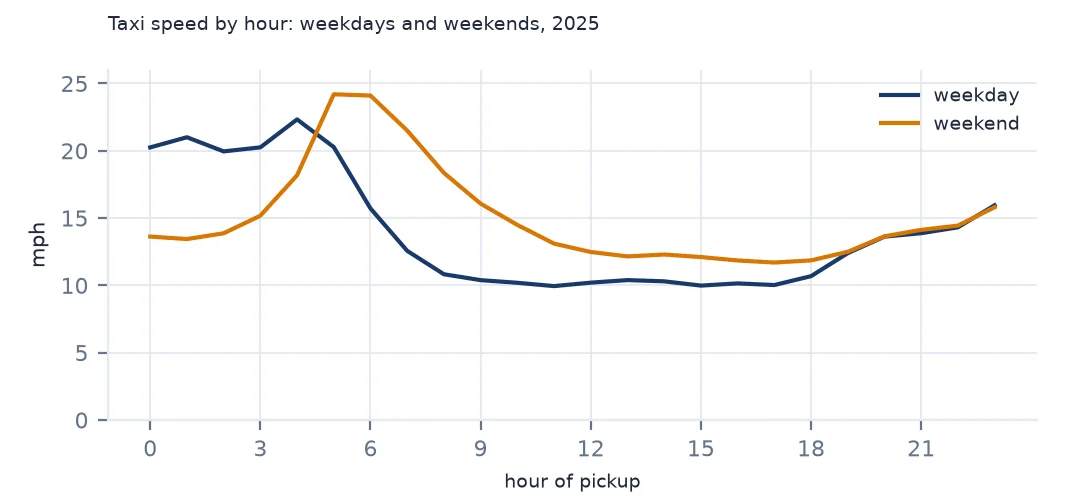
Example 1: weekday against weekend
wk = con.sql(f"""select isodow(tpep_pickup_datetime) >= 6 as weekend, hour(tpep_pickup_datetime) as h,
                 sum(trip_distance) / sum(epoch(tpep_dropoff_datetime - tpep_pickup_datetime) / 3600) as mph
                 from trips where {ok} group by 1, 2""").df().pivot(index="h", columns="weekend", values="mph")
print(f"at 14:00: weekday {wk.loc[14, False]:.1f} mph, weekend {wk.loc[14, True]:.1f} mph")
print(f"at 08:00: weekday {wk.loc[8, False]:.1f} mph, weekend {wk.loc[8, True]:.1f} mph")
at 14:00: weekday 10.3 mph, weekend 12.3 mph
at 08:00: weekday 10.8 mph, weekend 18.4 mph
At 8:00 a weekend taxi averages 18.4 mph against 10.8 on a weekday; by 14:00 the gap is small (12.3 against 10.3). Weekend traffic builds through the day instead of arriving in a morning peak.
Example 2: month by month
mo = con.sql(f"""select month(tpep_pickup_datetime) as m, sum(trip_distance) / sum(epoch(tpep_dropoff_datetime - tpep_pickup_datetime) / 3600) as mph
                 from trips where {ok} and isodow(tpep_pickup_datetime) <= 5 and hour(tpep_pickup_datetime) between 8 and 18
                 group by 1 order by 1""").df().set_index("m").mph
print("weekday daytime speed by month, mph:", mo.round(2).to_dict())
weekday daytime speed by month, mph: {1: 11.38, 2: 10.87, 3: 10.79, 4: 10.55, 5: 9.85, 6: 10.24, 7: 10.53, 8: 11.27, 9: 9.88, 10: 9.73, 11: 9.6, 12: 9.37}
Weekday daytime speeds fell through the year, from 11.38 mph in January to 9.37 in December. The slowest months are the autumn ones and December, when holiday traffic peaks; August is faster (11.27).
What a taxi speed measures
A taxi speed is a door-to-door journey speed: the metered distance divided by the time from pickup to drop-off, including stops at lights and for passengers. It is lower than the free-flow speed on any road segment and it depends on the mix of trips — taxis drive mostly short trips in dense Manhattan — so it is a fair measure of how fast the taxi network moves, not of traffic in general.
Within that meaning it is a strong source: millions of trips, every hour, every zone, consistently measured since 2009. Before-and-after studies, like the congestion pricing comparison, work because whatever biases the measure has are the same in both periods.
Things that bias a taxi speed
- Hour of pickup, not of travel. A trip that starts at 7:50 and ends at 8:40 is counted at 7:00; for long trips, split time across hours or use the midpoint.
- Metered distance includes detours. It is longer than the straight line or the shortest route, so speeds per mile of route are slightly overstated.
- Payment type 0 rows have the same times and distances, but some of their distances are extreme; they are left out here to keep the filter simple.
- Zone-internal trips are short. Speeds for trips within one zone are lower than for trips through it, because a larger share of each trip is stopping and starting.
Internal links
- How to measure the effect of congestion pricing — speeds before and after
- How to analyse NYC taxi trip records — the files and the query engine
- How to analyse the hourly traffic profile — the same day measured by traffic counters
FAQ
How fast do taxis move in Manhattan at rush hour?
Across all yellow-taxi trips on weekdays in 2025, 10.8 mph at 8:00; within Midtown Center, 4.12 mph on weekday days.
Should I average the speed of each trip?
No: divide the total distance by the total time. The mean of trip speeds was 10.81 mph against 12.06 for the ratio of sums.