
Forest Definitions Explained
On this page
Problem statement
"Forest" sounds like an observation. In data it is a definition: a threshold on tree canopy cover, a minimum area, a minimum tree height and sometimes a land-use condition. FAO counts land with more than 10% canopy on at least 0.5 ha with trees able to reach 5 m. Many national definitions use 20–30%. Global maps often ship canopy cover as a percentage and leave the threshold to the user.
The choice changes forest area, deforestation rates and which landscapes count as forest at all — savannas, plantations and regrowth sit right at the thresholds. Every forest number needs its definition attached, and most comparison failures between sources are definition mismatches rather than disagreements about trees.
Quick answer
A forest definition has up to four parts:
| Part | FAO FRA | Typical national / research use |
|---|---|---|
| canopy cover | > 10% | 10–30% |
| minimum area | 0.5 ha | 0.5–1 ha, or one pixel |
| minimum tree height | 5 m (at maturity) | often ignored in remote sensing |
| land use | excludes agriculture and urban | usually ignored in remote sensing |
import numpy as np, rasterio
from scipy import ndimage

with rasterio.open("rondonia_gfc.tif") as src:          # Hansen stack, reading guide
    treecover, lossyear, datamask = src.read()
    tf = src.transform
px_ha = (abs(tf.a) * 111_320 * np.cos(np.radians(-10.55))) * (abs(tf.e) * 110_574) / 1e4
land = datamask == 1

print(f"{'threshold':<11}{'forest 2000 ha':>16}{'lost by 2024':>14}{'share lost':>12}")
for t in (10, 20, 30, 50, 75):
    f = (treecover > t) & land
    lost = f & (lossyear > 0)
    print(f"> {t:>2}%{f.sum() * px_ha:>20,.0f}{lost.sum() * px_ha:>14,.0f}{lost.mean() / f.mean():>12.1%}")
threshold forest 2000 ha lost by 2024 share lost
> 10% 151,300 62,189 41.1%
> 20% 144,546 61,724 42.7%
> 30% 139,689 61,306 43.9%
> 50% 129,751 59,901 46.2%
> 75% 111,849 54,663 48.9%
In a closed-canopy Amazon landscape the threshold matters less than one might fear: going from 10% to 50% moves the forest area by 14% and the share lost by five points, because most pixels are either dense forest or cleared pasture. The threshold's leverage shows up in landscapes with a lot of intermediate cover — the next example.
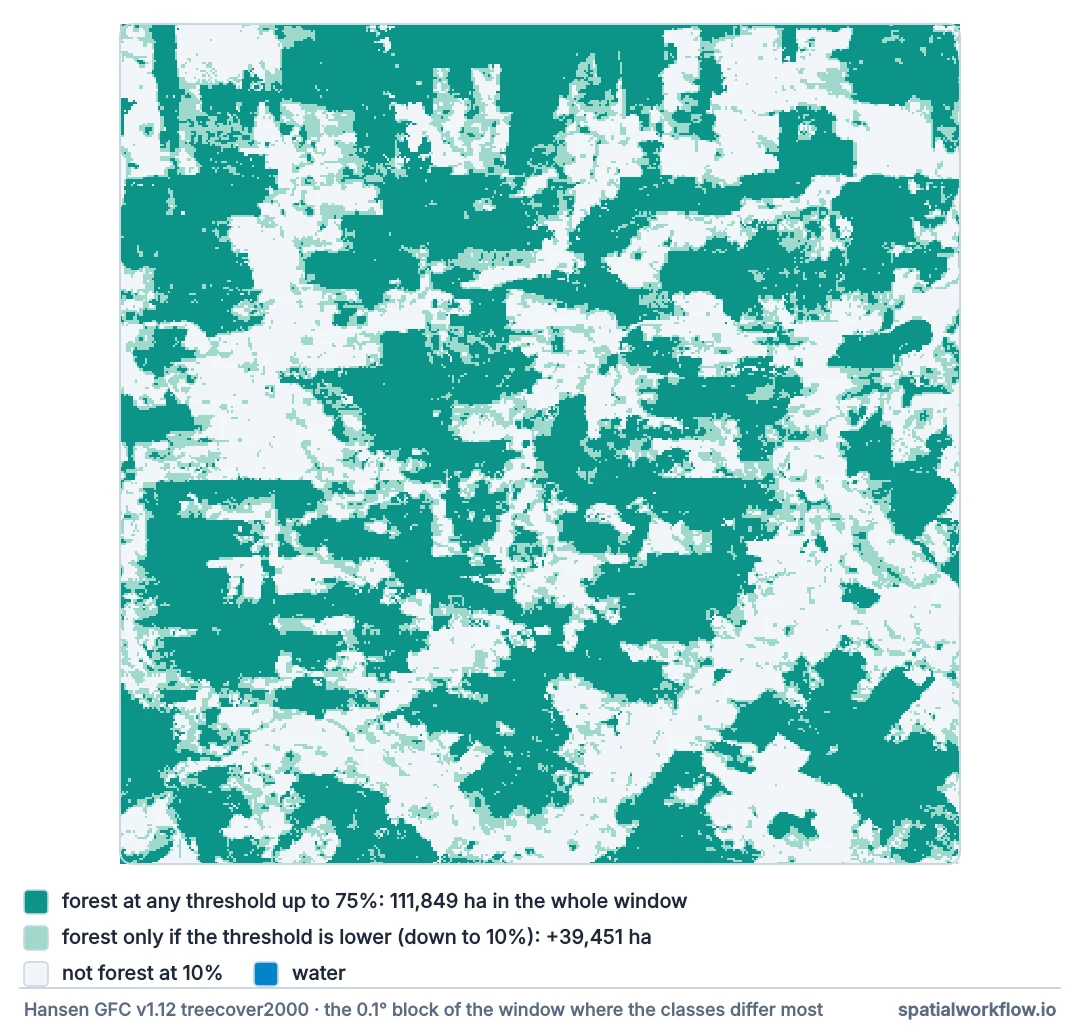
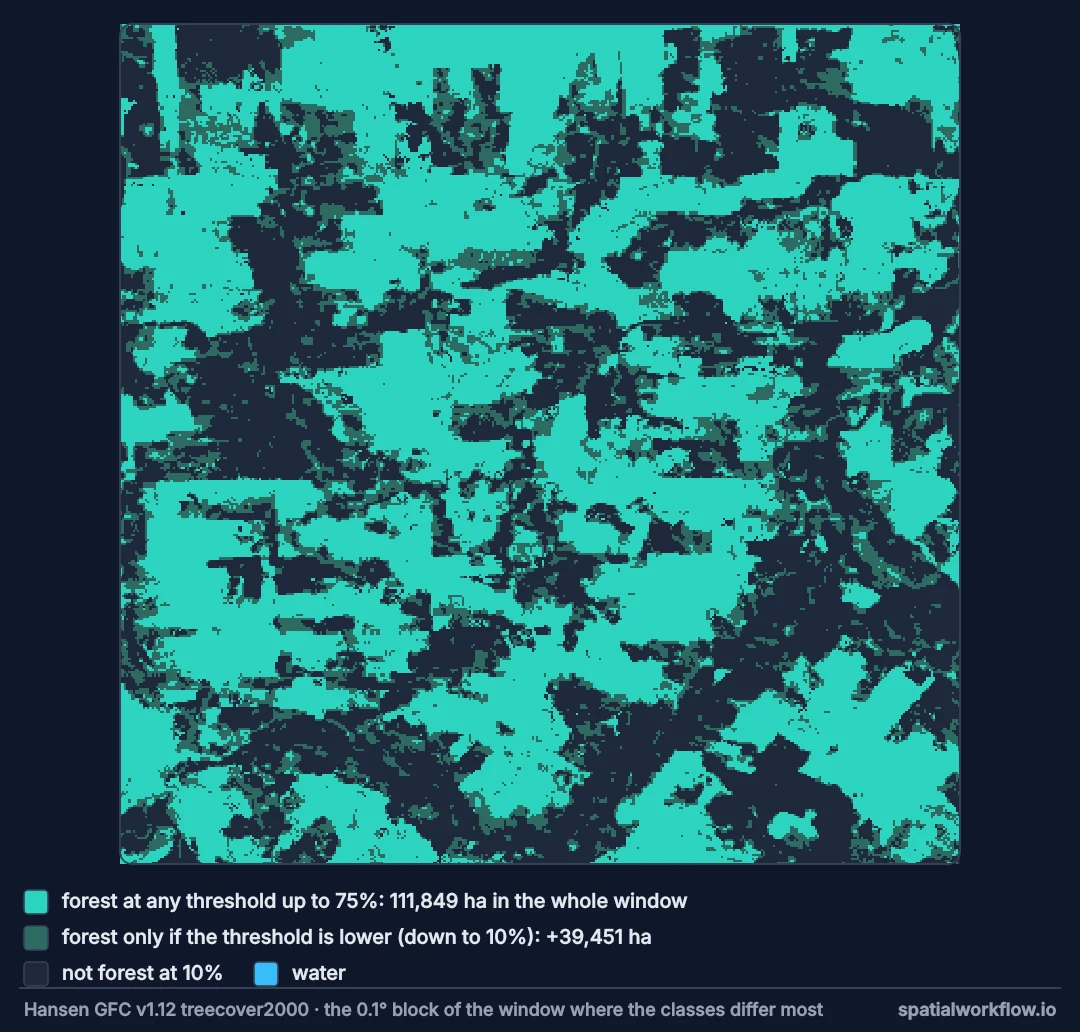
Know the source's definition, then apply threshold and area
1. Know which definition your source uses
National statistics follow national definitions; FAO's Forest Resources Assessment follows its own; remote-sensing products report canopy cover or a class. Read the documentation before comparing.
2. Apply the canopy threshold explicitly
For continuous canopy products (Hansen, ETH canopy height), the threshold is yours to choose. Use the definition the question is framed in and say which.
3. Apply the minimum area
Remove forest patches smaller than the minimum area. With Hansen's pixels of about 0.075 ha in the tropics, 0.5 ha is about seven pixels; at 10 m, fifty.
4. Decide about land use
FAO excludes tree crops, urban parks and agroforestry in many cases; satellite products cannot see land use. Plantations count as forest in canopy terms and often not in policy terms.
5. Report the definition with every number
"Forest area 12,000 ha" is incomplete. "Tree cover > 30% on patches ≥ 0.5 ha, Hansen 2000" is a finding.
Where the threshold and minimum area matter
The data used on this page
The Rondônia window used throughout the forest guides (63.0°–62.5°W, 10.8°–10.3°S): Hansen Global Forest Change v1.12 — tree cover in 2000, the year of loss, and the data mask — read from Google's storage into a three-band rondonia_gfc.tif, as in the Hansen reading guide.
import os

import rasterio
from rasterio.windows import from_bounds

W, S, E, N = -63.0, -10.8, -62.5, -10.3
V = "GFC-2024-v1.12"
if not os.path.exists("rondonia_gfc.tif"):
    bands = []
    for name in ("treecover2000", "lossyear", "datamask"):
        url = f"https://storage.googleapis.com/earthenginepartners-hansen/{V}/Hansen_{V}_{name}_10S_070W.tif"
        with rasterio.open(url) as src:
            window = from_bounds(W, S, E, N, src.transform)
            bands.append(src.read(1, window=window))
            profile = src.profile | {"count": 3, "width": bands[0].shape[1], "height": bands[0].shape[0],
                                     "transform": src.window_transform(window), "compress": "deflate",
                                     "driver": "GTiff", "tiled": False}
    profile.pop("blockxsize", None)
    profile.pop("blockysize", None)
    with rasterio.open("rondonia_gfc.tif", "w", **profile) as dst:
        for i, band in enumerate(bands, start=1):
            dst.write(band, i)
with rasterio.open("rondonia_gfc.tif") as src:
    print(src.count, src.shape, src.crs, src.res)
3 (2000, 2000) EPSG:4326 (0.00025, 0.00025)
Example 1 — where the threshold matters
from rasterio.windows import from_bounds
def window(tile, bounds, v="GFC-2024-v1.12"):
    with rasterio.open(f"/vsicurl/https://storage.googleapis.com/earthenginepartners-hansen/"
                       f"{v}/Hansen_{v}_treecover2000_{tile}.tif") as src:
        return src.read(1, window=from_bounds(*bounds, src.transform))
cerrado = window("10S_050W", (-47.9, -15.9, -47.7, -15.7))          # savanna near Brasília
amazon = treecover
for name, tc in (("Amazon (Rondônia)", amazon), ("Cerrado (near Brasília)", cerrado)):
    shares = [(tc > t).mean() for t in (10, 30, 50)]
    print(f"{name:<24} forest share at >10%: {shares[0]:.0%}, >30%: {shares[1]:.0%}, "
          f">50%: {shares[2]:.0%}")
Amazon (Rondônia) forest share at >10%: 50%, >30%: 46%, >50%: 43%
Cerrado (near Brasília) forest share at >10%: 15%, >30%: 9%, >50%: 5%
In the savanna, most land has some tree cover and little has dense cover. The same threshold that barely matters in the Amazon decides whether the Cerrado is a forest landscape or not.
Example 2 — the minimum area
f30 = (treecover > 30) & land
labels, n = ndimage.label(f30, structure=np.ones((3, 3)))
sizes_ha = np.bincount(labels.ravel())[1:] * px_ha
for min_ha in (0, 0.5, 1, 5):
    keep = sizes_ha >= min_ha
    print(f"minimum patch {min_ha:>3} ha: {keep.sum():>6,} patches, "
          f"{sizes_ha[keep].sum():>9,.0f} ha of forest")
minimum patch 0 ha: 14,079 patches, 139,689 ha of forest
minimum patch 0.5 ha: 3,972 patches, 137,983 ha of forest
minimum patch 1 ha: 2,306 patches, 136,819 ha of forest
minimum patch 5 ha: 675 patches, 133,273 ha of forest
A minimum area removes many patches and little area: small patches are numerous and tiny. It matters most for fragmentation statistics and for counting "forests", least for total area.
Example 3 — which definition makes loss look largest
for t in (10, 30, 75):
    f = (treecover > t) & land
    print(f"> {t}% canopy: {(f & (lossyear > 0)).sum() * px_ha:,.0f} ha lost, "
          f"{(f & (lossyear > 0)).sum() / f.sum():.1%} of the baseline")
> 10% canopy: 62,189 ha lost, 41.1% of the baseline
> 30% canopy: 61,306 ha lost, 43.9% of the baseline
> 75% canopy: 54,663 ha lost, 48.9% of the baseline
Loss in hectares falls as the threshold rises, because fewer pixels qualify as forest; loss as a share of the baseline rises here, from 41% to 49%, because the densest forest was cleared at a higher rate than the sparse edges. In another landscape the share could move the other way. A campaign and a government can quote different numbers from the same data honestly — which is why the definition travels with the figure.
Thresholds, contested savannas and what sensors can apply
Why thresholds exist
Tree cover is continuous from bare ground to closed canopy. Policies, treaties and statistics need a binary: is this land forest or not? Any threshold is a convention, chosen to capture what a country or agency means by forest — dense tropical forest, open woodland, or anything with trees.
Why savannas and plantations are contested
Savannas have scattered trees at 10–40% cover. A 10% threshold calls much of them forest; a 30% threshold calls little of it forest. Plantations have high canopy cover and are harvested in cycles, so they appear as forest and as repeated "loss". Both are where definitions change conclusions.
Why remote sensing cannot apply the full FAO definition
FAO's definition includes land use: an orchard or an urban park with dense trees is not forest. Satellites see canopy, not use. Remote-sensing forest maps therefore approximate the FAO definition, and national reports reconcile the two with other data.
Tree height, unstocked land and pixel size
- Tree height: canopy height products (from lidar and GEDI) allow the 5 m criterion to be applied, where available.
- Temporary unstocked land — clearcuts expected to regrow — remains forest in FAO terms and appears as loss in remote sensing.
- Pixel size interacts with minimum area: 0.5 ha is 6 pixels at 30 m and 1 pixel at 70 m.
- Canopy cover in Hansen refers to vegetation taller than 5 m, which already builds in a height criterion.
- Primary forest is a further subset defined by degradation history, mapped separately.
Internal links
- Global Forest Change explained — the canopy product most definitions are applied to
- Forest threshold changes everything — the fix guide
- How to compare land cover products for forest — definitions baked into classes
- Land cover products explained — how classes encode definitions
- How to calculate forest loss by year for a region — applying a baseline
- How to measure forest fragmentation — where minimum area matters
FAQ
What is the FAO definition of forest?
Land over 0.5 ha with trees higher than 5 m and canopy cover above 10%, not predominantly under agricultural or urban use.
What tree cover threshold should I use?
The one in the definition your question is framed in — 10% for FAO comparability, often 25–30% in research and national reporting. State it.
Why do forest statistics differ between sources?
Different definitions: canopy threshold, minimum area and whether land use is considered.
Are plantations forest?
By canopy, yes; by many policy definitions, it depends. Remote sensing cannot tell them apart without extra data.
Does the threshold change deforestation rates?
It changes the baseline and the loss; in mixed landscapes it can change rates substantially.
How do I apply a minimum area?
Label connected forest pixels and drop patches below the area, such as 0.5 ha.