
How to Map a Hurricane Season's Tracks Coloured by Intensity
On this page
Problem statement
The classic picture of a hurricane season is a map of every storm's track, coloured by Saffir–Simpson category so you can see where each one strengthened and weakened. Building it from HURDAT2 means three decisions: how to turn a wind speed into a category, what colour to give the stages when the storm was not tropical, and how to colour a line that changes intensity along its length. This page draws the 2025 Atlantic season (13 named storms, three of them category 5) and marks its landfalls, including Melissa's in Jamaica.
Quick answer
Cut the wind into Saffir–Simpson classes, but only for fixes whose status is TD, TS or HU. Winds are stored in 5-kt steps, so in practice categories 1 to 5 begin at 65, 85, 100, 115 and 140 kt. Then turn each storm's consecutive fixes into two-point segments and colour each by the category at its start. Plot fixes with record == "L" as landfall markers.
from shapely.geometry import LineString

cat = pd.cut(hd.wind, [0, 33, 63, 82, 95, 112, 136, 200], labels=["TD", "TS", "1", "2", "3", "4", "5"])
hd["cat"] = np.where(hd.status.isin(["TD", "TS", "HU"]), cat.astype(str), "other")
s = hd[hd.season == 2025].sort_values(["sid", "time"])
nxt = s.groupby("sid")[["lon", "lat"]].shift(-1)
seg = gpd.GeoDataFrame(s.assign(nlon=nxt.lon, nlat=nxt.lat).dropna(subset=["nlon"]), crs=4326,
                       geometry=[LineString([(a, b), (c, d)]) for a, b, c, d in zip(s.lon, s.lat, nxt.lon, nxt.lat) if not np.isnan(c)])
print(f"2025: {s.sid.nunique()} storms, {len(seg):,} track segments; by category: {seg.cat.value_counts().to_dict()}")
2025: 13 storms, 362 track segments; by category: {'TS': 135, 'other': 112, '1': 32, '4': 24, '2': 22, 'TD': 14, '3': 13, '5': 10}
The 2025 season's 13 storms make 362 segments. 135 start at tropical-storm strength, 112 in a non-tropical stage (depression remnants, extratropical gales), and 10 at category 5.
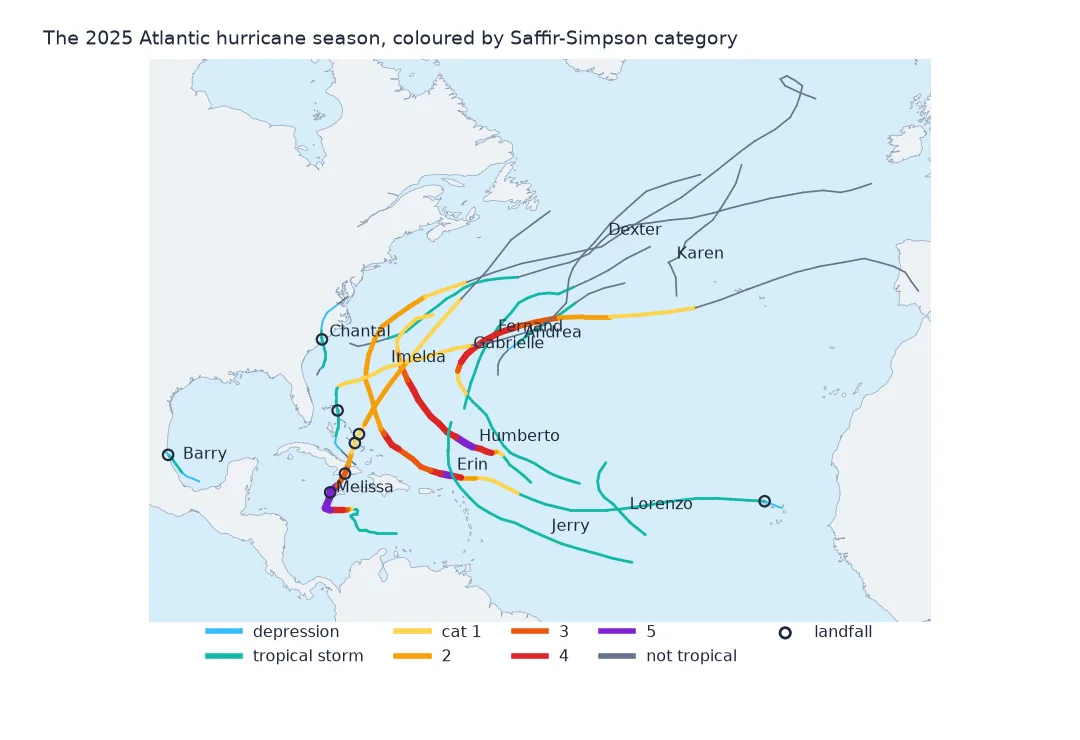
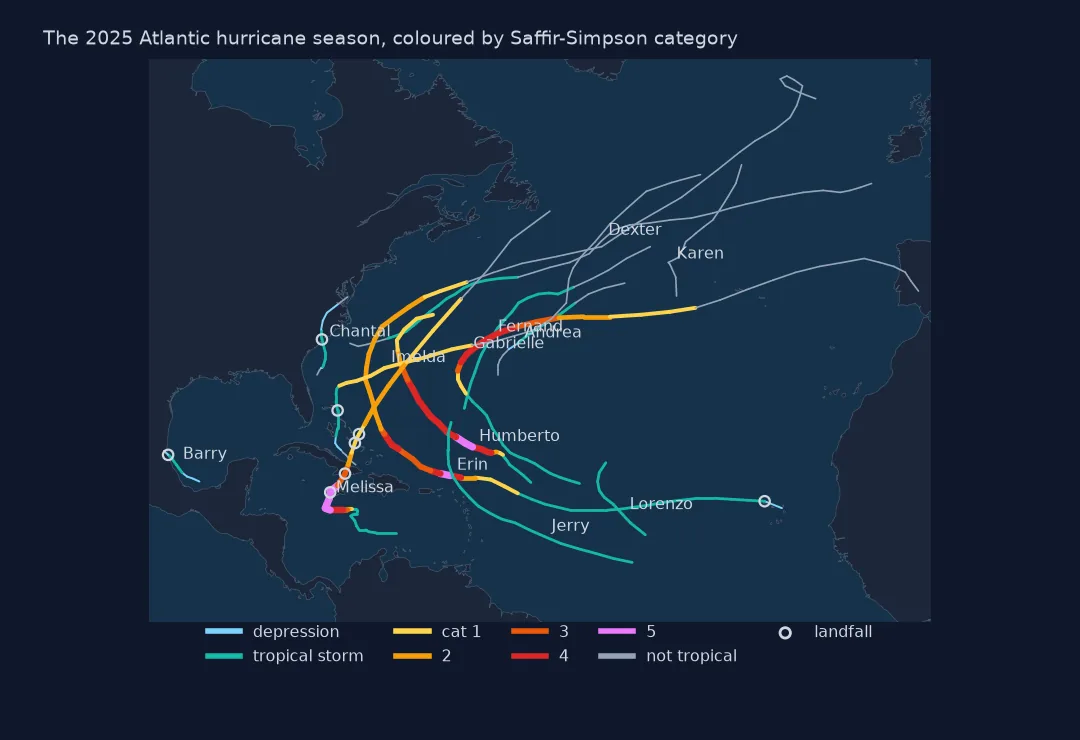
Category, colour and landfall for each segment
1. One season, all fixes
print(s.groupby("sid").agg(name=("name", "first"), fixes=("time", "size"), first=("time", "min"), last=("time", "max")).head(5).to_string()) name fixes first last
sid
AL012025 ANDREA 15 2025-06-22 00:00:00 2025-06-25 12:00:00
AL022025 BARRY 8 2025-06-28 18:00:00 2025-06-30 06:00:00
AL032025 CHANTAL 16 2025-07-04 06:00:00 2025-07-07 18:00:00
AL042025 DEXTER 43 2025-08-02 18:00:00 2025-08-13 06:00:00
AL052025 ERIN 68 2025-08-11 00:00:00 2025-08-27 18:00:00
Each storm is a block of fixes from first to last advisory. Andrea in June had 15. Erin ran for over two weeks in August, with 68 fixes, the longest track of the season.
2. Category from wind, only while tropical
peak = s.loc[s.groupby("sid").wind.idxmax(), ["sid", "name", "time", "wind", "pressure", "status", "cat"]]
print(peak.sort_values("wind", ascending=False).to_string(index=False))
print("lowest wind in each class, kt:", {str(c): int(hd.wind[(hd.cat == str(c))].min()) for c in ["TS", "1", "2", "3", "4", "5"]})
sid name time wind pressure status cat
AL132025 MELISSA 2025-10-28 12:00:00 165 892.0 HU 5
AL082025 HUMBERTO 2025-09-27 18:00:00 140 919.0 HU 5
AL052025 ERIN 2025-08-16 18:00:00 140 913.0 HU 5
AL072025 GABRIELLE 2025-09-23 00:00:00 120 944.0 HU 4
AL092025 IMELDA 2025-10-01 12:00:00 80 968.0 HU 1
AL042025 DEXTER 2025-08-08 06:00:00 70 989.0 EX other
AL102025 JERRY 2025-10-08 12:00:00 55 1002.0 TS TS
AL032025 CHANTAL 2025-07-06 06:00:00 50 1002.0 TS TS
AL062025 FERNAND 2025-08-25 12:00:00 50 999.0 TS TS
AL112025 KAREN 2025-10-08 12:00:00 50 1000.0 EX other
AL122025 LORENZO 2025-10-14 00:00:00 50 1000.0 TS TS
AL022025 BARRY 2025-06-29 18:00:00 40 1006.0 TS TS
AL012025 ANDREA 2025-06-23 12:00:00 35 1014.0 TS TS
lowest wind in each class, kt: {'TS': 35, '1': 65, '2': 85, '3': 100, '4': 115, '5': 140}
Melissa peaked at 165 kt and 892 hPa on 28 October, and Humberto and Erin both reached 140 kt, category 5. Dexter's and Karen's highest winds came after they had become extratropical, so their peak fixes are coloured "other", not category 1 or tropical storm. Using the status column keeps a North Atlantic gale from appearing as a hurricane on the map. The lowest stored wind in each class confirms the cut points: 65, 85, 100, 115 and 140 kt for categories 1 to 5.
3. Colour each segment by where it starts
hours = seg.groupby("cat").size() * 6
print("approximate hours at each stage (six-hourly segments):", hours.reindex(["TD", "TS", "1", "2", "3", "4", "5", "other"]).fillna(0).astype(int).to_dict())
print(f"segments that start at a non-synoptic fix: {(~seg.synoptic).sum()}")
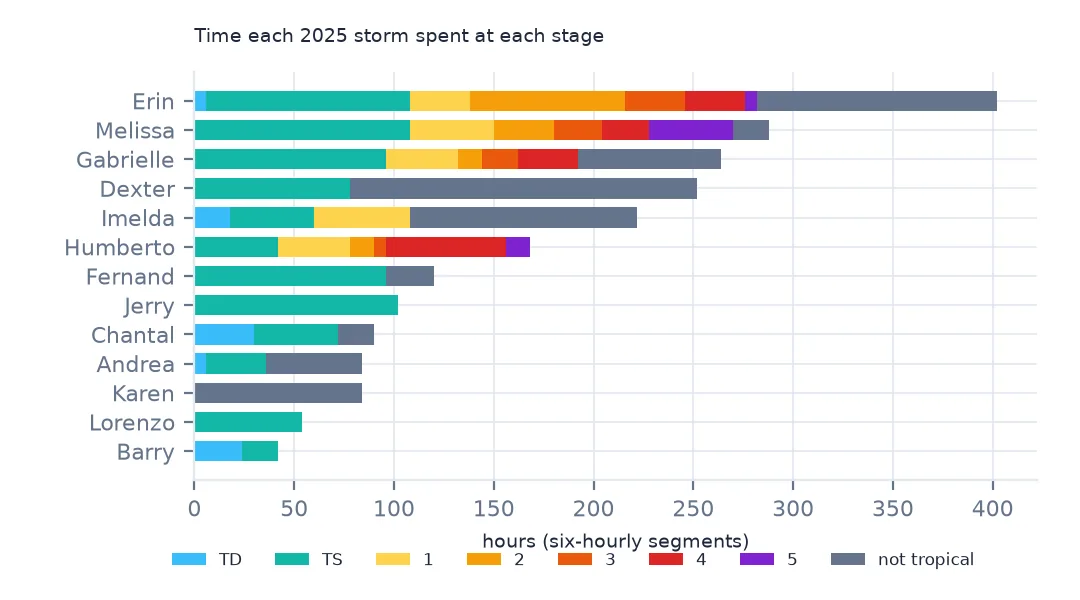
approximate hours at each stage (six-hourly segments): {'TD': 84, 'TS': 810, '1': 192, '2': 132, '3': 78, '4': 144, '5': 60, 'other': 672}
segments that start at a non-synoptic fix: 6
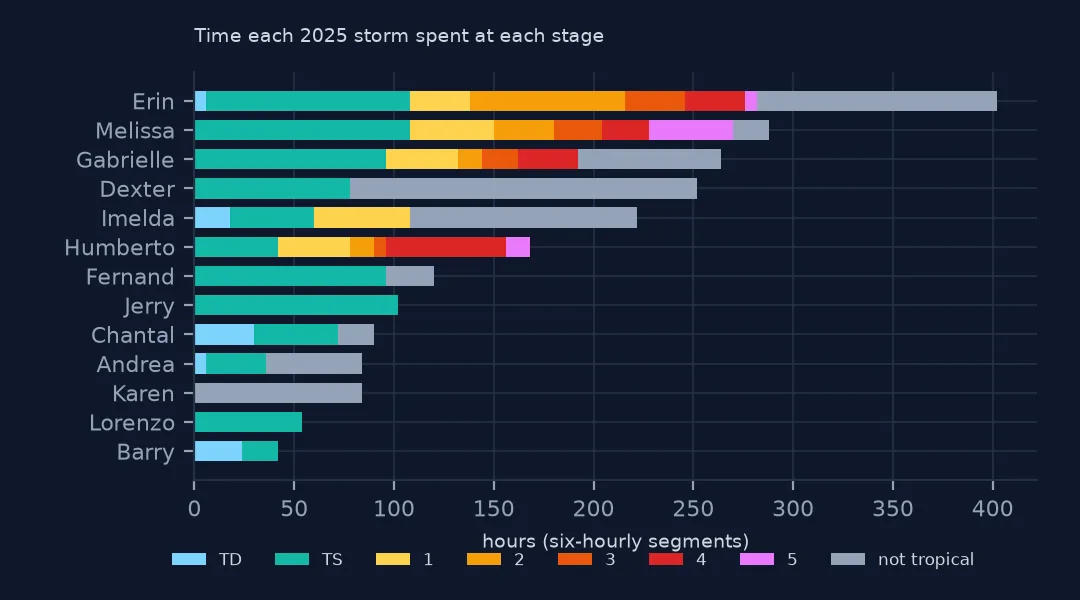
Counting six-hourly segments approximates time at each stage: about 810 hours at tropical-storm strength, 60 hours at category 5 and 672 hours in non-tropical stages. Only 6 segments start at an extra, non-synoptic fix, so the approximation holds. The landfall fixes shorten the segments around them but do not change the picture.
4. Mark landfalls
lf = s[s.record == "L"]
print(lf[["name", "time", "lat", "lon", "wind", "status"]].to_string(index=False))
name time lat lon wind status
BARRY 2025-06-30 02:00:00 21.9 -97.7 30 TD
CHANTAL 2025-07-06 08:00:00 33.6 -79.0 45 TS
ERIN 2025-08-11 06:00:00 17.2 -25.2 35 TS
IMELDA 2025-09-29 12:00:00 26.4 -77.1 45 TS
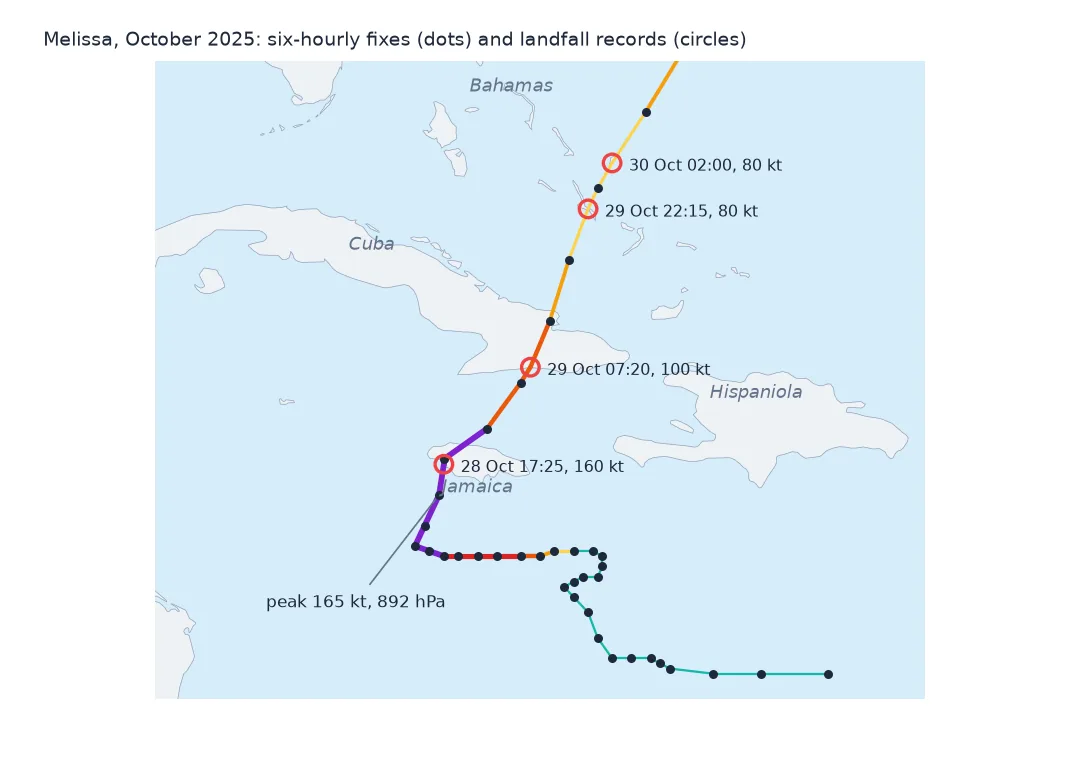
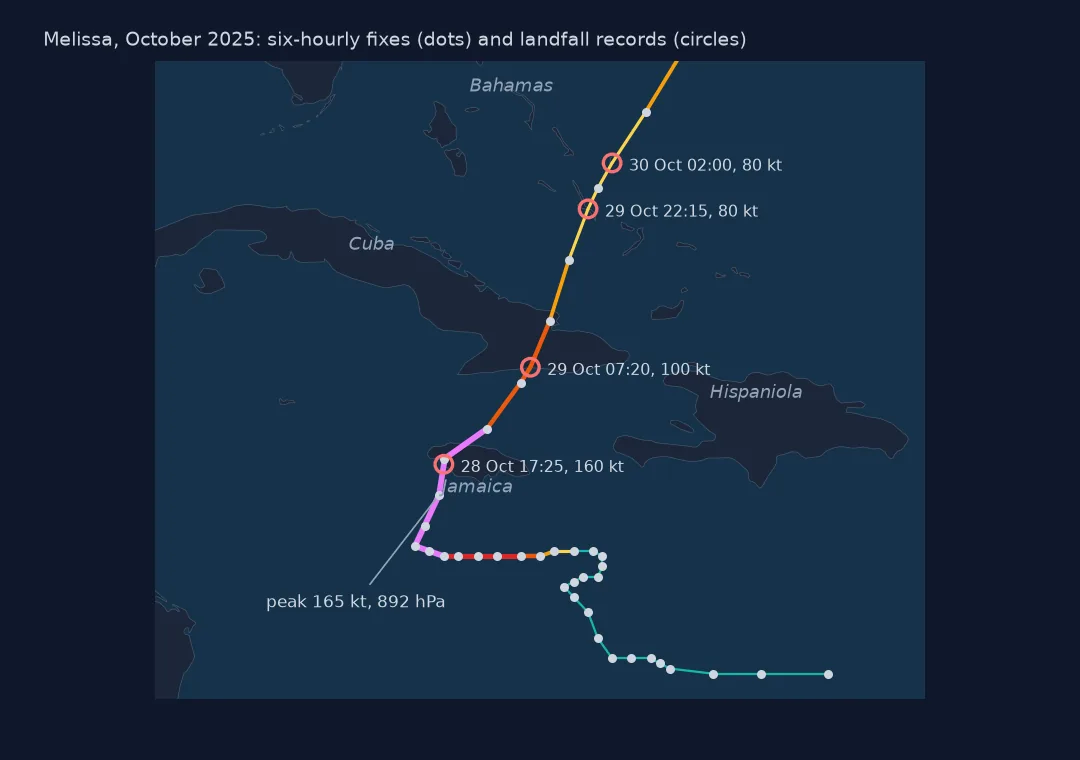
MELISSA 2025-10-28 17:25:00 18.1 -78.0 160 HU
MELISSA 2025-10-29 07:20:00 20.0 -76.2 100 HU
MELISSA 2025-10-29 22:15:00 23.1 -75.0 80 HU
MELISSA 2025-10-30 02:00:00 24.0 -74.5 80 HU
2025 had eight landfall records. Barry came ashore in Mexico as a depression, Chantal in South Carolina as a tropical storm, Erin crossed the Cabo Verde islands at its genesis, and Imelda brushed the Bahamas. Melissa made three landfalls: in Jamaica at 160 kt on 28 October, then in Cuba and the Bahamas, followed by a fourth Bahamas fix. No hurricane made landfall on the US mainland.
Melissa close up, and distances
The data used on this page
The National Hurricane Center's HURDAT2 Atlantic best-track file, 1851–2025.
from pathlib import Path

import geopandas as gpd
import numpy as np
import pandas as pd
import requests

Path("data").mkdir(exist_ok=True)
# NOAA National Hurricane Center HURDAT2 best tracks: Atlantic 1851-2025 (released 23 September 2026) and
# north-east and north-central Pacific 1949-2025 (29 September 2026). NHC keeps every release under its own name.
FILES = ["hurdat2-1851-2025-092326.txt", "hurdat2-nepac-1949-2025-092926.txt"]
for name in FILES:
    if not Path(f"data/{name}").exists():
        Path(f"data/{name}").write_bytes(requests.get(f"https://www.nhc.noaa.gov/data/hurdat/{name}", timeout=300).content)

COLS = ["date", "time", "record", "status", "lat", "lon", "wind", "pressure"] + \
       [f"r{kt}_{q}" for kt in (34, 50, 64) for q in ("ne", "se", "sw", "nw")] + ["rmw"]


def read_hurdat2(path):
    """One header line per storm (id, name, number of fixes), then one line per fix; -999 means missing."""
    rows = []
    for line in open(path):
        f = [x.strip() for x in line.split(",")]
        if f[0][:2].isalpha():
            sid, name = f[0], f[1]
            continue
        rows.append([sid, name] + f[:21])
    h = pd.DataFrame(rows, columns=["sid", "name"] + COLS)
    h["time"] = pd.to_datetime(h.date + h.time, format="%Y%m%d%H%M")
    h["lat"] = h.lat.str[:-1].astype(float) * np.where(h.lat.str[-1] == "S", -1, 1)
    h["lon"] = h.lon.str[:-1].astype(float) * np.where(h.lon.str[-1] == "W", -1, 1)
    for c in COLS[6:]:
        h[c] = pd.to_numeric(h[c]).replace(-999, np.nan)
    h["season"] = h.sid.str[-4:].astype(int)
    h["synoptic"] = h.time.dt.strftime("%H%M").isin(["0000", "0600", "1200", "1800"])
    return h.drop(columns="date")


hd = read_hurdat2("data/hurdat2-1851-2025-092326.txt")
print(f"HURDAT2 Atlantic: {hd.sid.nunique():,} storms, {len(hd):,} fixes, {hd.season.min()}-{hd.season.max()}")
HURDAT2 Atlantic: 1,988 storms, 55,524 fixes, 1851-2025
Example 1: Melissa, fix by fix near its peak
m = s[s.name == "MELISSA"].set_index("time")
print(m.loc["2025-10-26 12:00":"2025-10-29 00:00", ["record", "status", "lat", "lon", "wind", "pressure"]].to_string())
record status lat lon wind pressure
time
2025-10-26 12:00:00 HU 16.3 -76.4 115 952.0
2025-10-26 18:00:00 HU 16.3 -76.9 120 944.0
2025-10-27 00:00:00 HU 16.3 -77.3 125 934.0
2025-10-27 06:00:00 HU 16.3 -77.7 135 923.0
2025-10-27 12:00:00 HU 16.3 -78.0 145 912.0
2025-10-27 18:00:00 HU 16.4 -78.3 155 906.0
2025-10-28 00:00:00 HU 16.5 -78.6 155 909.0
2025-10-28 06:00:00 HU 16.9 -78.4 155 900.0
2025-10-28 12:00:00 HU 17.5 -78.1 165 892.0
2025-10-28 17:25:00 L HU 18.1 -78.0 160 897.0
2025-10-28 18:00:00 HU 18.2 -78.0 145 910.0
2025-10-29 00:00:00 HU 18.8 -77.1 105 953.0
Melissa's last two days at sea show why the best track adds extra fixes. It strengthened from 115 kt to 165 kt in 48 hours while crawling west at about 16°N. The landfall fix at 17:25 UTC, 160 kt and 897 hPa, falls between the 12:00 and 18:00 synoptic fixes. By the next synoptic hour the storm had already weakened over Jamaica's mountains to 145 kt.
Example 2: how far each storm travelled
from pyproj import Geod

geod = Geod(ellps="WGS84")
km = s.groupby("sid").apply(lambda g: geod.line_length(g.lon.values, g.lat.values) / 1000)
print(pd.DataFrame({"name": s.groupby("sid").name.first(), "km": km.round(0)}).sort_values("km", ascending=False).head(5).to_string())
name km
sid
AL052025 ERIN 12255.0
AL072025 GABRIELLE 7489.0
AL092025 IMELDA 5848.0
AL042025 DEXTER 5639.0
AL132025 MELISSA 5451.0
Erin travelled 12,255 km from the Cabo Verde islands to the far North Atlantic, more than twice Melissa's 5,451 km. Measure track lengths on the ellipsoid with pyproj.Geod; a planar length in degrees would understate east–west travel at high latitudes.
How the colours are defined
The Saffir–Simpson scale uses one-minute sustained wind: category 1 from 64 kt, 2 from 83 and 3 from 96, with 4 and 5 above. HURDAT2 rounds winds to 5 kt, so the thresholds fall between stored values: a 95-kt fix is category 2 and a 100-kt fix category 3. Below hurricane strength the National Hurricane Center uses status rather than wind: a storm with 40 kt winds is a tropical storm only if its status is TS or SS. An extratropical low with the same wind is not on the scale at all.
Colouring segments by their starting fix is a convention, not physics. Intensity changes continuously between fixes. For a smoother map, interpolate the wind along each segment and draw it with a colour gradient. For a season overview, the segment colours read clearly.
Making the map read
- Draw weak stages thin and grey, and draw hurricanes thicker. Otherwise long-lived tropical storms dominate the map.
- Projection. Atlantic tracks reach from 10°N to 60°N. A conic or Lambert azimuthal projection keeps them in proportion, and plain longitude–latitude stretches the northern ends.
- Season maps need the 31 single-fix storms only if you want a complete count. They cannot be drawn as lines.
- Labels at peak intensity work better than at genesis, where storms crowd together off Africa.
Internal links
- How to read HURDAT2 — the file format
- Accumulated cyclone energy explained — scoring the same season
- How to animate a hurricane track — one storm in motion
- How to map a hurricane track from IBTrACS — one storm from the multi-agency archive
FAQ
How do I colour a hurricane track by category in Python?
Classify each fix with pd.cut at the Saffir–Simpson thresholds, but only for tropical statuses. Then build two-point segments between consecutive fixes and colour each by its start.
How strong was Hurricane Melissa?
165 kt with a central pressure of 892 hPa at 12:00 UTC on 28 October 2025, according to the HURDAT2 best track. It made landfall in Jamaica at 160 kt.