
How to fetch and align tide gauge data in Python
Problem statement
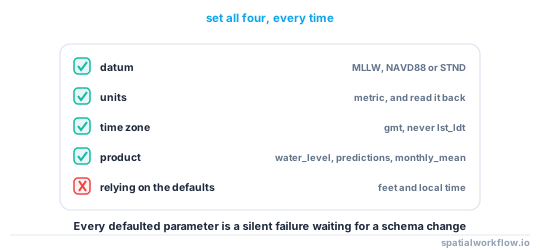
Tide gauge data is a time series with three things attached that decide whether it can be joined to anything: a datum, a time zone and an interval. Get any of them wrong and the join succeeds, the numbers are plausible, and the result is wrong by half a tidal cycle or by half a tidal range.
The API makes it easy to get this wrong quietly. The same NOAA service returns water levels in metres when asked and feet when not, returns times in local or GMT depending on a parameter, and publishes datums through a different endpoint whose default units are feet regardless of what you asked the first one for.
This guide fetches a real month of observations, aligns them to other data, and covers the checks that catch the three failures.
Quick answer
Ask for everything explicitly, and read the metadata back:
import urllib.request, json, pandas as pd

def water_levels(station, begin, end, datum="MLLW"):
    url = ("https://api.tidesandcurrents.noaa.gov/api/prod/datagetter"
           f"?product=water_level&application=spatialworkflow-docs"
           f"&begin_date={begin}&end_date={end}&datum={datum}&station={station}"
           "&time_zone=gmt&units=metric&format=json")
    with urllib.request.urlopen(url, timeout=120) as r:
        raw = json.loads(r.read())
    df = pd.DataFrame(raw["data"])
    df["t"] = pd.to_datetime(df["t"], utc=True)          # gmt, so utc=True is correct
    df["v"] = pd.to_numeric(df["v"], errors="coerce")
    return df.dropna(subset=["v"]).set_index("t"), raw["metadata"]

wl, meta = water_levels("8443970", "20260101", "20260131")
print(meta["name"], meta["lat"], meta["lon"], len(wl))
Boston 42.3539 -71.0503 7440
7,440 six-minute observations in a 31-day month is a complete record: 31 × 24 × 10 = 7,440. Counting them is the fastest gap check there is.
Step-by-step solution
1. Choose the product
water_level is the six-minute observed series. hourly_height is hourly, high_low is the predicted or observed extremes, predictions is the harmonic prediction, and monthly_mean is what a trend is computed from. They have different intervals and different gaps.
2. Name the datum in the request
datum=MLLW returns metres above mean lower low water; datum=NAVD88 returns metres above the national datum; datum=STND returns metres above the arbitrary station datum. The numbers differ by metres and all of them look like a tide.
3. Name the units and the time zone
units=metric and time_zone=gmt are the two parameters worth setting on every request. GMT in particular removes the whole class of daylight-saving errors.
4. Parse the timestamps as UTC
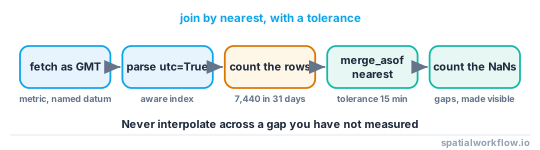
pd.to_datetime(df["t"], utc=True) on a GMT series gives a timezone-aware index that can be joined to anything else that is also aware. A naive index joined to an aware one raises; a naive index joined to another naive one in a different zone does not.
5. Check the record is complete
Expected count is the interval divided into the span. Gaps are common — sensor outages, ice, maintenance — and a resample that silently fills them changes every statistic.
6. Resample to the interval of whatever you are joining to
Imagery acquisition times, AIS positions and survey timestamps are all at irregular instants. reindex with method="nearest" and a tolerance is usually right; interpolating across a gap is usually not.
7. Sanity-check against the published datums
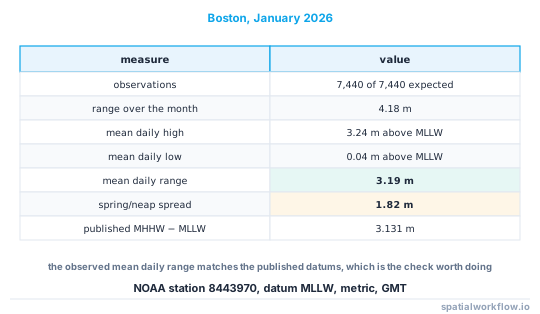
The observed mean daily range should match the published great diurnal range. At Boston the measured mean daily range over January 2026 was 3.19 m against a published MHHW − MLLW of 3.131 m — agreement at the level month-to-month variation allows.
Code examples
Example 1 — fetch, check and describe
import pandas as pd, numpy as np

wl, meta = water_levels("8443970", "20260101", "20260131", datum="MLLW")

expected = int(pd.Timedelta("31D") / pd.Timedelta("6min"))
print(f"{len(wl):,} of {expected:,} expected six-minute observations "
      f"({len(wl)/expected:.1%})")
print(f"above MLLW: min {wl.v.min():.2f} m, max {wl.v.max():.2f} m, "
      f"monthly range {wl.v.max() - wl.v.min():.2f} m")

daily = wl["v"].resample("1D")
rng = daily.max() - daily.min()
print(f"mean daily high {daily.max().mean():.2f} m, low {daily.min().mean():.2f} m")
print(f"mean daily range {rng.mean():.2f} m, "
      f"spring/neap spread {rng.max() - rng.min():.2f} m")
7,440 of 7,440 expected six-minute observations (100.0%)
above MLLW: min -0.38 m, max 3.80 m, monthly range 4.18 m
mean daily high 3.24 m, low 0.04 m
mean daily range 3.19 m, spring/neap spread 1.82 m
The 1.82 m spring–neap spread is why a single "tidal range" figure for a site is misleading: the range on a spring tide is nearly twice the neap one.
Example 2 — align a gauge series to arbitrary event times
import pandas as pd, numpy as np

def tide_at(events, gauge, tolerance="15min"):
    """events: DataFrame with a timezone-aware datetime column 'time'."""
    e = events.sort_values("time").copy()
    joined = pd.merge_asof(
        e, gauge[["v"]].reset_index().rename(columns={"t": "time", "v": "level_m"}),
        on="time", direction="nearest", tolerance=pd.Timedelta(tolerance))
    unmatched = joined["level_m"].isna().sum()
    if unmatched:
        print(f"{unmatched} of {len(joined)} events had no gauge reading "
              f"within {tolerance}")
    return joined

acquisitions = pd.DataFrame({"scene": ["A", "B", "C"],
                             "time": pd.to_datetime(
                                 ["2026-01-04 10:47", "2026-01-14 10:47", "2026-01-24 10:47"],
                                 utc=True)})
print(tide_at(acquisitions, wl))
merge_asof with a tolerance is the right tool: it matches to the nearest observation and leaves a NaN rather than reaching across a gap.
Example 3 — compare the observations with the harmonic prediction
import pandas as pd, urllib.request, json

def predictions(station, begin, end, interval="6"):
    url = ("https://api.tidesandcurrents.noaa.gov/api/prod/datagetter"
           f"?product=predictions&application=spatialworkflow-docs"
           f"&begin_date={begin}&end_date={end}&datum=MLLW&station={station}"
           f"&time_zone=gmt&units=metric&interval={interval}&format=json")
    with urllib.request.urlopen(url, timeout=120) as r:
        raw = json.loads(r.read())
    df = pd.DataFrame(raw["predictions"])
    df["t"] = pd.to_datetime(df["t"], utc=True)
    df["v"] = pd.to_numeric(df["v"], errors="coerce")
    return df.set_index("t")

pred = predictions("8443970", "20260101", "20260131")
both = wl[["v"]].join(pred[["v"]], lsuffix="_obs", rsuffix="_pred", how="inner")
both["residual"] = both["v_obs"] - both["v_pred"]
print(f"{len(both):,} matched samples; residual mean {both.residual.mean():+.3f} m, "
      f"sd {both.residual.std():.3f} m, max {both.residual.abs().max():.2f} m")
The residual is the non-tidal part: surge, wind setup and river discharge. It is the quantity a coastal flood study actually needs, and it is invisible if you only ever look at the observed series.
Explanation
Why GMT and explicit units are worth insisting on
Every defaulted parameter is a chance for the response to change under you. The datums endpoint at the same service returns feet unless asked otherwise — MHHW at Boston is 13.800 ft or 4.205 m — and a pipeline that worked because the default happened to suit it will break when the default changes or when it is pointed at a different service.
Why counting observations beats plotting them
A plot of a month of tide data looks fine with a two-day gap in it, because the envelope is dominated by the tidal signal. Comparing the row count with the expected count takes one line and finds gaps a plot hides, which matters because a resample across a gap produces values that were never observed.
Why nearest-time joining rather than interpolation
Interpolating a tidal series across a gap of a few minutes is harmless; across an hour it is not, because the series can move a metre in that time. merge_asof with a tolerance makes the choice explicit and leaves a NaN when the gap is too large, which is a result you can count.
Why the residual is the interesting series
The harmonic prediction captures the astronomical tide, which is deterministic. Everything left over is meteorology and hydrology — the part that varies between years, the part that causes flooding and the part a climate signal lives in. Working with the observed level alone mixes a predictable metre with an unpredictable decimetre.
Edge cases or notes
- Six-minute data is verified late. Recent values may be preliminary.
high_lowhas irregular spacing by construction; do not resample it.- Datum availability varies by station. Not every gauge publishes NAVD88.
- Some stations are relocated. The record may have a datum discontinuity.
- Ice and storms cause gaps exactly when the data matters most.
- Other networks differ. BODC, IOC and national services use their own parameters.
- Predictions extend into the future. Observations do not.
- Time zone
lst_ldtfollows daylight saving. Prefergmtalways.
Internal links
- Tidal datums explained: which shoreline is the shoreline — what the datum parameter selects
- Tide times are off by hours after a join — the failure this guide prevents
- How to measure shoreline change between two dates — the main consumer of tide state
- Sea level rise data explained — trends from the same records
- Spatial data has timezone errors in the time column — the general version of the time problem
- How to standardise dates in spatial data with Python — parsing consistently
- How to resample a time series in xarray — the gridded equivalent
- How to handle rate limiting on a spatial API — fetching many stations politely
FAQ
How do I download tide gauge data in Python?
Call the NOAA datagetter endpoint with product=water_level, an explicit datum, units=metric and time_zone=gmt, then parse the timestamps with utc=True.
Which datum should I request?
The one that matches what you are joining to: MLLW for charted depths, NAVD88 for a terrain model, STND only if you are converting yourself.
Why do my water levels look ten times too large?
You probably received feet. The datums metadata endpoint in particular defaults to feet even when the observation endpoint was asked for metric.
How do I check the record is complete?
Compare the row count with the expected count — 31 days of six-minute data is 7,440 observations.
How do I attach a tide level to an image acquisition time?
merge_asof with direction="nearest" and a tolerance, so a gap produces a NaN rather than a value from an hour away.
What is the residual between observation and prediction?
The non-tidal part: surge, wind setup and river discharge. It is what a flood study needs and what the observed series alone hides.