
Repowered Wind Turbines Carry the Original Project Year
On this page
Problem statement
Thousands of US wind turbines have been partly rebuilt: the tower stays, but the nacelle or the rotor is replaced with a larger one. The US Wind Turbine Database records the rebuilt turbine with its new rotor diameter, capacity and height, and puts the rebuild year in a separate column, t_retro_yr. For most of them it keeps the year the project first came online in p_year, but not for all: some old projects carry their rebuild year instead. Any chart or total by p_year therefore credits 2017-era blades to 2008, makes old projects look bigger than they were built, and in places makes a 2007 wind farm look like a 2017 one. This page finds the repowered turbines in version 9.1 and shows what they do to a chart by year.
Quick answer
Flag the turbines with t_retrofit == 1. Leave them out of anything about the year a turbine was built, or chart them by t_retro_yr:
r = wt[wt.t_retrofit == 1]
print(f"repowered: {len(r):,} turbines in {r.p_name.nunique()} project names, {r.t_cap.sum() / 1e6:.1f} GW; project years {r.p_year.min():.0f}-{r.p_year.max():.0f}")
print(r.t_retro_yr.value_counts().sort_index().to_string())
repowered: 8,709 turbines in 137 project names, 15.6 GW; project years 2001-2025
t_retro_yr
2015.0 9
2017.0 1317
2018.0 1124
2019.0 1893
2020.0 1744
2021.0 736
2022.0 833
2023.0 460
2024.0 364
2025.0 229
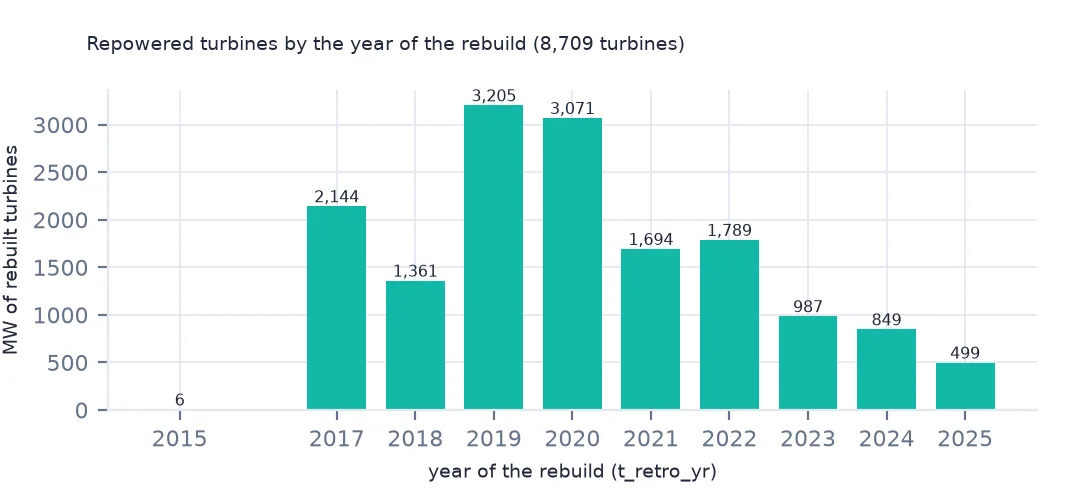
8,709 turbines, 11% of the file, are flagged as repowered: 15.6 GW in 137 project names, with project years from 2001 to 2025. The rebuilds themselves are dated 2015 to 2025, and 6,078 of them fall in 2017 to 2020.
New rotors, old year
1. The same project year, two turbines
y08 = wt[wt.p_year == 2008]
print(y08.groupby("t_retrofit")[["t_cap", "t_rd", "t_hh", "t_ttlh"]].median().to_string())
t_cap t_rd t_hh t_ttlh
t_retrofit
0 1500.0 77.0 80.0 118.6
1 1620.0 91.5 80.0 125.6
Among turbines from 2008 projects, the repowered ones have a 91.5 m rotor where the originals have 77 m, on the same 80 m towers. The tower is reused, which is why the hub height doesn't change and why repowering costs far less than building anew.
2. How long after the project
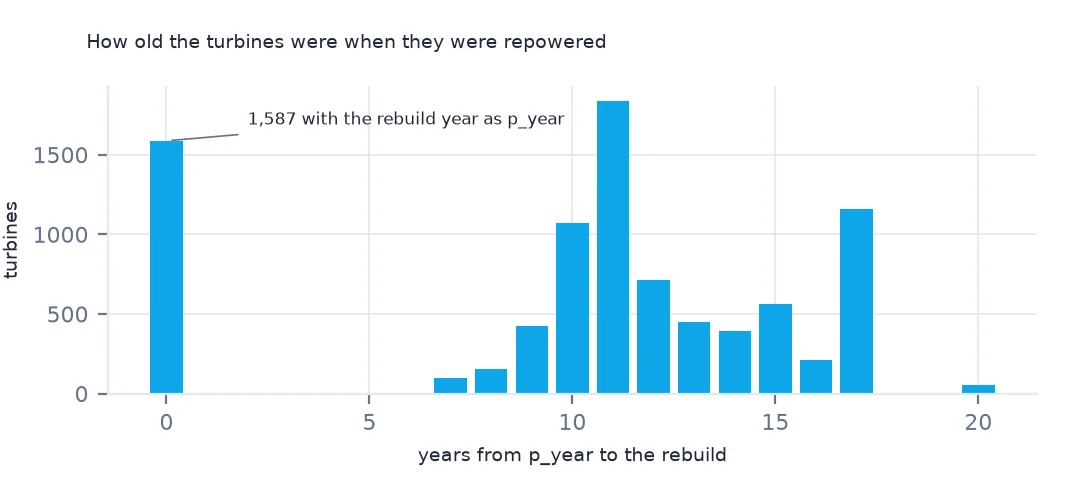
gap = r.t_retro_yr - r.p_year
print(gap.describe().round(1).loc[["min", "25%", "50%", "75%", "max"]].to_string())
same = r[gap == 0]
print(f"rebuilt in their own project year: {len(same):,}, e.g. {same.p_name.value_counts().head(3).to_dict()}")
min 0.0
25% 9.0
50% 11.0
75% 14.0
max 20.0
rebuilt in their own project year: 1,587, e.g. {'Capricorn Ridge': 210, 'Capricorn Ridge expansion': 197, 'Horse Hollow III': 149}
The median turbine was rebuilt 11 years after its project came online, and half of them between 9 and 14 years after. That is well within a turbine's design life: these are not worn-out machines being replaced, but working ones whose owners judged a new rotor worth the cost. The exception is the turbines "rebuilt" in their own project year. Capricorn Ridge and Horse Hollow in Texas came online in 2007 and 2005-2006, yet their repowered turbines carry 2017 as p_year. For these records USGS replaced the project year with the rebuild year, so p_year means different things on different rows. Where the original year matters, take it from EIA-860's operating year through eia_id.
3. Whole projects or parts
share = wt[wt.p_name.isin(r.p_name)].groupby("p_name").t_retrofit.mean()
print(f"projects fully repowered: {(share == 1).sum()}; partly: {((share > 0) & (share < 1)).sum()}")
print(r.groupby("p_name").size().nlargest(3).to_string())
projects fully repowered: 110; partly: 27
p_name
Rolling Hills 259
King Mtn. Wind Ranch 213
Capricorn Ridge 210
110 projects were repowered completely and 27 in part, so one project name can hold turbines of both kinds, each with the right size for its own rotor but all under one p_year. The largest are Rolling Hills in Iowa, King Mountain and Capricorn Ridge in Texas, each with more than 200 rebuilt turbines.
Charting by the right year
The data used on this page
The US Geological Survey's US Wind Turbine Database, version 9.1 of 28 September 2026 (Hoen and others, doi:10.5066/F7TX3DN0), public domain, saved on this site on 19 October 2026 because USGS replaces the file every quarter.
from pathlib import Path
import zipfile

import pandas as pd
import requests

Path("data").mkdir(exist_ok=True)
# USGS US Wind Turbine Database v9.1 (28 September 2026) with its metadata and changelog, Census 2024 cartographic
# boundary counties and the EIA-860 2025 wind table. Saved 19 October 2026: USGS replaces the file every quarter.
# Live: https://energy.usgs.gov/uswtdb/assets/data/uswtdbCSV.zip
ARCHIVE = "usgs-uswtdb-v9-1-2026-10-19.zip"
if not Path(f"data/{ARCHIVE}").exists():
    Path(f"data/{ARCHIVE}").write_bytes(requests.get(f"https://data.spatialworkflow.io/{ARCHIVE}", timeout=600).content)
Z = zipfile.ZipFile(f"data/{ARCHIVE}")
wt = pd.read_csv(Z.open("uswtdb_V9_1_20260928.csv"), dtype={"t_fips": str})
print(f"US Wind Turbine Database v9.1: {len(wt):,} turbines, {int(wt.t_retrofit.sum()):,} flagged as retrofitted")
US Wind Turbine Database v9.1: 77,839 turbines, 8,709 flagged as retrofitted
Example 1: median rotor by project year
onshore = wt[wt.t_offshore == 0]
print(pd.DataFrame({"all turbines": onshore.groupby("p_year").t_rd.median(),
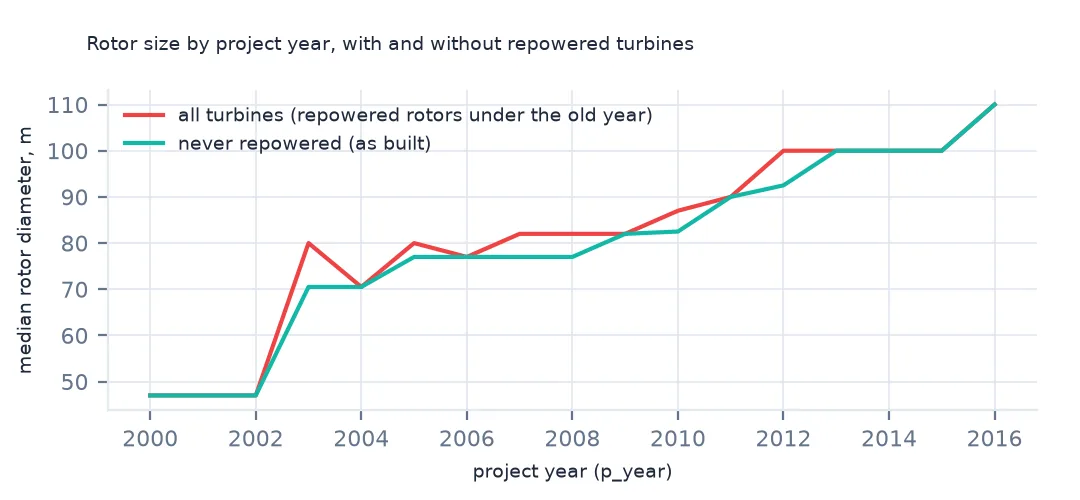
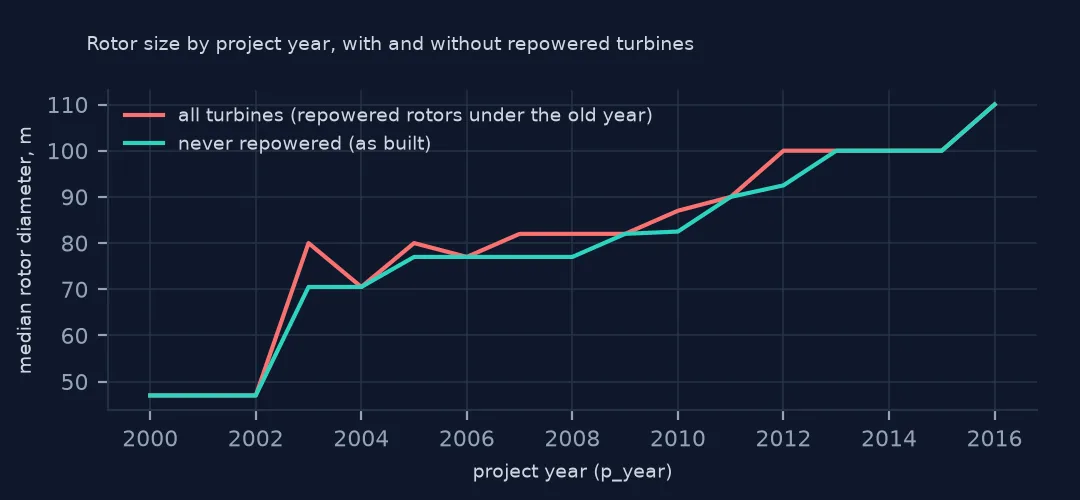
                    "never repowered": onshore[onshore.t_retrofit == 0].groupby("p_year").t_rd.median()}).loc[[2003, 2008, 2010, 2012]].to_string())
all turbines never repowered
p_year
2003.0 80.0 70.5
2008.0 82.0 77.0
2010.0 87.0 82.5
2012.0 100.0 92.5
With repowered turbines included, every project year from the 2000s looks bigger than it was built: the median rotor of 2003 projects is 80 m with them and 70.5 m without, and of 2012 projects 100 m against 92.5 m. The gap is what a chart of technology by year would wrongly credit to those years.
Example 2: rebuilt capacity by the year of the rebuild
print((r.groupby("t_retro_yr").t_cap.sum() / 1e3).round(0).to_string())t_retro_yr
2015.0 6.0
2017.0 2144.0
2018.0 1361.0
2019.0 3205.0
2020.0 3071.0
2021.0 1694.0
2022.0 1789.0
2023.0 987.0
2024.0 849.0
2025.0 499.0
Most of the rebuilding happened between 2017 and 2020, the years when partly repowered projects could requalify for ten more years of the federal production tax credit. By the year of the work, these are gigawatts of new rotors. By p_year, they vanish into projects from the 2000s.
Internal links
- Turbine sizes by year — the chart with repowered turbines left out
- Where each record comes from — how retrofits used to be new records
- Manufacturer market share — the GE models most rebuilds used
- Reading the database — the turbine and project columns