
How to Read the US Wind Turbine Database in Python
On this page
Problem statement
The US Geological Survey keeps a list of every utility-scale wind turbine in the United States, each placed on aerial imagery to within about ten metres: the US Wind Turbine Database. One CSV row is one turbine, with its project, its maker and model, its capacity, hub height and rotor size, and its coordinates. It is the file behind most maps of American wind power. Read naively, it loses the leading zeros of its county codes, mixes kilowatts with megawatts, and leaves a few thousand turbines without specifications. This page reads version 9.1, published on 28 September 2026, and shows what is in it.
Quick answer
Read the CSV with the county code as text, and sum the turbine capacity column, which is in kilowatts:
wt = pd.read_csv(Z.open("uswtdb_V9_1_20260928.csv"), dtype={"t_fips": str})
print(f"{len(wt):,} turbines, {wt.p_name.nunique():,} project names, {wt.t_cap.sum() / 1e6:.1f} GW of rated capacity")
print(wt.iloc[0][["p_name", "t_state", "p_year", "t_manu", "t_model", "t_cap", "t_hh", "t_rd", "xlong", "ylat"]].to_string())
77,839 turbines, 1,805 project names, 159.6 GW of rated capacity
p_name 25 Mile Creek
t_state OK
p_year 2022.0
t_manu Vestas
t_model V150-4.2
t_cap 4200.0
t_hh 105.0
t_rd 150.0
xlong -99.756958
ylat 36.491249
Version 9.1 lists 77,839 turbines under 1,805 project names, with 159.6 GW of rated capacity between them. The first row is a 4.2 MW Vestas V150 at the 25 Mile Creek project in Ellis County, Oklahoma, online in 2022, on a 105 m hub with a 150 m rotor. The coordinates are in NAD83, so the points are created with EPSG:4269.
One row per turbine
1. Three kinds of column
kinds = wt.columns.str.split("_").str[0]
print(kinds.value_counts().to_string())
print([c for c in wt.columns if c.startswith("p_")])
t 17
p 4
faa 2
case 1
usgs 1
eia 1
xlong 1
ylat 1
['p_name', 'p_year', 'p_tnum', 'p_cap']
The prefix says what a column describes. Seventeen t_ columns describe the turbine: its state, county, model, capacity, sizes, retrofit flag, confidence codes and the imagery it was checked on. Four p_ columns describe the project the turbine belongs to and are repeated on each of its turbines. The rest are identifiers that link to other datasets: case_id is USGS's own stable key, faa_ors and faa_asn lead to the FAA's obstacle records, eia_id to the plant in EIA-860, and usgs_pr_id to the older USGS turbine dataset.
2. Units
print(wt[["t_cap", "p_cap", "t_hh", "t_rd", "t_ttlh"]].describe().loc[["min", "50%", "max"]].round(1).to_string()) t_cap p_cap t_hh t_rd t_ttlh
min 50.0 0.0 19.0 13.4 30.5
50% 2000.0 176.9 80.0 101.0 134.1
max 14000.0 1055.6 140.0 222.0 247.5
t_cap is in kilowatts: the median turbine is rated at 2,000 kW, the largest at 14,000 kW. p_cap is in megawatts, for the whole project. The heights and the rotor diameter are in metres, and t_ttlh is the height to the tip of a blade pointing straight up. The two capacity columns differ by a factor of a thousand in unit and describe different things, so they are never added together.
3. What is missing
miss = wt.isna().sum()
print(miss[miss > 0].sort_values().to_string())
t_county 124
t_fips 124
t_state 124
p_year 842
faa_ors 3349
faa_asn 3556
p_cap 3857
t_manu 4866
t_model 4909
eia_id 5051
t_cap 5056
t_rd 5140
t_rsa 5140
t_hh 5450
t_ttlh 5500
t_img_date 6467
usgs_pr_id 41912
t_retro_yr 69130
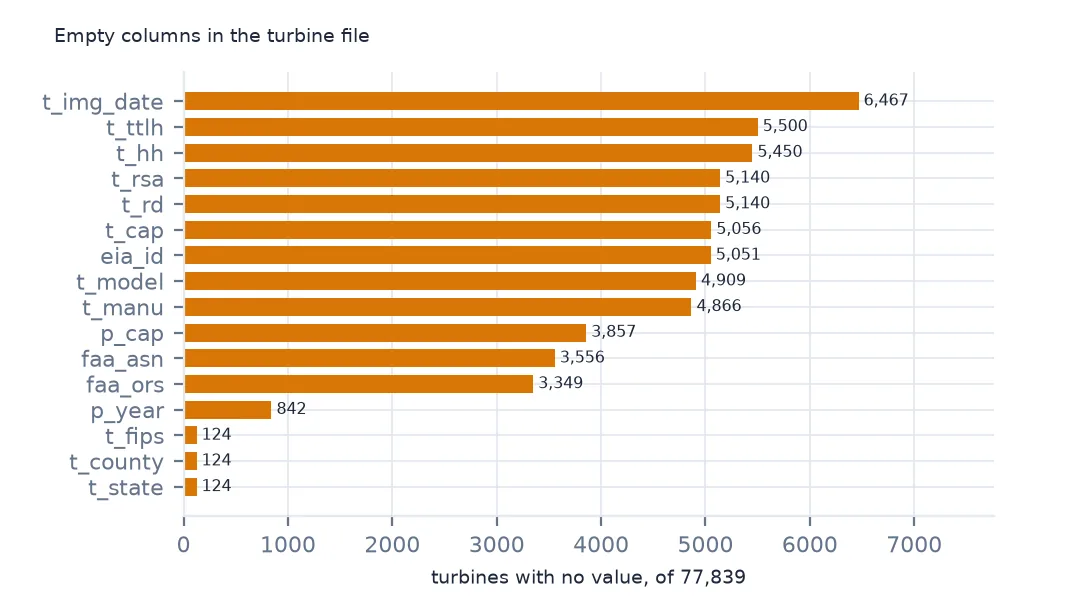
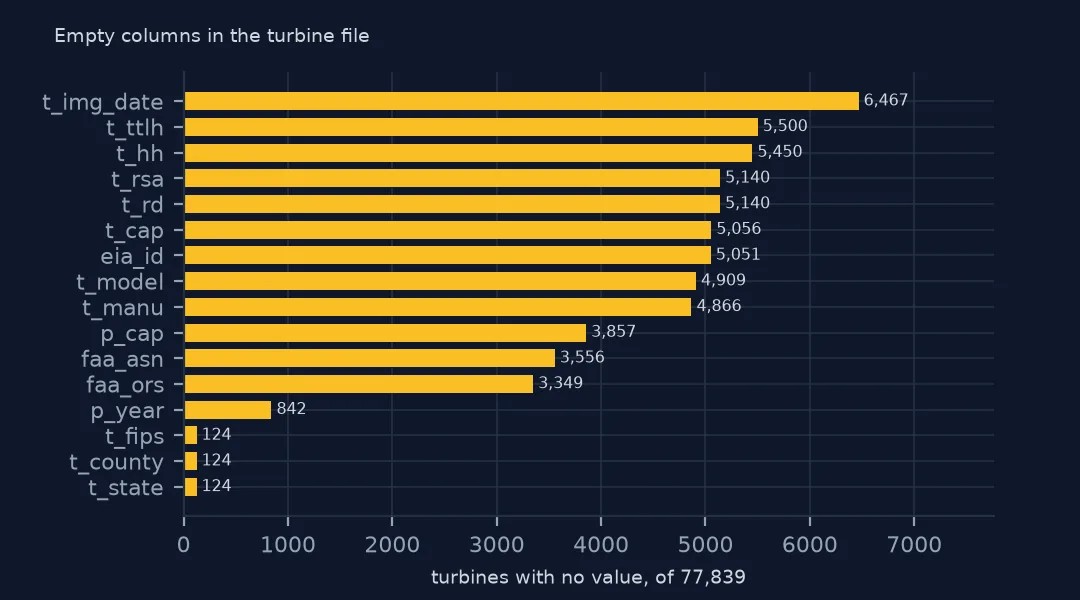
The 124 rows without a state or county are offshore turbines in federal waters. About 5,000 turbines, 6.5% of the file, have no model, capacity or size. They are mostly the newest projects, which USGS has placed on imagery before their specifications are known. t_retro_yr is empty unless the turbine was rebuilt, and usgs_pr_id only exists for turbines that were in the older USGS dataset.
States and a map
The data used on this page
The US Geological Survey's US Wind Turbine Database, version 9.1 of 28 September 2026 (Hoen and others, doi:10.5066/F7TX3DN0), public domain. USGS replaces the file every quarter, so the version used here was saved on this site on 19 October 2026 with its metadata and changelog. With it come the Census Bureau's 2024 county boundaries and the wind table of EIA-860 for 2025.
from pathlib import Path
import zipfile

import geopandas as gpd
import pandas as pd
import requests

Path("data").mkdir(exist_ok=True)
# USGS US Wind Turbine Database v9.1 (28 September 2026) with its metadata and changelog, Census 2024 cartographic
# boundary counties and the EIA-860 2025 wind table. Saved 19 October 2026: USGS replaces the file every quarter.
# Live: https://energy.usgs.gov/uswtdb/assets/data/uswtdbCSV.zip
ARCHIVE = "usgs-uswtdb-v9-1-2026-10-19.zip"
if not Path(f"data/{ARCHIVE}").exists():
    Path(f"data/{ARCHIVE}").write_bytes(requests.get(f"https://data.spatialworkflow.io/{ARCHIVE}", timeout=600).content)
Z = zipfile.ZipFile(f"data/{ARCHIVE}")
wt = pd.read_csv(Z.open("uswtdb_V9_1_20260928.csv"), dtype={"t_fips": str})
Path("data/cb_2024_us_county_20m.zip").write_bytes(Z.read("cb_2024_us_county_20m.zip"))
counties = gpd.read_file("data/cb_2024_us_county_20m.zip")
print(f"US Wind Turbine Database v9.1: {len(wt):,} turbines; counties: {len(counties):,}")
US Wind Turbine Database v9.1: 77,839 turbines; counties: 3,222
Example 1: turbines and capacity by state
st = wt.groupby("t_state").agg(turbines=("case_id", "size"), gw=("t_cap", lambda s: s.sum() / 1e6))
st = st.sort_values("gw", ascending=False)
print(st.head(6).round(1).to_string())
print(f"states and territories with turbines: {len(st)}; top three's share of capacity: {st.gw.head(3).sum() / st.gw.sum():.1%}")
turbines gw
t_state
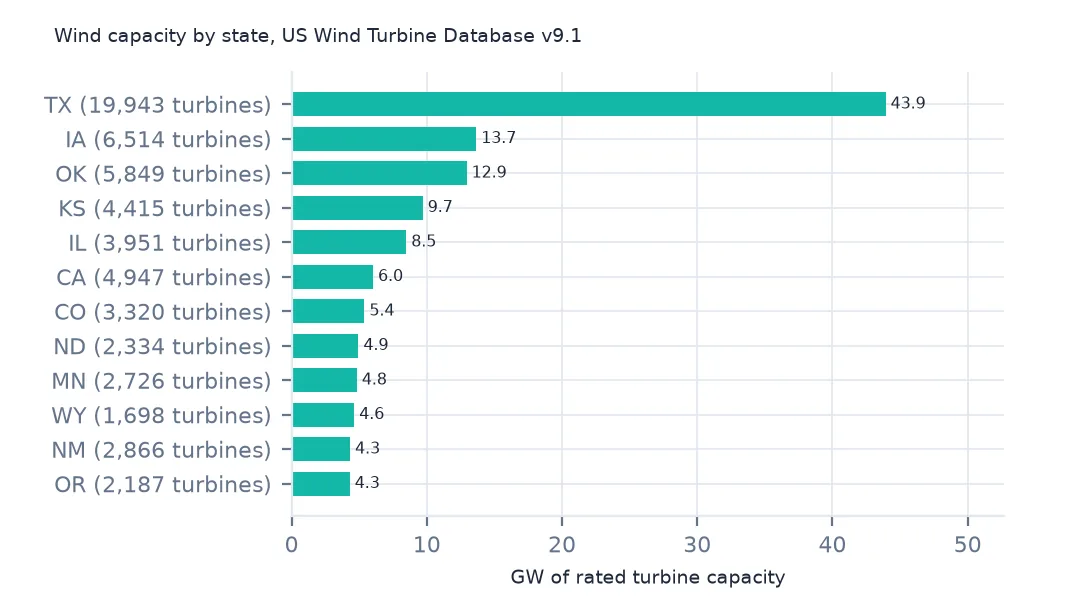
TX 19943 43.9
IA 6514 13.7
OK 5849 12.9
KS 4415 9.7
IL 3951 8.5
CA 4947 6.0
states and territories with turbines: 47; top three's share of capacity: 44.5%
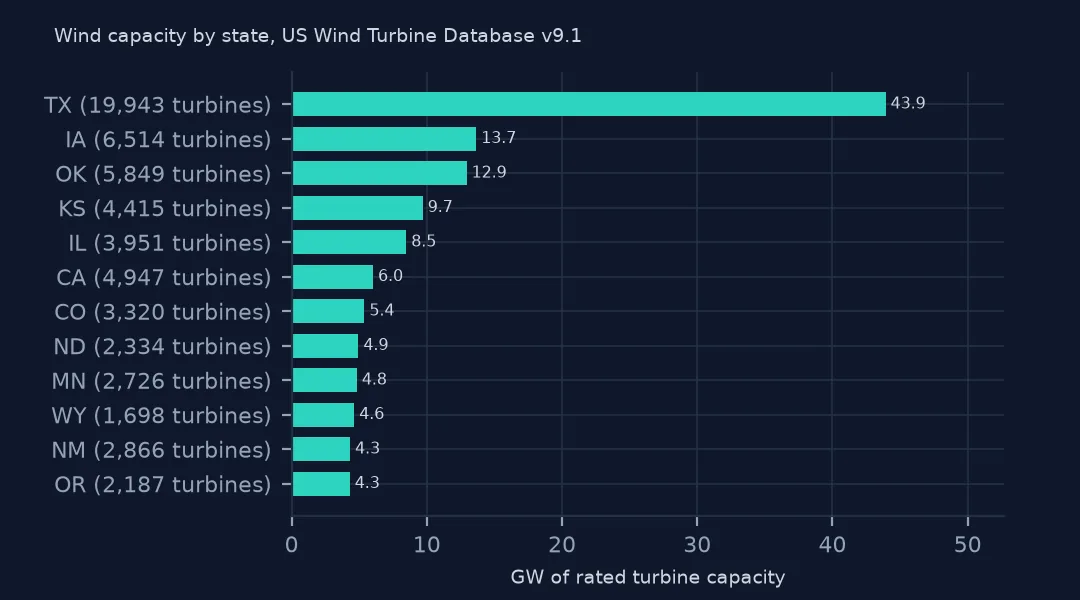
Texas has 19,943 turbines and 43.9 GW, more than the next three states together, and Texas, Iowa and Oklahoma hold 44.5% of the national capacity. California has more turbines than Kansas or Illinois but less capacity: many of its turbines are small machines from the 1980s in the Altamont, Tehachapi and San Gorgonio passes.
Example 2: every turbine on a map
g = gpd.GeoDataFrame(wt, geometry=gpd.points_from_xy(wt.xlong, wt.ylat), crs=4269)
away = ["AK", "HI", "PR", "GU"]
print(g[g.t_state.isin(away)].groupby("t_state").size().to_string())
print("offshore, no state:", g.t_state.isna().sum())
lower48 = g[~g.t_state.isin(away) & g.t_state.notna()].to_crs(5070)
ax = lower48.plot(markersize=0.3, figsize=(10, 6))
ax.set_axis_off()
t_state
AK 144
GU 1
HI 128
PR 63
offshore, no state: 124
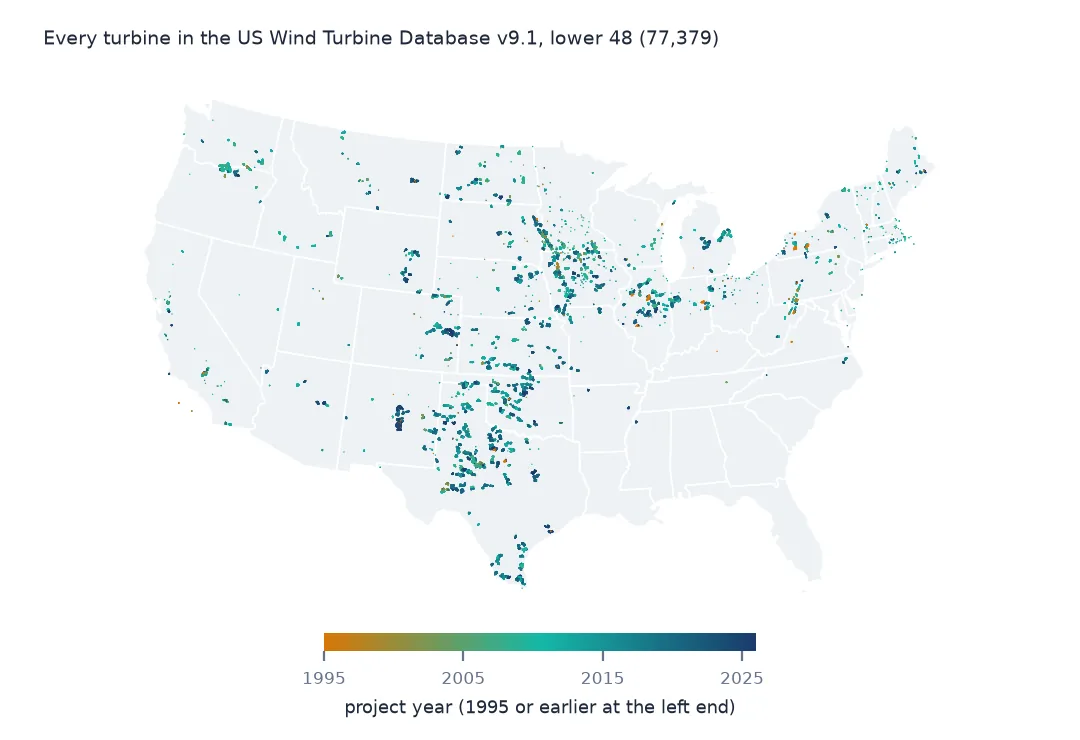
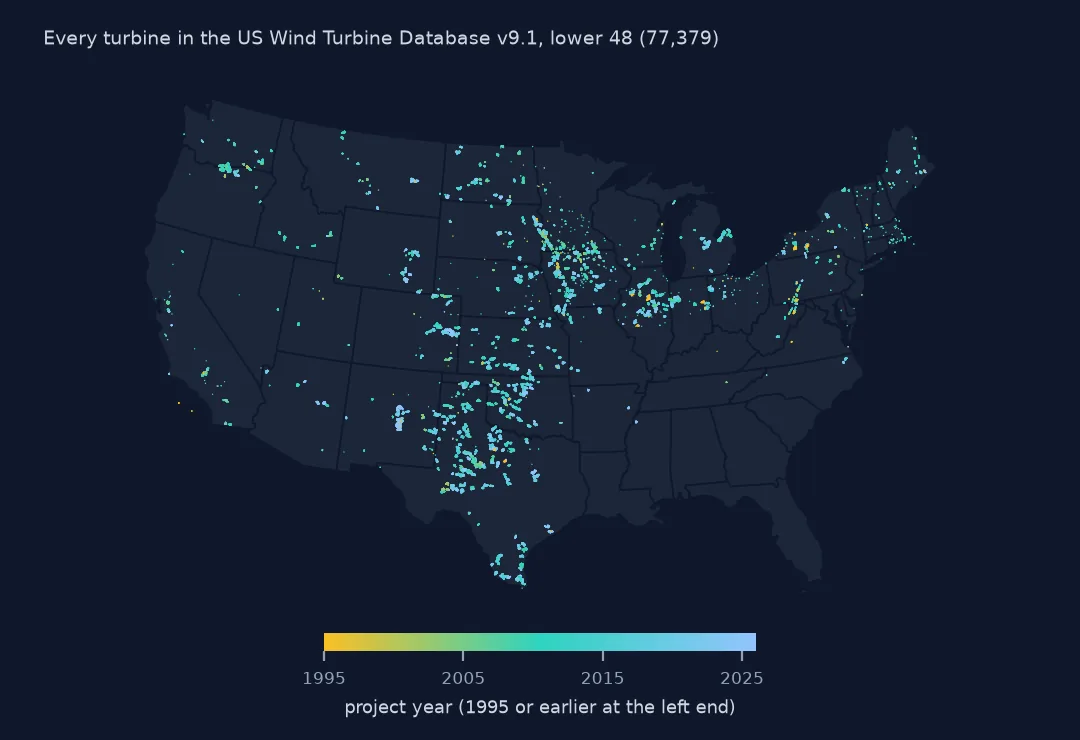
Outside the lower 48 there are 144 turbines in Alaska, 128 in Hawaii, 63 in Puerto Rico and one on Guam. The 124 offshore turbines with no state are left out of the map along with them. Plotted in an equal-area projection, the rest trace the wind belt from the Texas panhandle north through the plains to the Dakotas, with clusters in the Midwest, the Columbia Gorge and California's passes.
Internal links
- Where each record comes from — sources, confidence codes and quarterly versions
- Capacity by county — the county code read as text, then mapped
- Project capacity summed per turbine — why
p_capmust not be summed - Turbines against EIA-860 — the
eia_idjoin - Offshore turbines — the 124 rows with no state