
How to Map US Offshore Wind Turbines
On this page
Problem statement
The United States has only a few offshore wind turbines, but they are the largest machines in the country's fleet: rotors of 200 m and more on generators of 11 to 13 MW, most of them standing 14 to 64 km off the coasts of New England, New York and Virginia. The US Wind Turbine Database marks them with t_offshore and records them as they appear on imagery, so projects still under construction show only the turbines already standing. Most offshore rows have no state or county, because they stand in federal waters, so any grouping by state quietly drops them. This page maps the offshore turbines of version 9.1, assigns each project to its nearest coast and measures how far out they are.
Quick answer
Select t_offshore == 1, summarise by project, and compare the turbines in the file with the project's planned count p_tnum:
off = wt[wt.t_offshore == 1]
proj = off.groupby("p_name").agg(turbines=("case_id", "size"), planned=("p_tnum", "first"), year=("p_year", "first"),
                                 model=("t_model", "first"), mw_each=("t_cap", lambda s: s.iloc[0] / 1e3), state=("t_state", "first"))
print(proj.to_string())
print(f"offshore turbines: {len(off)}; with no state: {off.t_state.isna().sum()}")
turbines planned year model mw_each state
p_name
Block Island 5 5 2016.0 Haliade 150-6 6.0 RI
Coastal Virginia Offshore Wind 7 7 2020.0 SWT-6.0-154 6.0 NaN
Empire Wind I 5 5 2026.0 NaN NaN NaN
Revolution Wind 28 65 2025.0 SG-11.0-200-DD 11.0 NaN
South Fork Wind Farm 12 12 2024.0 SG11-200 11.0 NaN
Sunrise Wind 10 10 2026.0 SG-11.0-200-DD 11.0 NaN
Vineyard Wind 61 62 2025.0 Haliade-X 13.0 NaN
unknown NA 1 1 2026.0 NaN NaN NaN
offshore turbines: 129; with no state: 124
The file has 129 offshore turbines in seven named projects and one unnamed turbine. Block Island, Coastal Virginia's turbines, South Fork, Sunrise and Empire Wind I show as many turbines as planned in p_tnum. Revolution Wind has 28 of its 65 and Vineyard Wind 61 of 62: USGS adds a turbine when it is seen standing on imagery, so a project under construction fills in version by version. Empire Wind I and the unnamed turbine are too new for specifications.
No state, partly built
1. Why there is no state
print(wt[wt.t_state.isna()].t_offshore.value_counts().to_string())
print(f"offshore capacity that a groupby('t_state') drops: {off[off.t_state.isna()].t_cap.sum() / 1e3:,.0f} MW")
t_offshore
1 124
offshore capacity that a groupby('t_state') drops: 1,008 MW
Only Block Island stands in Rhode Island's own waters, within three nautical miles of the coast. Every other project is in federal waters on the outer continental shelf, outside any state or county, so the spatial join USGS uses to fill t_state and t_fips finds nothing.
2. Nearest coast
g = gpd.GeoDataFrame(off, geometry=gpd.points_from_xy(off.xlong, off.ylat), crs=4269).to_crs(5070)
land = counties.to_crs(5070)
near = gpd.sjoin_nearest(g, land[["NAME", "STUSPS", "geometry"]], distance_col="shore_m")
print(near.groupby("p_name").agg(state=("STUSPS", lambda s: s.mode().iloc[0]), county=("NAME", lambda s: s.mode().iloc[0]),
                                 km_min=("shore_m", lambda s: s.min() / 1e3), km_max=("shore_m", lambda s: s.max() / 1e3)).round(1).to_string())
state county km_min km_max
p_name
Block Island RI Washington 2.8 4.7
Coastal Virginia Offshore Wind VA Virginia Beach 38.3 63.5
Empire Wind I NY Nassau 23.9 39.3
Revolution Wind MA Dukes 13.5 25.4
South Fork Wind Farm RI Washington 27.8 32.2
Sunrise Wind RI Washington 24.6 36.2
Vineyard Wind MA Nantucket 23.7 37.0
unknown NA MA Dukes 16.0 16.0
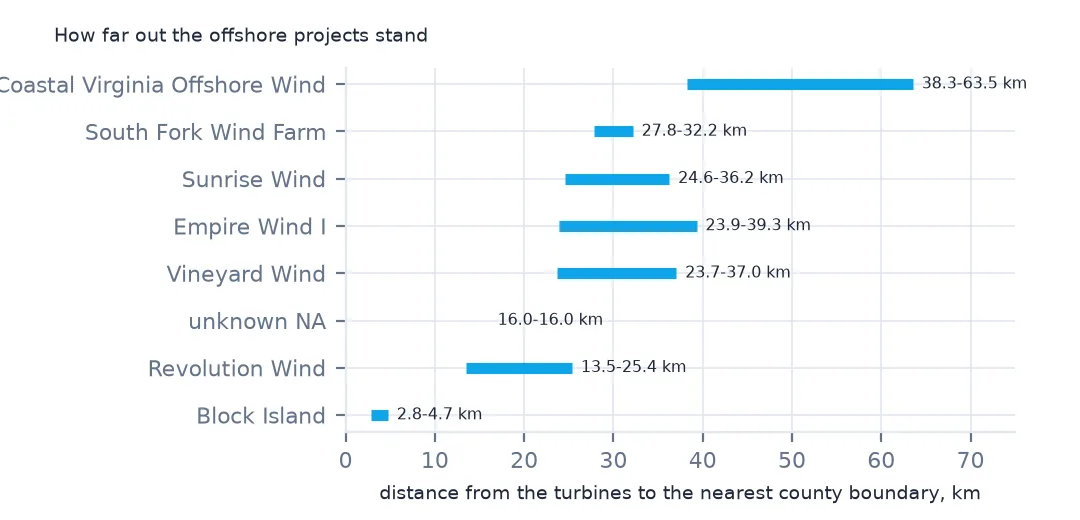
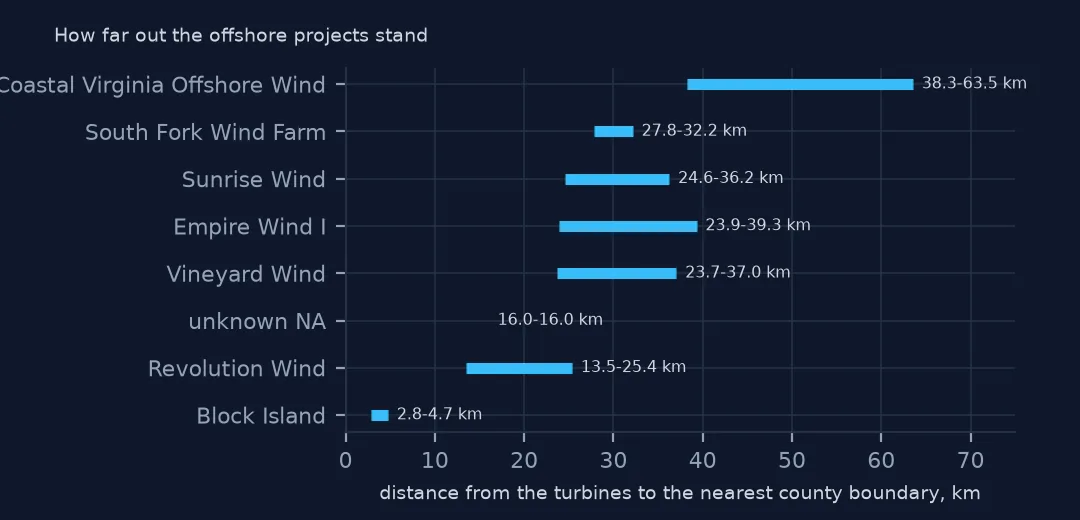
Measured to the nearest county boundary, Block Island's turbines stand 2.8 to 4.7 km offshore, and the federal-water projects 13.5 to 63.5 km out, Coastal Virginia furthest. The nearest county is not where the power lands or which state leases the area. It is only a label for grouping, so keep it in its own column rather than writing it into t_state.
The machines and the map
The data used on this page
The US Geological Survey's US Wind Turbine Database, version 9.1 of 28 September 2026 (Hoen and others, doi:10.5066/F7TX3DN0), public domain, saved on this site on 19 October 2026 because USGS replaces the file every quarter, and the Census Bureau's 2024 cartographic boundary counties (1:20 million, so distances to the coast are approximate to a few hundred metres).
from pathlib import Path
import zipfile

import geopandas as gpd
import pandas as pd
import requests

Path("data").mkdir(exist_ok=True)
# USGS US Wind Turbine Database v9.1 (28 September 2026) with its metadata and changelog, Census 2024 cartographic
# boundary counties and the EIA-860 2025 wind table. Saved 19 October 2026: USGS replaces the file every quarter.
# Live: https://energy.usgs.gov/uswtdb/assets/data/uswtdbCSV.zip
ARCHIVE = "usgs-uswtdb-v9-1-2026-10-19.zip"
if not Path(f"data/{ARCHIVE}").exists():
    Path(f"data/{ARCHIVE}").write_bytes(requests.get(f"https://data.spatialworkflow.io/{ARCHIVE}", timeout=600).content)
Z = zipfile.ZipFile(f"data/{ARCHIVE}")
wt = pd.read_csv(Z.open("uswtdb_V9_1_20260928.csv"), dtype={"t_fips": str})
Path("data/cb_2024_us_county_20m.zip").write_bytes(Z.read("cb_2024_us_county_20m.zip"))
counties = gpd.read_file("data/cb_2024_us_county_20m.zip")
print(f"US Wind Turbine Database v9.1: {len(wt):,} turbines, {int(wt.t_offshore.sum())} offshore")
US Wind Turbine Database v9.1: 77,839 turbines, 129 offshore
Example 1: offshore against onshore
on = wt[(wt.t_offshore == 0) & (wt.p_year >= 2024)]
print(pd.DataFrame({"offshore": off[["t_cap", "t_rd", "t_hh", "t_ttlh"]].median(), "onshore since 2024": on[["t_cap", "t_rd", "t_hh", "t_ttlh"]].median()}).to_string())
offshore onshore since 2024
t_cap 11000.0 3400.0
t_rd 200.0 140.0
t_hh 137.5 101.0
t_ttlh 239.9 177.4
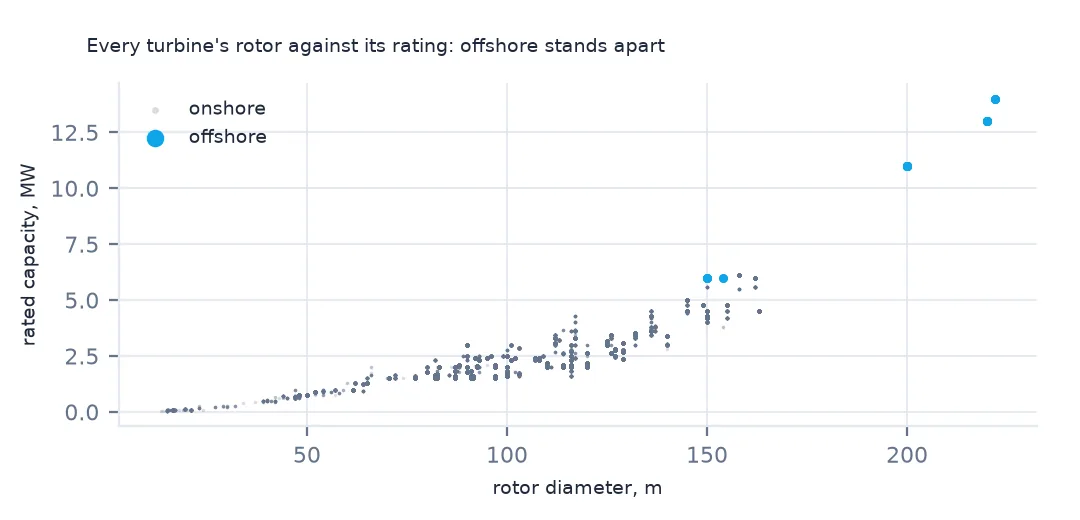
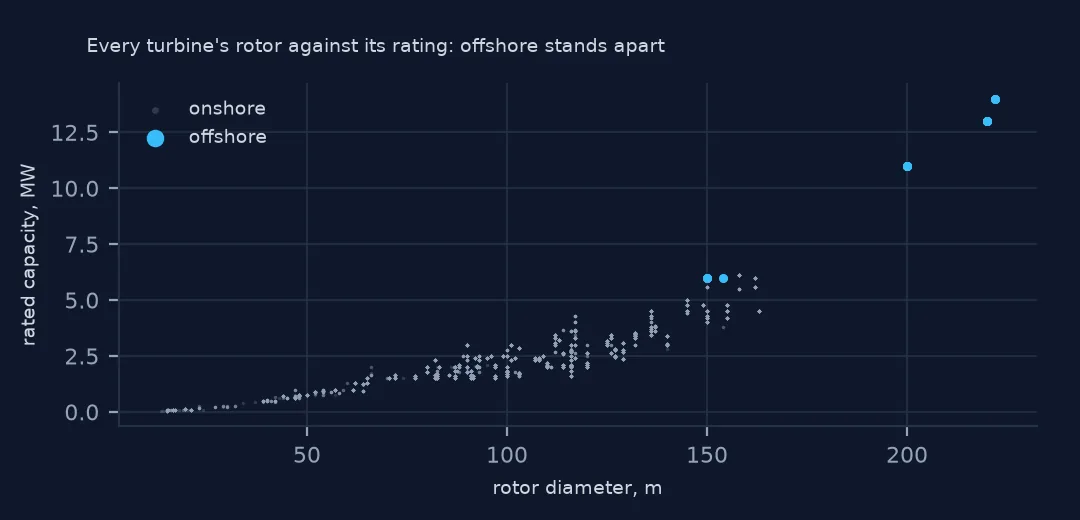
The median offshore turbine is rated at 11 MW, more than three times the 3.4 MW of onshore turbines from the same years, with a rotor 60 m wider and a hub 36.5 m higher. Its blade tips reach 239.9 m.
Example 2: the map
ne = near.to_crs(4326)
ax = counties[counties.STUSPS.isin(["MA", "RI", "CT", "NY", "NJ"])].plot(color="#e5e7eb", edgecolor="white", figsize=(8, 6))
ne.plot(ax=ax, column="p_name", markersize=6, legend=True)
ax.set_xlim(-74.5, -69.8); ax.set_ylim(40.3, 42.2)
print(f"turbines drawn south of New England and Long Island: {(ne.geometry.y > 40).sum()}")
turbines drawn south of New England and Long Island: 122
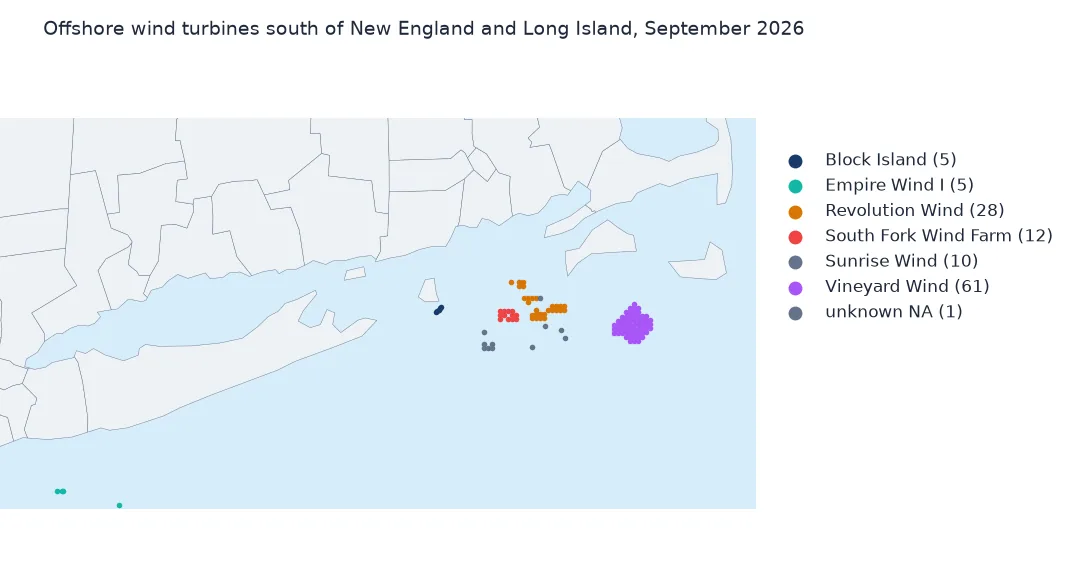
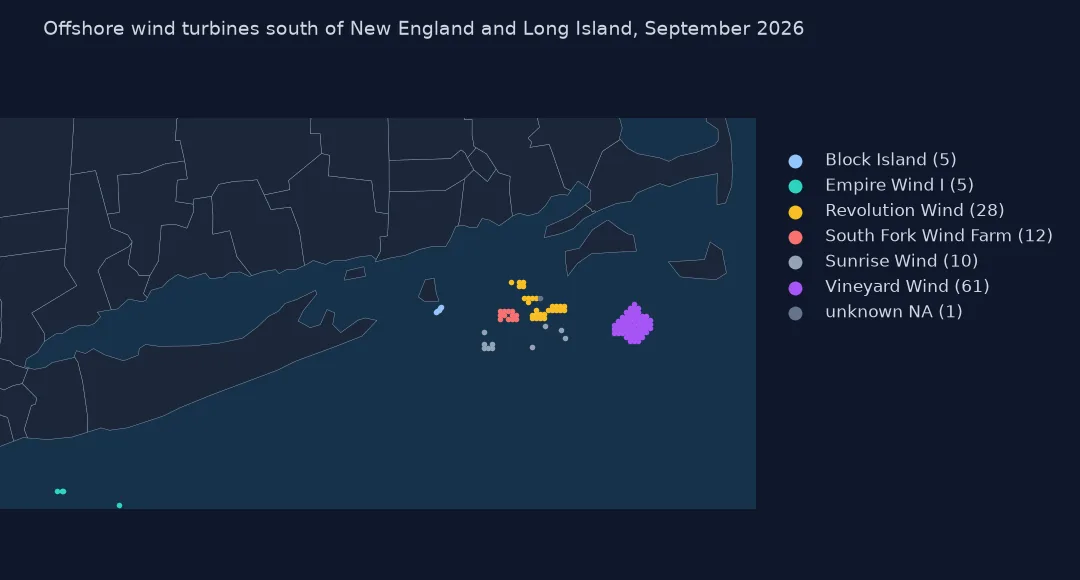
122 of the turbines lie in the waters south of Martha's Vineyard, Nantucket, Rhode Island and Long Island, where the federal lease areas are. The other seven are Coastal Virginia's, off Virginia Beach. On the map the projects form tidy grids, the subject of the spacing page.
Internal links
- Turbine spacing — the offshore grid measured in rotor diameters
- Turbine sizes by year — why the size chart leaves these out
- Manufacturer market share — why 2026 looks like one maker
- Nearest-neighbour joins — what
sjoin_nearestdoes