
How to Find Wind Turbine Market Share by Manufacturer
On this page
Problem statement
Three manufacturers built most of the wind turbines standing in the United States, but the US Wind Turbine Database spells them in sixty-two ways. Companies merged and were renamed while the fleet was built: Zond became Enron Wind and then GE, Bonus became Siemens and later Siemens Gamesa, NEG Micon was absorbed by Vestas. The file keeps whichever name its source used, so a ranking of the raw t_manu column splits one company's turbines across several rows. And the newest turbines mostly have no manufacturer at all yet, which makes the latest year's market share meaningless. This page groups the names into today's companies and measures market share by capacity and year.
Quick answer
Map the old and alternative names to the company that owns the business today, then sum rated capacity by company:
GROUP = {"GE Wind": "GE", "GE Vernova": "GE", "Enron": "GE", "Zond": "GE",
         "Siemens": "Siemens Gamesa", "Gamesa": "Siemens Gamesa", "Siemens Gamesa Renewable Energy": "Siemens Gamesa", "Bonus": "Siemens Gamesa",
         "NEG Micon": "Vestas", "Micon": "Vestas", "Nordtank": "Vestas", "Acciona": "Nordex", "Goldwind Americas": "Goldwind"}
wt["maker"] = wt.t_manu.map(GROUP).fillna(wt.t_manu)
gw = wt.groupby("maker").t_cap.sum().nlargest(5) / 1e6
print(pd.DataFrame({"GW": gw.round(1), "share": (gw / (wt.t_cap.sum() / 1e6)).round(3)}).to_string())
print(f"names in t_manu: {wt.t_manu.nunique()}; companies after grouping: {wt.maker.nunique()}")
GW share
maker
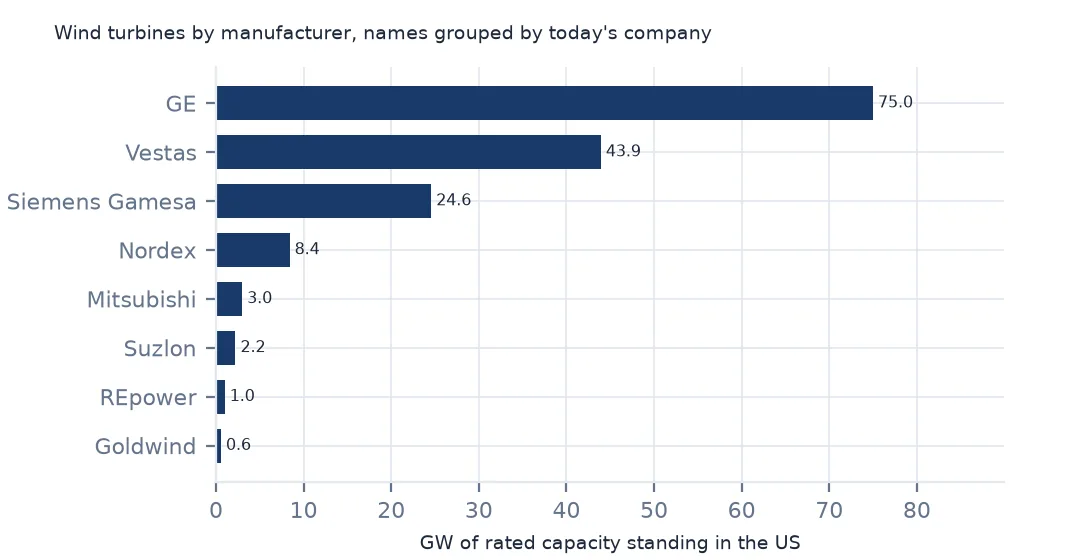
GE 75.0 0.470
Vestas 43.9 0.275
Siemens Gamesa 24.6 0.154
Nordex 8.4 0.053
Mitsubishi 3.0 0.019
names in t_manu: 62; companies after grouping: 51
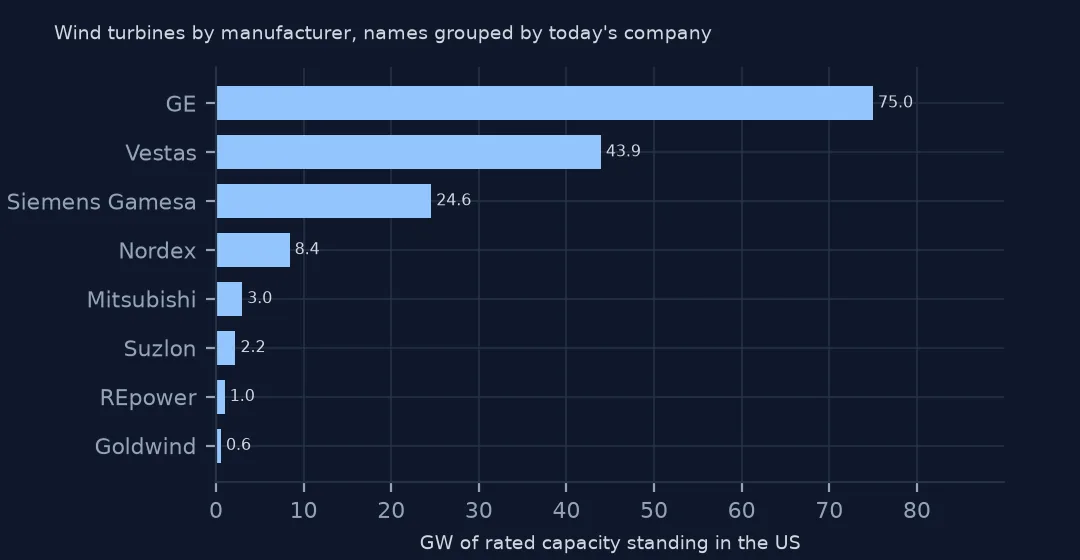
Grouped, GE built 47.0% of the rated capacity standing in the US, 75.0 GW, Vestas 27.5% and Siemens Gamesa 15.4%. Together the three account for nine tenths of it. Grouping only joins names that belong to one company today, so the 62 spellings become 51 companies. Most of the rest are small or long-gone makers with a handful of turbines each.
Names, mergers and missing makers
1. The raw names
print((wt.groupby("t_manu").t_cap.sum().nlargest(6) / 1e6).round(1).to_string())t_manu
GE Wind 73.4
Vestas 43.5
Siemens 10.4
Siemens Gamesa Renewable Energy 8.9
Nordex 7.0
Gamesa 5.2
Ranked by raw name, Siemens Gamesa appears three times, as Siemens with 10.4 GW, Siemens Gamesa Renewable Energy with 8.9 GW and Gamesa with 5.2 GW. Any one of them alone ranks far below Vestas, though together they hold 24.6 GW. A raw ranking also puts Nordex fifth with 7.0 GW, when with Acciona's turbines it has 8.4 GW.
2. The name follows the source, not the year
print(wt[wt.t_manu == "GE Vernova"].p_year.value_counts().sort_index().to_string())
print(f"GE Wind turbines in projects from 2024 on: {((wt.t_manu == 'GE Wind') & (wt.p_year >= 2024)).sum():,}")
p_year
2004.0 1
2005.0 7
2010.0 1
2016.0 1
2018.0 2
2020.0 21
2021.0 2
2022.0 43
2023.0 74
2025.0 249
GE Wind turbines in projects from 2024 on: 1,642
GE Vernova became a separate company in April 2024, yet the name appears on projects from 2004 on, while 1,642 turbines from 2024 and later still say GE Wind. The label is whatever the record's source wrote when it was added or last edited, so neither name tells you when a turbine was built.
3. The newest turbines have no manufacturer
print(wt.groupby("p_year").t_manu.apply(lambda s: s.isna().mean()).loc[[2010, 2020, 2024, 2025, 2026]].round(3).to_string())p_year
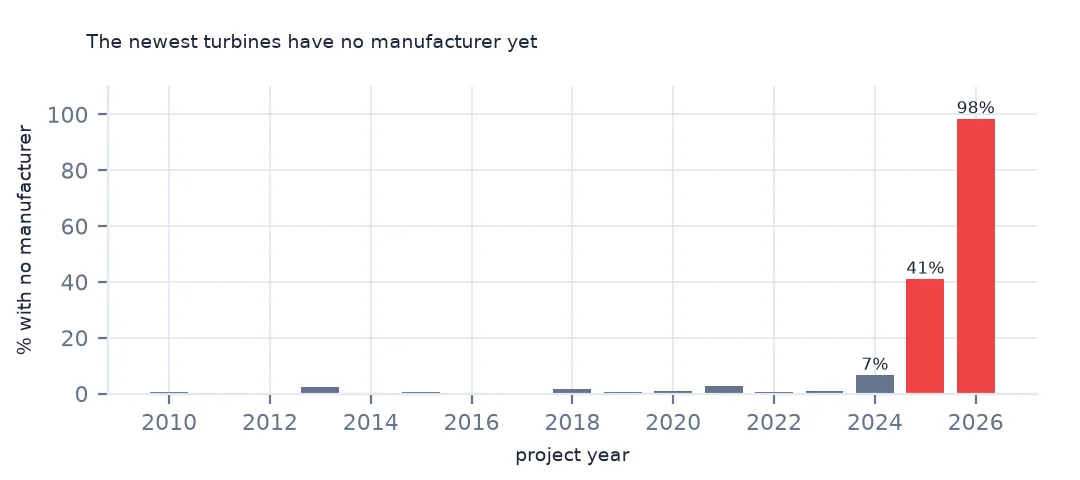
2010.0 0.006
2020.0 0.009
2024.0 0.065
2025.0 0.410
2026.0 0.984
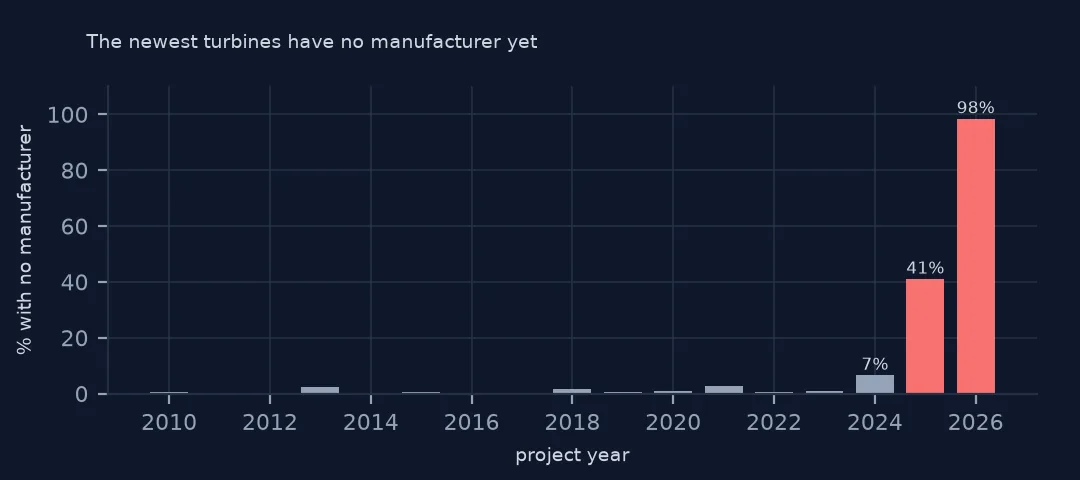
Until 2020 fewer than 1% of each year's turbines lack a manufacturer. For 2025 projects it is 41.0% and for 2026 projects 98.4%: USGS places new turbines from FAA filings and imagery first and adds the make and model later. The latest year's market share is therefore the share among the few turbines already described, which for 2026 means the offshore projects.
Share by year
The data used on this page
The US Geological Survey's US Wind Turbine Database, version 9.1 of 28 September 2026 (Hoen and others, doi:10.5066/F7TX3DN0), public domain, saved on this site on 19 October 2026 because USGS replaces the file every quarter.
from pathlib import Path
import zipfile

import pandas as pd
import requests

Path("data").mkdir(exist_ok=True)
# USGS US Wind Turbine Database v9.1 (28 September 2026) with its metadata and changelog, Census 2024 cartographic
# boundary counties and the EIA-860 2025 wind table. Saved 19 October 2026: USGS replaces the file every quarter.
# Live: https://energy.usgs.gov/uswtdb/assets/data/uswtdbCSV.zip
ARCHIVE = "usgs-uswtdb-v9-1-2026-10-19.zip"
if not Path(f"data/{ARCHIVE}").exists():
    Path(f"data/{ARCHIVE}").write_bytes(requests.get(f"https://data.spatialworkflow.io/{ARCHIVE}", timeout=600).content)
Z = zipfile.ZipFile(f"data/{ARCHIVE}")
wt = pd.read_csv(Z.open("uswtdb_V9_1_20260928.csv"), dtype={"t_fips": str})
print(f"US Wind Turbine Database v9.1: {len(wt):,} turbines; manufacturer missing on {wt.t_manu.isna().sum():,}")
US Wind Turbine Database v9.1: 77,839 turbines; manufacturer missing on 4,866
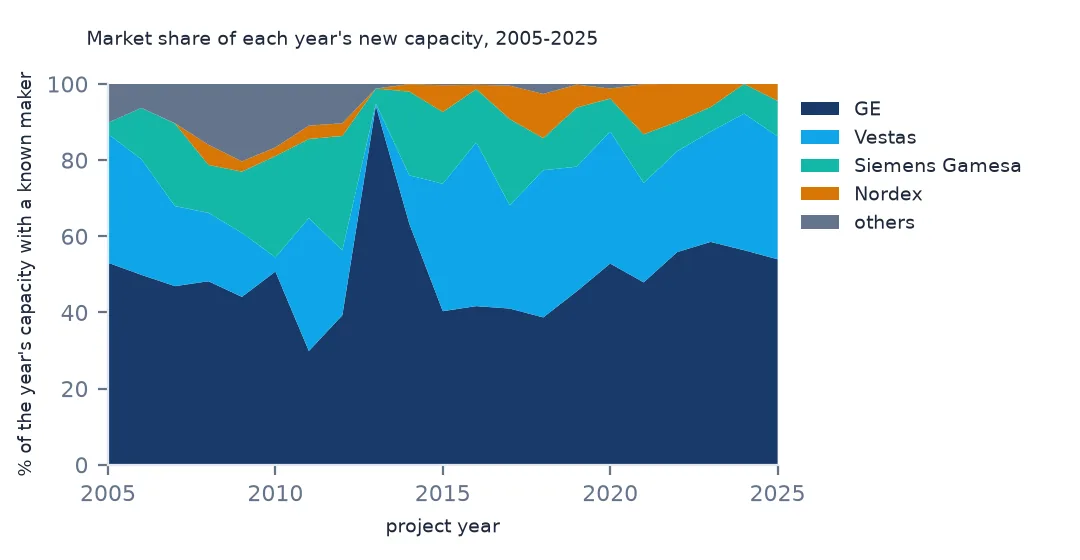
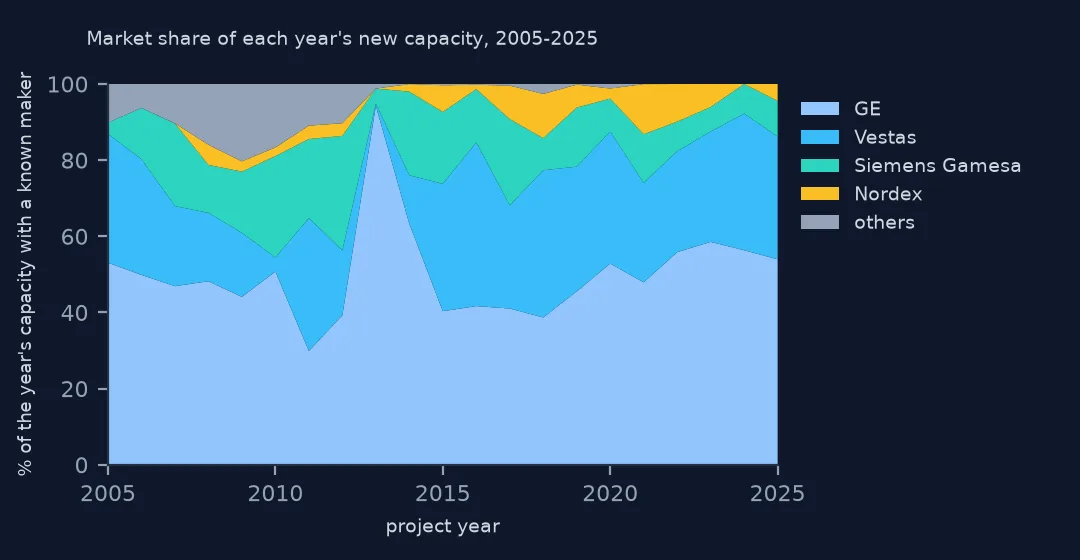
Example 1: share of each year's new capacity
known = wt[(wt.p_year >= 2005) & wt.maker.notna()]
sh = known.pivot_table(index="p_year", columns="maker", values="t_cap", aggfunc="sum").fillna(0)
sh = sh.div(sh.sum(axis=1), axis=0)
print(sh[["GE", "Vestas", "Siemens Gamesa", "Nordex"]].loc[[2005, 2010, 2015, 2020, 2024, 2025, 2026]].round(2).to_string())
maker GE Vestas Siemens Gamesa Nordex
p_year
2005.0 0.53 0.34 0.03 0.00
2010.0 0.51 0.04 0.27 0.02
2015.0 0.40 0.33 0.19 0.07
2020.0 0.53 0.35 0.09 0.03
2024.0 0.56 0.36 0.08 0.00
2025.0 0.54 0.32 0.09 0.04
2026.0 0.00 0.03 0.97 0.00
Year by year, GE leads in every year shown except 2026, with 40 to 56% of new capacity, and Vestas has 32 to 36% in most recent years. Single years swing with a few large projects, which is why Vestas drops to 4% in 2010 while Siemens Gamesa rises to 27%. The 97% for Siemens Gamesa in 2026 is the offshore turbines, the only 2026 turbines whose maker is known yet.
Example 2: the most common models
print((wt.groupby("t_model").t_cap.sum().nlargest(5) / 1e6).round(2).to_string())t_model
GE2.82-127 16.10
GE1.5-77 8.84
V110-2.0 8.52
GE2.3-116 4.47
GE2.8-127 4.43
The single most common machine by capacity is GE's 2.82 MW turbine with a 127 m rotor, 16.10 GW. Second is the GE 1.5 MW model with a 77 m rotor, the workhorse of the late 2000s, many of which have since been repowered. Vestas's V110-2.0 is third with 8.52 GW.
Internal links
- Reading the database — the columns and what is missing
- Where each record comes from — the confidence codes behind missing makers
- Offshore turbines — the projects behind 2026's share
- Turbine sizes by year — what the models grew into