
Wind Capacity Total Far Too High: Project Capacity Repeated per Turbine
On this page
Problem statement
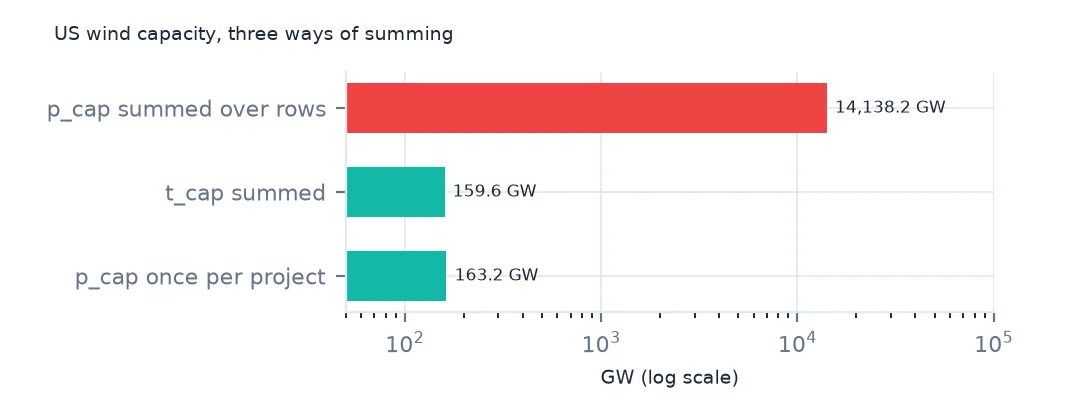
Sum the p_cap column of the US Wind Turbine Database and the United States appears to have about 14,000 GW of wind power, roughly ten times the capacity of every power plant in the country put together. Nothing is wrong with the file: p_cap is the capacity of the whole project, in megawatts, and it is written on every one of that project's turbines, so a 250 MW wind farm of 60 turbines contributes 15,000 MW to the sum. The same repetition distorts state totals, averages and anything else computed over rows. This page shows the repetition in version 9.1 and the two correct totals.
Quick answer
Sum the per-turbine column t_cap (kilowatts), not p_cap. If you need project capacity, take it once per project:
naive = wt.p_cap.sum() / 1e3
per_turbine = wt.t_cap.sum() / 1e6
per_project = wt.groupby(["p_name", "t_state"], dropna=False).p_cap.first().sum() / 1e3
print(f"p_cap summed over rows: {naive:,.1f} GW; t_cap summed: {per_turbine:,.1f} GW; p_cap once per project: {per_project:,.1f} GW")
p_cap summed over rows: 14,138.2 GW; t_cap summed: 159.6 GW; p_cap once per project: 163.2 GW
Summed over rows, p_cap gives 14,138.2 GW. Summed per turbine, t_cap gives 159.6 GW, and p_cap taken once per project 163.2 GW. The two right answers differ by 3.6 GW, for reasons step 3 shows. The wrong one is 89 times too large.
Project columns on turbine rows
1. The repetition
print(wt[wt.p_name == "25 Mile Creek"][["p_name", "p_tnum", "p_cap", "t_cap"]].head(3).to_string(index=False))
print(f"rows of 25 Mile Creek: {(wt.p_name == '25 Mile Creek').sum()}")
p_name p_tnum p_cap t_cap
25 Mile Creek 60 250.0 4200.0
25 Mile Creek 60 250.0 4200.0
25 Mile Creek 60 250.0 4200.0
rows of 25 Mile Creek: 60
Every p_ column describes the project and is copied onto each turbine row: p_cap in megawatts, p_tnum the number of turbines, p_year and p_name. Each t_ column describes the single turbine.
2. A project is not always one name
pr = wt.groupby(["p_name", "t_state"], dropna=False).agg(p_cap=("p_cap", "first"), caps=("p_cap", "nunique"), rows=("case_id", "size"), p_tnum=("p_tnum", "first"))
unknown = wt.p_name.str.startswith("unknown")
print(f"name and state groups: {len(pr):,}; with more than one p_cap: {(pr.caps > 1).sum()}; rows count equals p_tnum: {(pr.rows == pr.p_tnum).mean():.1%}")
print(f"turbines in 'unknown <county>' groups: {unknown.sum():,} in {wt[unknown].p_name.nunique()} names, p_cap known on {wt[unknown].p_cap.notna().sum()}")
name and state groups: 1,825; with more than one p_cap: 79; rows count equals p_tnum: 85.8%
turbines in 'unknown <county>' groups: 3,907 in 175 names, p_cap known on 137
Taking p_cap once per name is only an approximation. Phases of a wind farm sometimes share a name but have their own p_cap, and turbines whose project is not known are grouped as "unknown" plus the county name, which is not a project. That is why t_cap is the safer total.
3. Why the two right answers differ
d = pr.join(wt.groupby(["p_name", "t_state"], dropna=False).t_cap.sum(min_count=1).rename("t_cap_mw") / 1e3).dropna(subset=["p_cap", "t_cap_mw"])
d["gap"] = d.p_cap - d.t_cap_mw
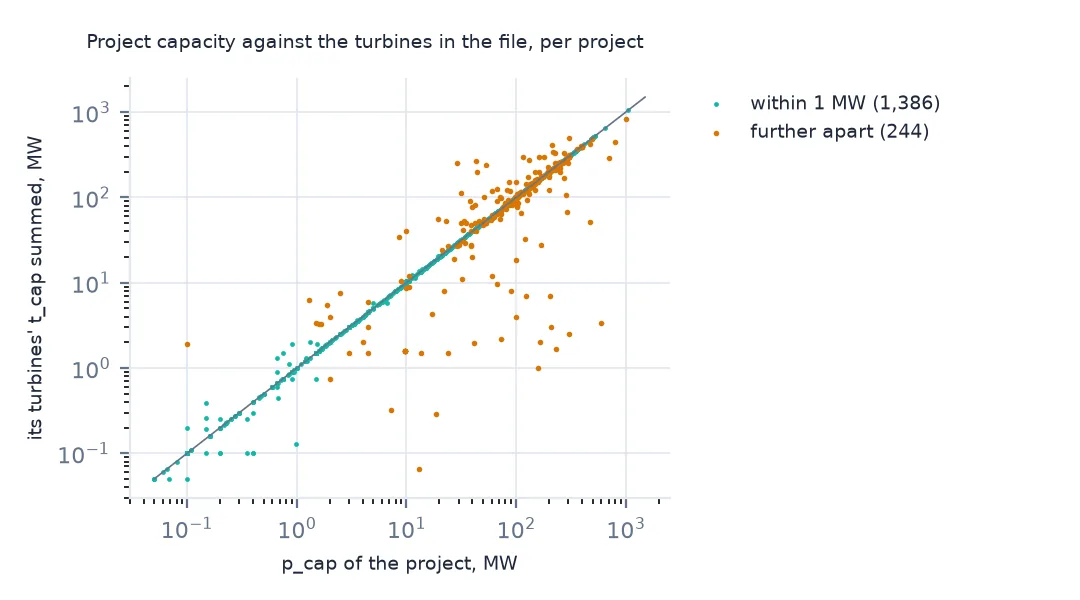
print(f"projects whose p_cap is within 1 MW of their turbines' sum: {(d.gap.abs() <= 1).mean():.1%}")
print(d.nlargest(3, "gap")[["p_tnum", "rows", "p_cap", "t_cap_mw"]].round(1).to_string())
projects whose p_cap is within 1 MW of their turbines' sum: 85.0%
p_tnum rows p_cap t_cap_mw
p_name t_state
Wagon Wheel Wind OK 176 162 598.4 3.4
Flat Ridge 2 Expansion KS 294 32 470.4 51.2
Revolution Wind NaN 65 28 704.0 286.0
For 85.0% of projects the two agree within 1 MW. The rest differ because p_cap describes the finished project while the file holds only the turbines USGS has seen and described. Wagon Wheel's 161 turbines without a capacity, the 32 turbines of Flat Ridge 2 Expansion's 294 under that name, and Revolution Wind's 28 of 65 turbines all leave t_cap short of p_cap. Use t_cap for what stands today, p_cap for what the project is meant to be.
State totals and averages
The data used on this page
The US Geological Survey's US Wind Turbine Database, version 9.1 of 28 September 2026 (Hoen and others, doi:10.5066/F7TX3DN0), public domain, saved on this site on 19 October 2026 because USGS replaces the file every quarter.
from pathlib import Path
import zipfile

import pandas as pd
import requests

Path("data").mkdir(exist_ok=True)
# USGS US Wind Turbine Database v9.1 (28 September 2026) with its metadata and changelog, Census 2024 cartographic
# boundary counties and the EIA-860 2025 wind table. Saved 19 October 2026: USGS replaces the file every quarter.
# Live: https://energy.usgs.gov/uswtdb/assets/data/uswtdbCSV.zip
ARCHIVE = "usgs-uswtdb-v9-1-2026-10-19.zip"
if not Path(f"data/{ARCHIVE}").exists():
    Path(f"data/{ARCHIVE}").write_bytes(requests.get(f"https://data.spatialworkflow.io/{ARCHIVE}", timeout=600).content)
Z = zipfile.ZipFile(f"data/{ARCHIVE}")
wt = pd.read_csv(Z.open("uswtdb_V9_1_20260928.csv"), dtype={"t_fips": str})
print(f"US Wind Turbine Database v9.1: {len(wt):,} turbines in {wt.p_name.nunique():,} project names")
US Wind Turbine Database v9.1: 77,839 turbines in 1,805 project names
Example 1: state totals
st = pd.DataFrame({"p_cap over rows": wt.groupby("t_state").p_cap.sum() / 1e3,
                   "t_cap": wt.groupby("t_state").t_cap.sum() / 1e6}).sort_values("t_cap", ascending=False)
print(st.head(4).round(1).to_string())
p_cap over rows t_cap
t_state
TX 4214.7 43.9
IA 1149.2 13.7
OK 1391.7 12.9
KS 1037.3 9.7
Every state is inflated by its own average number of turbines per project, so the error is not even a constant factor that a ranking would survive: Oklahoma overtakes Iowa when p_cap is summed over rows, though Iowa has more capacity.
Example 2: the average project
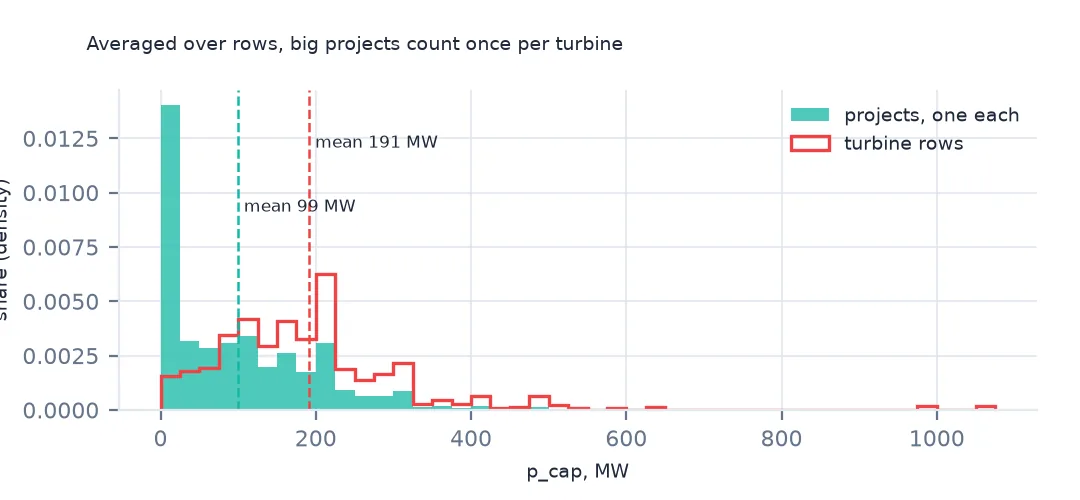
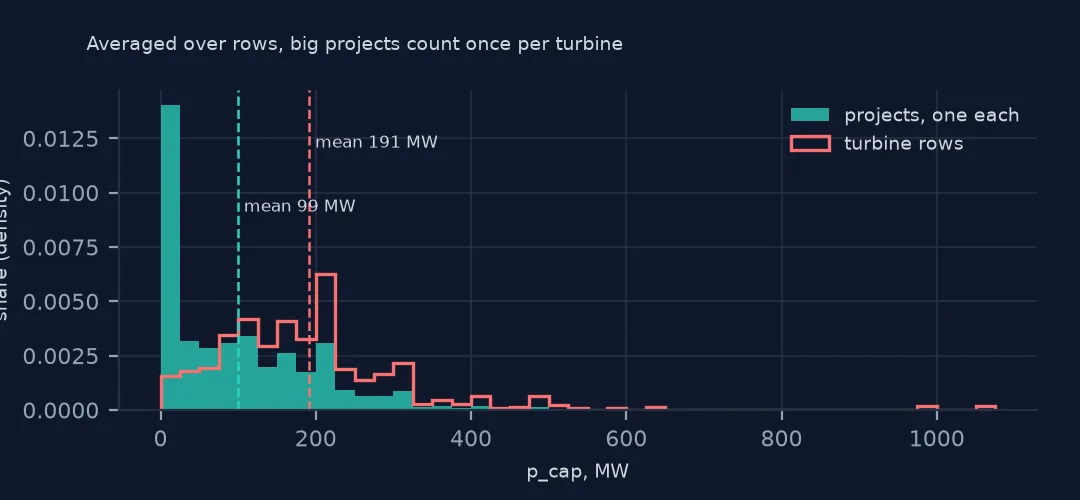
print(f"mean of p_cap over turbine rows: {wt.p_cap.mean():.1f} MW; mean over projects: {pr.p_cap.mean():.1f} MW")mean of p_cap over turbine rows: 191.1 MW; mean over projects: 99.3 MW
The row-wise mean is weighted by turbines, so large projects count once for each of their turbines and the "average project" comes out about twice its real size. The repetition doesn't only inflate sums.
Internal links
- Reading the database — the turbine and project columns
- Capacity by county — the
t_captotal mapped - Turbines against EIA-860 — project capacity as owners report it
- Nameplate or summer capacity — the other reason capacity totals disagree