
How to Chart Wind Turbine Height and Rotor Size by Year
On this page
Problem statement
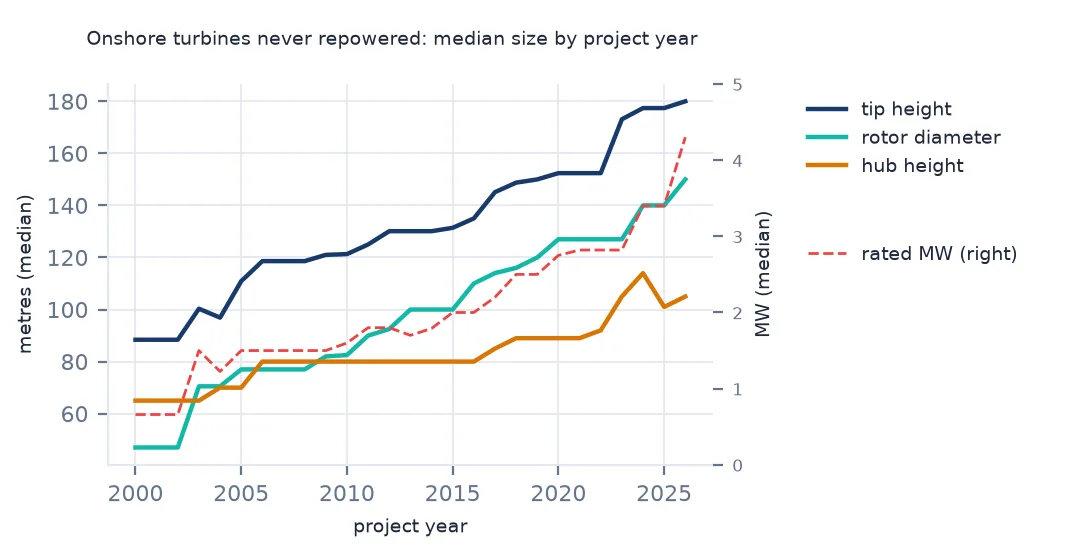
Onshore wind turbines have grown every few years: taller towers reach steadier wind, longer blades sweep more of it, and generators have been scaled up to match. The US Wind Turbine Database records hub height, rotor diameter, total tip height and rated capacity for nearly every turbine, with the year its project came online, so the growth can be charted by year. Three things distort that chart if left in: offshore turbines, which are a different machine; repowered turbines, which carry a new rotor under the project's original year; and the turbines from before 2000, most of which have already been taken down. This page charts the medians for onshore turbines in their original form.
Quick answer
Keep onshore turbines that were never retrofitted, then take the median of each size column by project year:
on = wt[(wt.t_offshore == 0) & (wt.t_retrofit == 0)]
y = on.groupby("p_year").agg(turbines=("case_id", "size"), kw=("t_cap", "median"), hub_m=("t_hh", "median"),
                             rotor_m=("t_rd", "median"), tip_m=("t_ttlh", "median"))
print(y.loc[[2000, 2005, 2010, 2015, 2020, 2025]].to_string())
turbines kw hub_m rotor_m tip_m
p_year
2000.0 28 660.0 65.0 47.0 88.4
2005.0 762 1500.0 70.0 77.0 110.9
2010.0 2369 1600.0 80.0 82.5 121.3
2015.0 4295 2000.0 80.0 100.0 131.4
2020.0 6229 2750.0 89.0 127.0 152.4
2025.0 3036 3400.0 101.0 140.0 177.4
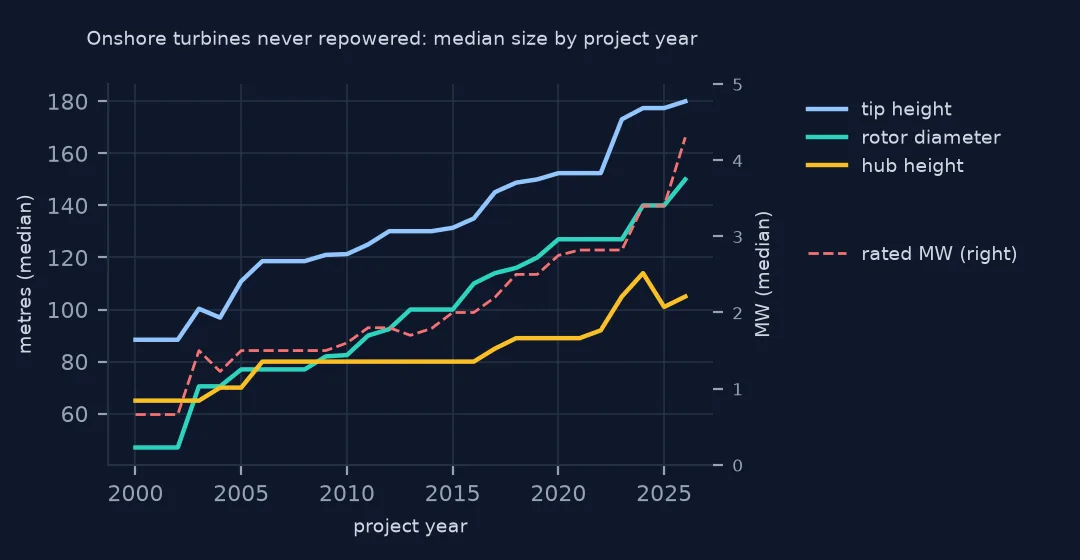
The median turbine of a 2025 project is rated at 3,400 kW, on a 101 m hub, with a 140 m rotor and a tip 177.4 m above the ground. Twenty years earlier the median was 1,500 kW, 70 m, 77 m and 110.9 m. Capacity has more than doubled, but the rotor grew fastest: its diameter rose by 82% while the hub rose by 44%. The years between are what the chart shows.
Which turbines to chart
1. Leave out offshore turbines
off = wt[wt.t_offshore == 1]
print(off.groupby("p_name")[["t_cap", "t_rd", "t_hh"]].median().to_string())
t_cap t_rd t_hh
p_name
Block Island 6000.0 150.0 106.0
Coastal Virginia Offshore Wind 14000.0 222.0 108.0
Empire Wind I NaN NaN NaN
Revolution Wind 11000.0 200.0 133.0
South Fork Wind Farm 11000.0 200.0 140.0
Sunrise Wind 11000.0 200.0 NaN
Vineyard Wind 13000.0 220.0 137.5
unknown NA NaN NaN NaN
The offshore machines are a different class: 11 to 14 MW with rotors of 200 to 222 m on most projects, against 3.4 MW and 140 m onshore. There are only a few hundred of them, but in the latest years they would pull the medians upward and make the onshore trend look steeper than it is. Two projects are too new to have specifications yet.
2. Leave out repowered turbines
for label, d in [("all turbines", wt[wt.t_offshore == 0]), ("never retrofitted", on)]:
    print(f"{label:>17}: median rotor of 2008 projects {d[d.p_year == 2008].t_rd.median():.1f} m")
all turbines: median rotor of 2008 projects 82.0 m
never retrofitted: median rotor of 2008 projects 77.0 m
With repowered turbines left in, the median rotor of 2008 projects is 82 m. Without them it is 77 m, the rotor those projects were built with. A third of the turbines from 2008 projects have since had new rotors fitted, and the file records the new size under the old year.
3. Old years are the survivors
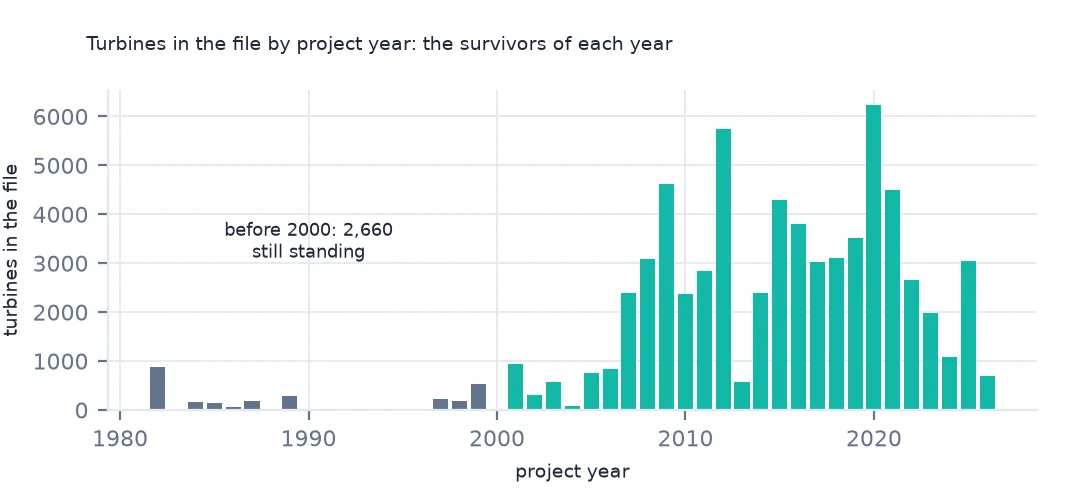
print(f"turbines in the file from projects before 2000: {on[on.p_year < 2000].shape[0]:,}; from 2000 on: {on[on.p_year >= 2000].shape[0]:,}")turbines in the file from projects before 2000: 2,660; from 2000 on: 65,499
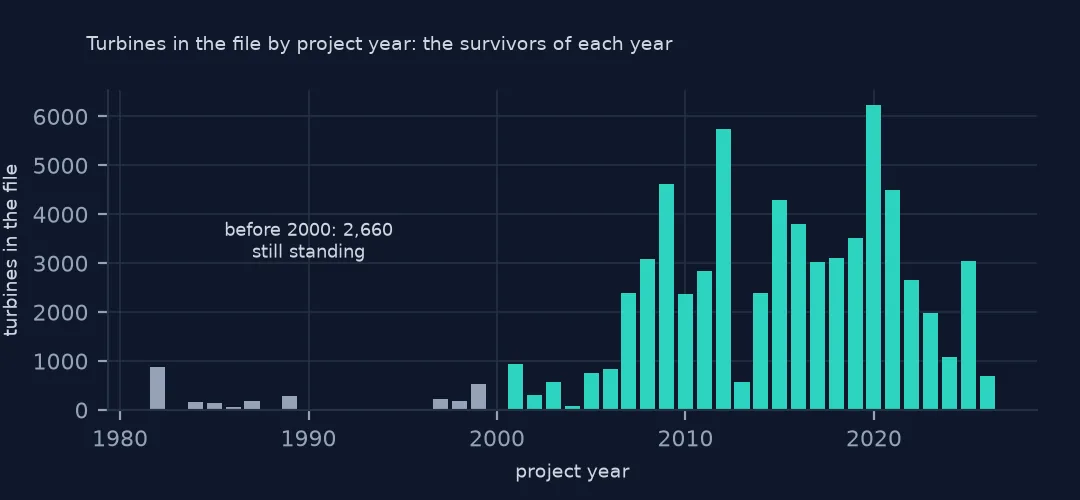
Projects from before 2000 account for 2,660 turbines in the file and projects from 2000 on for 65,499. The early years' medians come from the few machines still standing, and decommissioned turbines are removed from the database, so the chart starts in 2000 and the first years are the least representative.
Rotor against generator, and the tallest
The data used on this page
The US Geological Survey's US Wind Turbine Database, version 9.1 of 28 September 2026 (Hoen and others, doi:10.5066/F7TX3DN0), public domain, saved on this site on 19 October 2026 because USGS replaces the file every quarter.
from pathlib import Path
import zipfile

import pandas as pd
import requests

Path("data").mkdir(exist_ok=True)
# USGS US Wind Turbine Database v9.1 (28 September 2026) with its metadata and changelog, Census 2024 cartographic
# boundary counties and the EIA-860 2025 wind table. Saved 19 October 2026: USGS replaces the file every quarter.
# Live: https://energy.usgs.gov/uswtdb/assets/data/uswtdbCSV.zip
ARCHIVE = "usgs-uswtdb-v9-1-2026-10-19.zip"
if not Path(f"data/{ARCHIVE}").exists():
    Path(f"data/{ARCHIVE}").write_bytes(requests.get(f"https://data.spatialworkflow.io/{ARCHIVE}", timeout=600).content)
Z = zipfile.ZipFile(f"data/{ARCHIVE}")
wt = pd.read_csv(Z.open("uswtdb_V9_1_20260928.csv"), dtype={"t_fips": str})
print(f"US Wind Turbine Database v9.1: {len(wt):,} turbines, {wt.p_year.min():.0f} to {wt.p_year.max():.0f}")
US Wind Turbine Database v9.1: 77,839 turbines, 1982 to 2026
Example 1: specific power
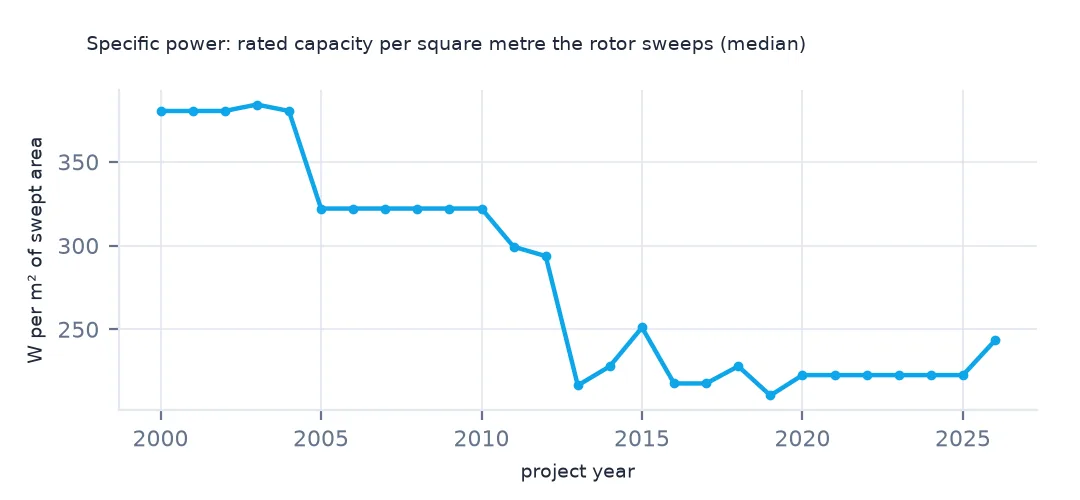
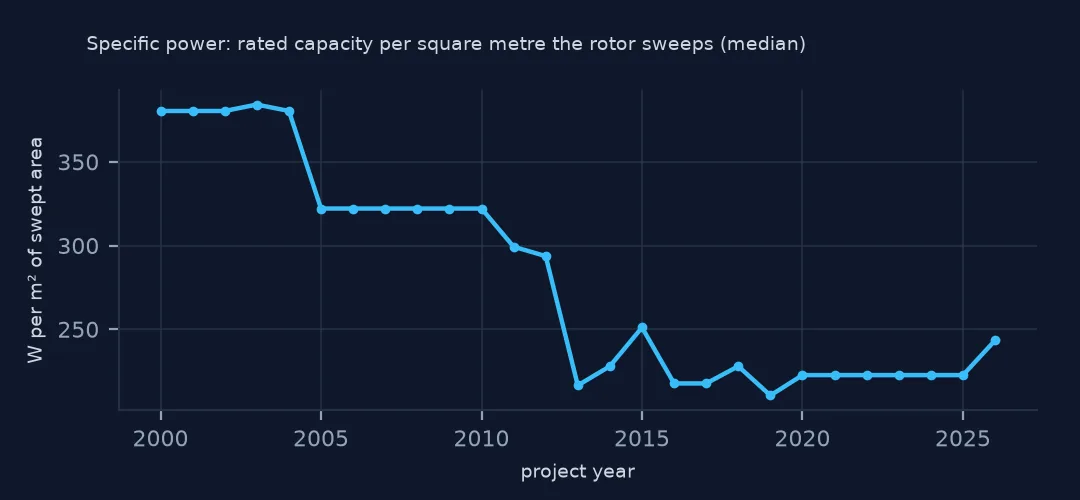
on = on.assign(w_per_m2=on.t_cap * 1000 / on.t_rsa, rotor_to_hub=on.t_rd / on.t_hh)
print(on.groupby("p_year")[["w_per_m2", "rotor_to_hub"]].median().loc[[2005, 2010, 2015, 2020, 2025]].round(2).to_string())
w_per_m2 rotor_to_hub
p_year
2005.0 322.12 0.96
2010.0 322.12 1.03
2015.0 251.07 1.25
2020.0 222.61 1.43
2025.0 222.61 1.43
The median specific power fell from 322 W/m² in 2005 and 2010 to 223 W/m² in 2020 and 2025, and the rotor grew from about as wide as the tower was tall to 1.43 times the hub height. Manufacturers lengthened blades faster than they raised generator ratings, so that turbines would produce more from the moderate winds of the plains.
Specific power, the rated capacity divided by the area the rotor sweeps, measures how big the rotor is for its generator. A lower value means a turbine that reaches its rated output in lighter wind and runs closer to it for more of the year.
Example 2: the tallest turbines
print(on.nlargest(1, "t_ttlh")[["p_name", "t_state", "p_year", "t_model", "t_hh", "t_rd", "t_ttlh"]].to_string(index=False))
print(f"onshore turbines with a tip above 200 m: {(on.t_ttlh > 200).sum()}")
p_name t_state p_year t_model t_hh t_rd t_ttlh
Delta Wind Project MS 2024.0 V150-4.5 136.0 150.0 210.9
onshore turbines with a tip above 200 m: 41
The tallest onshore turbines are Vestas V150-4.5 machines of the Delta Wind Project in Mississippi, online in 2024: a 136 m hub and a 150 m rotor give a tip of 210.9 m. 41 onshore turbines in the file reach above 200 m.
Internal links
- Repowered turbines — why step 2 matters
- Where each record comes from — decommissioned turbines leave the file
- Offshore turbines — the machines step 1 leaves out
- Wind speed at hub height — why towers keep getting taller