
The US Wind Turbine Database Explained: Where Each Turbine Record Comes From
On this page
Problem statement
The US Wind Turbine Database looks like a plain list of turbines, but every record is assembled. The point comes from the Federal Aviation Administration's obstacle files, is checked against aerial imagery and moved to the base of the tower; the make and model come from the industry association, the developer or the FAA filing, and the capacity, hub height and rotor size are then looked up from the model. USGS rates its confidence in each part, records which imagery it used, and every quarter adds new turbines and removes ones that have gone. Knowing this is what tells you which questions the file can answer: where turbines stand today, yes; how many stood in 2012, no. This page reads those parts of version 9.1.
Quick answer
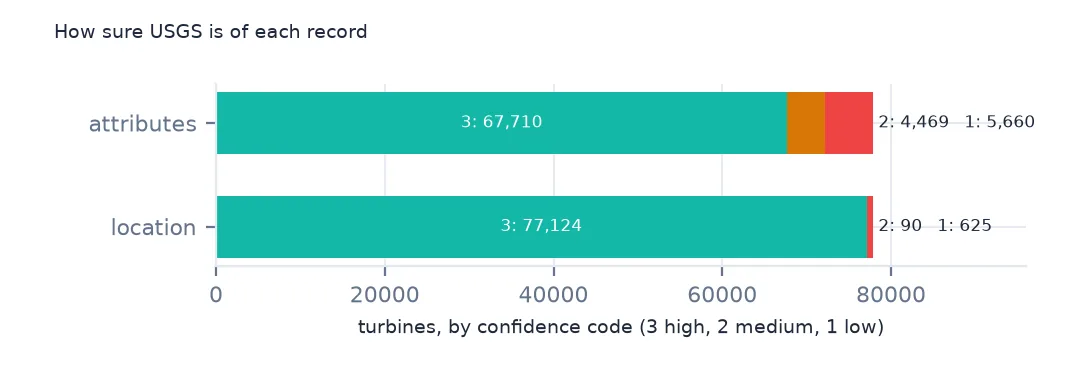
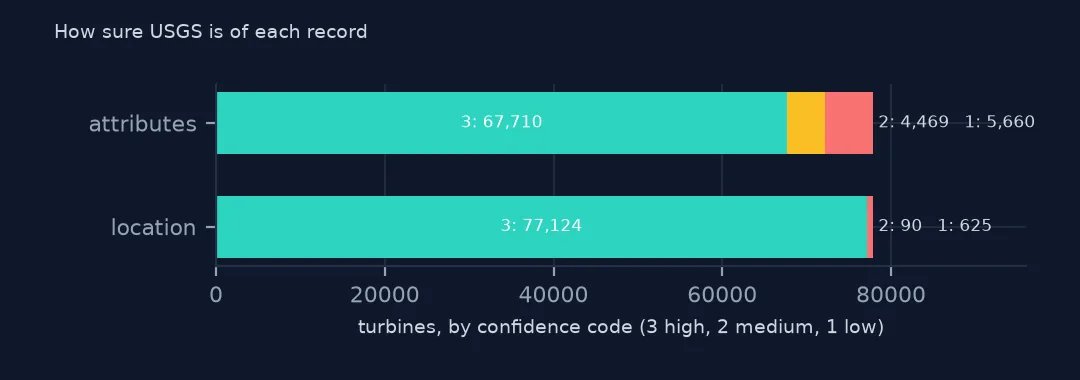
Each record carries two confidence codes, for its attributes and its location, from 1 (low) to 3 (high), and low attribute confidence means the specifications are mostly missing:
print(wt.t_conf_atr.value_counts().sort_index().rename("attributes").to_frame().join(wt.t_conf_loc.value_counts().rename("location")).to_string())
print(wt.groupby("t_conf_atr")[["t_model", "t_cap", "t_hh"]].agg(lambda s: s.notna().mean()).round(3).to_string())
attributes location
t_conf_atr
1 5660 625
2 4469 90
3 67710 77124
t_model t_cap t_hh
t_conf_atr
1 0.135 0.136 0.085
2 0.997 1.000 0.940
3 1.000 0.998 1.000
Location confidence is high for all but 715 turbines. Attribute confidence is lower: 5,660 turbines are rated 1, and of those only 13.5% have a model and 8.5% a hub height. Code 1 mostly marks turbines whose position is confirmed but whose make and model USGS has not found yet. Code 2 has a model with nearly complete specifications, and code 3 is complete.
How a record is built
1. The point: FAA filings, checked on imagery
print(f"FAA obstacle number: {wt.faa_ors.notna().mean():.1%}; FAA study number: {wt.faa_asn.notna().mean():.1%}; EIA plant: {wt.eia_id.notna().mean():.1%}")
print(wt.t_img_src.value_counts().to_string())
FAA obstacle number: 95.7%; FAA study number: 95.4%; EIA plant: 93.5%
t_img_src
Vantor 59839
Bing Maps Aerial 6346
Planet 5559
NAIP 5234
Google Earth 861
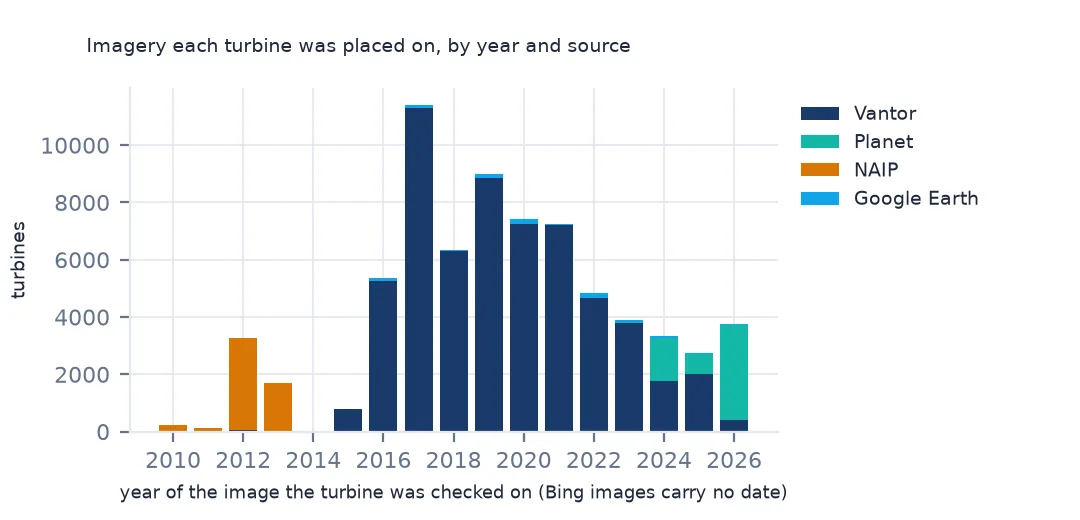
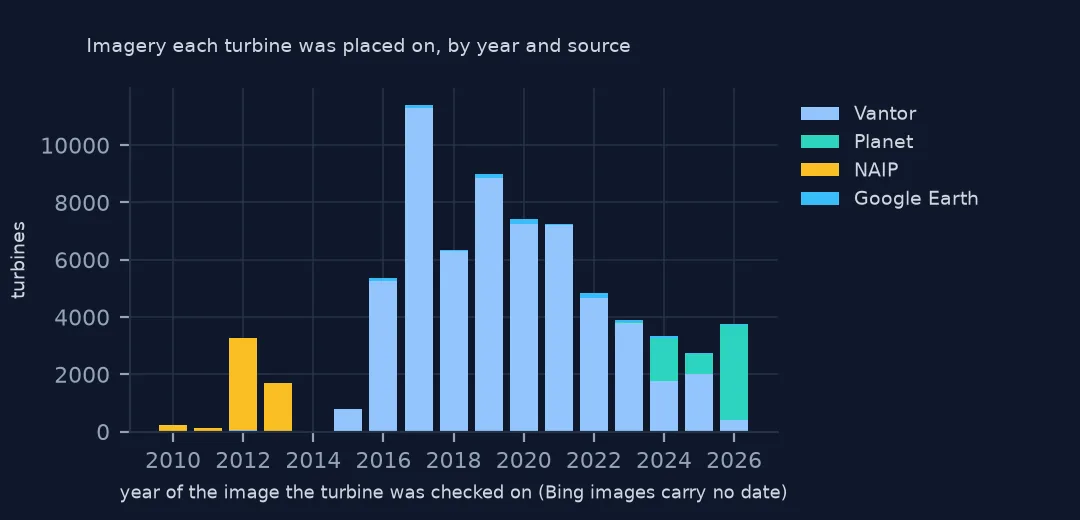
Almost every turbine carries an FAA number. Any structure taller than 200 feet must be notified to the FAA, which publishes it as an obstacle, and nearly every modern turbine is that tall. Those filings are how USGS learns of new turbines. Each point is then placed on aerial imagery at the base of the tower. Vantor (formerly Maxar) imagery was used for 59,839 turbines, and Bing, Planet, the USDA's NAIP photography and Google Earth for the rest.
2. The imagery date
img = pd.to_datetime(wt.t_img_date, format="%m/%d/%Y", errors="coerce")
print("no imagery date, by source:", img.isna().groupby(wt.t_img_src).sum()[lambda n: n > 0].to_dict())
print("dated 1 January, by source:")
print(((img.dt.month == 1) & (img.dt.day == 1)).groupby(wt.t_img_src).mean().round(3).to_string())
print(f"imagery from a year before the project year: {(img.dt.year < wt.p_year).sum():,}")
no imagery date, by source: {'Bing Maps Aerial': 6346, 'Vantor': 121}
dated 1 January, by source:
t_img_src
Bing Maps Aerial 0.000
Google Earth 0.000
NAIP 0.999
Planet 0.011
Vantor 0.000
imagery from a year before the project year: 1,271
Bing's imagery comes with no date at all, so all 6,346 turbines checked on it have none. NAIP photographs carry only a year, so USGS sets their month and day to 1 January, and 99.9% of NAIP-checked records show that date. Treat it as a year. 1,271 turbines were seen on imagery from before their project's year: they stood before the project came online, which fits the metadata's warning that p_year is sometimes estimated from the year a turbine was erected.
3. The specifications come from the model
spec = wt.dropna(subset=["t_model", "t_cap"]).groupby("t_model").t_cap.nunique()
print(f"models: {len(spec)}; models with more than one capacity: {(spec > 1).sum()}")
print(f"turbines with a model but no capacity: {(wt.t_model.notna() & wt.t_cap.isna()).sum()}")
models: 329; models with more than one capacity: 38
turbines with a model but no capacity: 164
USGS does not measure the specifications. It looks them up from the make and model: capacity, hub height and rotor diameter come from the manufacturer, the developer, the industry association or the FAA filing. 38 of 329 models appear with more than one capacity, because the same rotor and tower are sold with several generator ratings and the model name doesn't always say which. Only 164 turbines have a model but no capacity.
Versions and what they remove
The data used on this page
The US Geological Survey's US Wind Turbine Database, version 9.1 of 28 September 2026 (Hoen and others, doi:10.5066/F7TX3DN0), public domain, with the changelog that comes in the download. USGS replaces the file every quarter, so the version used here was saved on this site on 19 October 2026.
from pathlib import Path
import re
import zipfile

import pandas as pd
import requests

Path("data").mkdir(exist_ok=True)
# USGS US Wind Turbine Database v9.1 (28 September 2026) with its metadata and changelog, Census 2024 cartographic
# boundary counties and the EIA-860 2025 wind table. Saved 19 October 2026: USGS replaces the file every quarter.
# Live: https://energy.usgs.gov/uswtdb/assets/data/uswtdbCSV.zip
ARCHIVE = "usgs-uswtdb-v9-1-2026-10-19.zip"
if not Path(f"data/{ARCHIVE}").exists():
    Path(f"data/{ARCHIVE}").write_bytes(requests.get(f"https://data.spatialworkflow.io/{ARCHIVE}", timeout=600).content)
Z = zipfile.ZipFile(f"data/{ARCHIVE}")
wt = pd.read_csv(Z.open("uswtdb_V9_1_20260928.csv"), dtype={"t_fips": str})
log = Z.read("CHANGELOG.txt").decode()
print(f"US Wind Turbine Database v9.1: {len(wt):,} turbines; changelog {len(log.splitlines()):,} lines")
US Wind Turbine Database v9.1: 77,839 turbines; changelog 1,071 lines
Example 1: every version since 2018
parts = re.split(r"\n## \[v?([\d.]+)\] - (\d{4}-\d{2}-\d{2})", "\n" + log)


def count(pattern, text):
    return sum(int(n.replace(",", "")) for n in re.findall(pattern, text))


ch = pd.DataFrame([{"version": v, "date": d, "new": count(r"([\d,]+) new turbines?", body),
                    "decommissioned": count(r"([\d,]+) decommissioned turbines?", body),
                    "duplicates": count(r"([\d,]+) duplicate turbines?", body),
                    "not a turbine": count(r'([\d,]+) (?:turbines )?reclassified as "not a turbine"', body)}
                   for v, d, body in zip(parts[1::3], parts[2::3], parts[3::3])])
print(f"{len(ch)} versions, {ch.date.min()} to {ch.date.max()}")
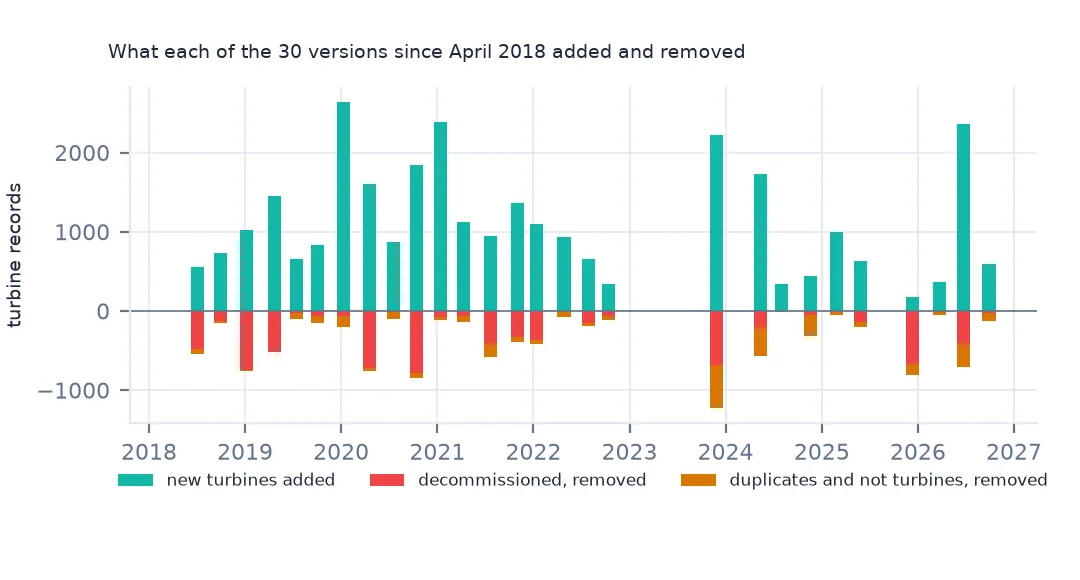
print(ch.head(4).to_string(index=False))
print(ch[["new", "decommissioned", "duplicates", "not a turbine"]].sum().to_string())
30 versions, 2018-04-19 to 2026-09-28
version date new decommissioned duplicates not a turbine
9.1 2026-09-28 592 23 53 55
9.0 2026-06-22 2362 419 290 1
8.3 2026-03-25 367 3 41 13
8.2 2025-12-10 179 675 50 86
new 30890
decommissioned 7227
duplicates 1950
not a turbine 1089
The changelog in the download covers 30 versions, from the first public release in April 2018 to version 9.1. Since then 30,890 new turbines were added, and 7,227 decommissioned turbines, 1,950 duplicates and 1,089 structures that turned out not to be turbines were removed, on top of the 5,992 records the first release dropped from the older USGS dataset. Version 8.2 in December 2025 removed 675 decommissioned turbines and added only 179 new ones.
Example 2: a current fleet, not a history
by_year = wt.groupby("p_year").size()
print(by_year.loc[[1985, 1990, 1995, 2000]].to_string())
print(f"turbines with no project year: {wt.p_year.isna().sum()}")
p_year
1985.0 148
1990.0 1
1995.0 1
2000.0 28
turbines with no project year: 842
Because decommissioned turbines are deleted, the file describes the fleet standing today. Only 148 turbines remain from 1985 projects and one each from 1990 and 1995. Thousands more were built in those years and have since been removed or replaced. Counting turbines by p_year gives the survivors of each year, not what was installed, so for installations by year use EIA's operating dates or an older version of this file. For the same reason, a turbine missing from version 9.1 may have stood in an earlier version.
Getting the turbine data without code
- Look first: the USWTDB Viewer is a map of every turbine. Click one for its project, model, size and imagery date, or filter by state, year and height. No download is needed.
- Download: the data page has the whole database as CSV (about 2 MB zipped), shapefile (about 7 MB) and GeoJSON (about 2 MB). The CSV opens in a spreadsheet. The shapefile and GeoJSON open in QGIS or ArcGIS. Each download comes with the XML metadata, which defines every column.
- How current it is: USGS updates the file up to every quarter, and it lags new installations by about a quarter. Older versions are kept on ScienceBase. That matters because each version removes turbines that have been taken down.
- Terms and credit: USGS data are public domain, and the metadata sets no use constraints. The suggested citation is Hoen, Diffendorfer, Rand, Kramer, Garrity and Hunt, United States Wind Turbine Database V9.1 (September 28, 2026), USGS, American Clean Power Association and Lawrence Berkeley National Laboratory data release, doi:10.5066/F7TX3DN0.
- The copy these pages use: version 9.1 is saved unchanged at data.spatialworkflow.io with its metadata and changelog, so the numbers here can be checked after USGS publishes the next version.
Internal links
- Reading the file in Python — columns, units and gaps
- Repowered turbines — new rotors under an old project year
- Turbines against EIA-860 — the plant identifiers the record carries
- Turbine sizes by year — what the current fleet says about the past