
Fixing World Port Index Averages Pulled Down by Zeros That Mean Unknown
On this page
Problem statement
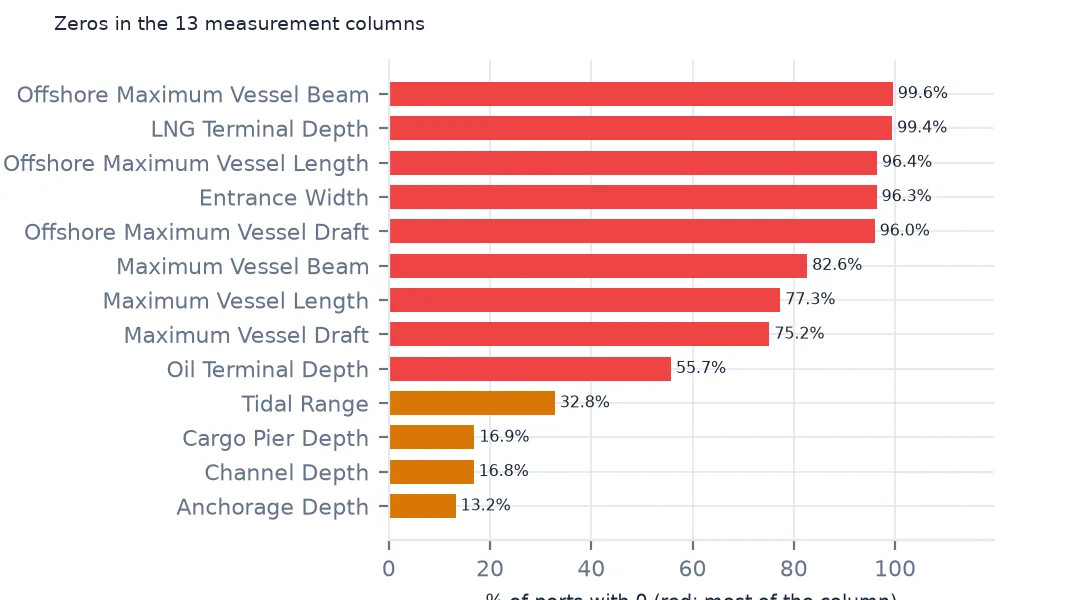
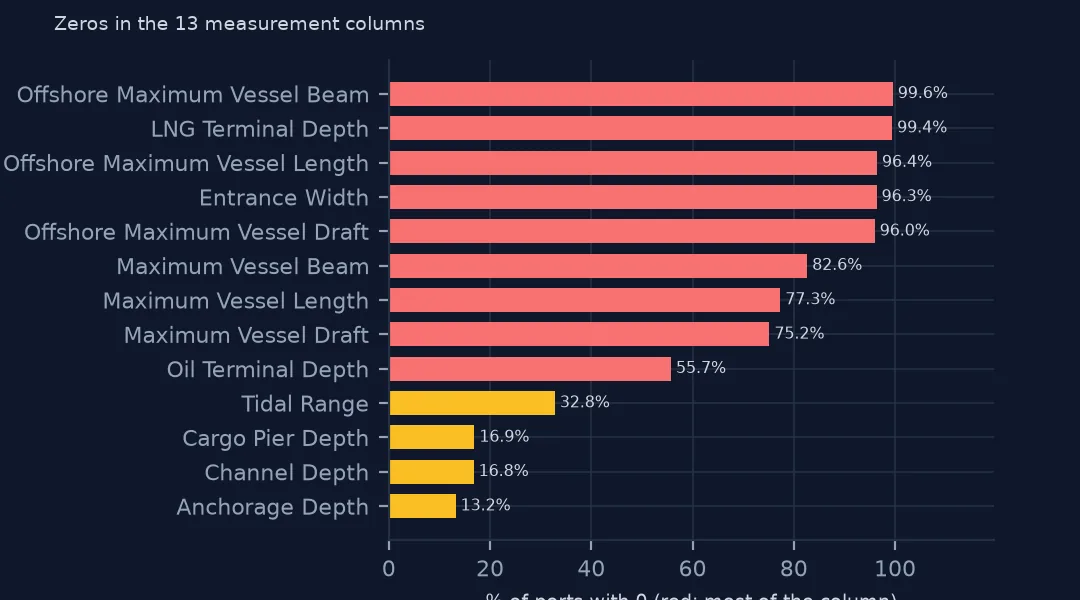
Ask the World Port Index for the median length of ship a port can take and the answer is 0.0 metres. The index writes 0 wherever one of its 13 measurements is unknown, so medians, means and minimums over its columns are pulled towards zero, some a little and some all the way. A tidal range of 0 can be true, in the Mediterranean, the Baltic and the Great Lakes; a vessel length of 0 cannot. This page measures how many zeros each column holds, tells real zeros from missing ones, finds values too large to be true and the duplicated index numbers, and shows how far each statistic moves.
Quick answer
Count the zeros in each measurement column and compare a mean with and without them:
DEPTHS = [c for c in wpi.columns if c.endswith("(m)")]
z = (wpi[DEPTHS] == 0).mean().sort_values(ascending=False)
print(z.round(3).head(6).to_string())
print(f"mean channel depth with zeros: {wpi['Channel Depth (m)'].mean():.2f} m; without: {wpi['Channel Depth (m)'].replace(0, np.nan).mean():.2f} m")
Offshore Maximum Vessel Beam (m) 0.996
Liquified Natural Gas Terminal Depth (m) 0.994
Offshore Maximum Vessel Length (m) 0.964
Entrance Width (m) 0.963
Offshore Maximum Vessel Draft (m) 0.960
Maximum Vessel Beam (m) 0.826
mean channel depth with zeros: 8.52 m; without: 10.24 m
Six of the 13 columns are almost all zeros: the offshore vessel limits, the LNG terminal depth and the entrance width are 0 for 96% to 99.6% of ports, and the maximum vessel beam for 82.6%. The channel depth averages 8.52 m with its zeros and 10.24 m without them, a fifth deeper. Any column summary must drop the zeros first.
Real zeros, impossible values and duplicates
1. A real zero or a missing value?
t = wpi["Tidal Range (m)"]
print(f"tidal range 0: {(t == 0).sum()}; of them in the Mediterranean or Baltic: {wpi.loc[t == 0, 'World Water Body'].str.contains('Mediterranean|Baltic', na=False).mean():.1%}")
print(wpi.loc[t == 0, "World Water Body"].value_counts().head(5).to_dict())
tidal range 0: 1248; of them in the Mediterranean or Baltic: 33.3%
{'Mediterranean Sea; North Atlantic Ocean': 106, 'Baltic Sea; North Atlantic Ocean': 72, 'North Atlantic Ocean': 61, 'Lake Ontario; Great Lakes': 61, 'Norwegian Sea; North Atlantic Ocean': 53}
Tidal range is the column where 0 can be real. 1,248 ports have 0, and a third of them are on the Mediterranean or the Baltic, where tides are a few centimetres, and 61 more on Lake Ontario, with no tide at all. Others, on the North Atlantic and the Norwegian Sea, have real tides recorded as 0. For tide, keep zeros in nearly tideless seas and lakes and treat the rest as missing.
2. Values too large to be true
print(wpi.nlargest(3, "Tidal Range (m)")[["Main Port Name", "Country Code", "Tidal Range (m)"]].to_string(index=False))
print(wpi.loc[wpi["Tidal Range (m)"] >= 12, "Country Code"].value_counts().to_dict())
Main Port Name Country Code Tidal Range (m)
Alliford Bay Canada 16.0
Porpoise Harbor Canada 16.0
Port Simpson Canada 16.0
{'Canada': 8, 'France': 6, 'United Kingdom': 4, 'Argentina': 2, 'Guinea': 1, 'Burma': 1, 'Jersey': 1, 'India': 1, 'Isle of Man': 1, 'Germany': 1}
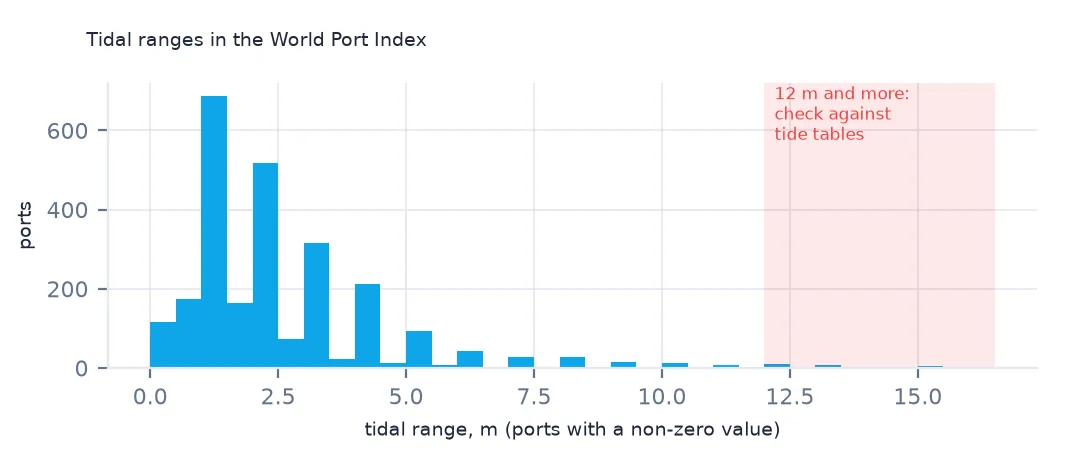
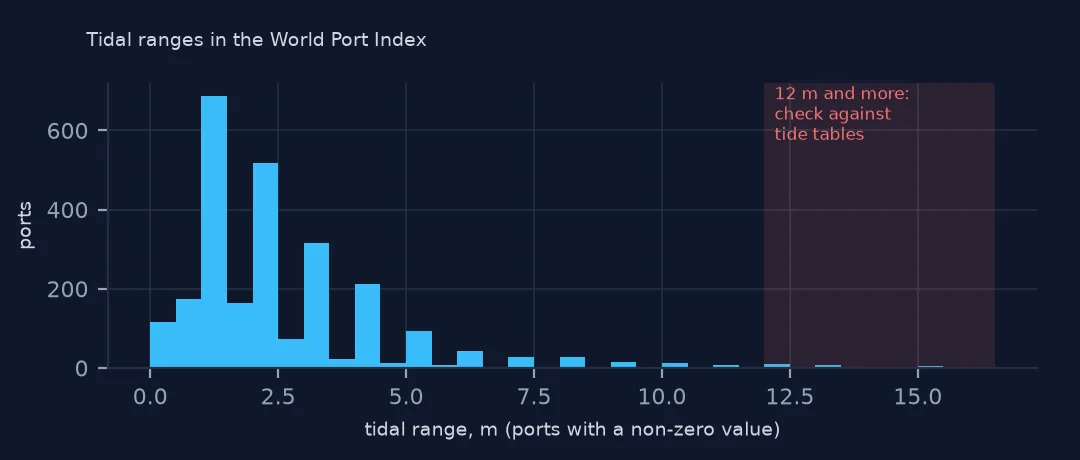
At the other end, some values are too large. Three British Columbia ports, Alliford Bay, Porpoise Harbor and Port Simpson, record a 16 m tidal range, as large as the Bay of Fundy's famous tides, though tides on that coast are well under 10 m, and a German port also records 12 m or more. These look like values entered in feet or for the wrong place, although a few extreme tides, as in India's Gulf of Khambhat, are real. Check extreme values against tide tables before using them.
3. Duplicated index numbers
d = wpi[wpi["World Port Index Number"].duplicated(keep=False)]
print(d[["World Port Index Number", "Main Port Name", "Country Code", "Latitude", "Longitude"]].to_string(index=False))
World Port Index Number Main Port Name Country Code Latitude Longitude
400.0 Seydhisfjordhur Iceland 65.266667 -14.000000
400.0 Seydisfjordur Iceland 65.266667 -14.000000
46135.0 Escravos Oil Terminal Nigeria 5.500000 5.000000
46135.0 Lekki Nigeria 6.423198 4.008242
Two index numbers are used twice. 400 belongs to both "Seydhisfjordhur" and "Seydisfjordur" in Iceland, the same port under two transliterations at the same coordinates, and 46135 to Escravos Oil Terminal and Lekki, two different Nigerian ports far apart. Drop the Icelandic duplicate and give the Nigerian pair separate keys before joining on the number.
A median that changes
The data used on this page
The US National Geospatial-Intelligence Agency's World Port Index (Pub. 150), the CSV served by its Maritime Safety Information site, downloaded on 28 October 2026 and saved on this site, because NGA revises the index as port information changes. A US government publication, free to use. Depths and lengths are in metres.
from pathlib import Path
import zipfile

import geopandas as gpd
import numpy as np
import pandas as pd
import requests

Path("data").mkdir(exist_ok=True)
# NGA's World Port Index (Pub. 150) as CSV, with Natural Earth's populated places, countries and land. Saved
# 28 October 2026: NGA revises the index as port information changes.
# Live: https://msi.nga.mil/api/publications/download?type=view&key=16920959/SFH00000/UpdatedPub150.csv
ARCHIVE = "nga-world-port-index-2026-10-28.zip"
if not Path(f"data/{ARCHIVE}").exists():
    Path(f"data/{ARCHIVE}").write_bytes(requests.get(f"https://data.spatialworkflow.io/{ARCHIVE}", timeout=600).content)
Z = zipfile.ZipFile(f"data/{ARCHIVE}")
for f in ["ne_10m_populated_places_simple.zip", "ne_110m_admin_0_countries.zip", "ne_50m_land.zip"]:
    Path(f"data/{f}").write_bytes(Z.read(f))
wpi = pd.read_csv(Z.open("UpdatedPub150.csv"), encoding="utf-8-sig")
print(f"World Port Index: {len(wpi):,} ports, {wpi.shape[1]} columns")
World Port Index: 3,807 ports, 109 columns
Example 1: a median that changes
for c in ["Channel Depth (m)", "Maximum Vessel Length (m)", "Maximum Vessel Draft (m)"]:
    print(f"{c}: median with zeros {wpi[c].median():.1f}, without {wpi[c].replace(0, np.nan).median():.1f}, recorded for {(wpi[c] > 0).mean():.1%}")
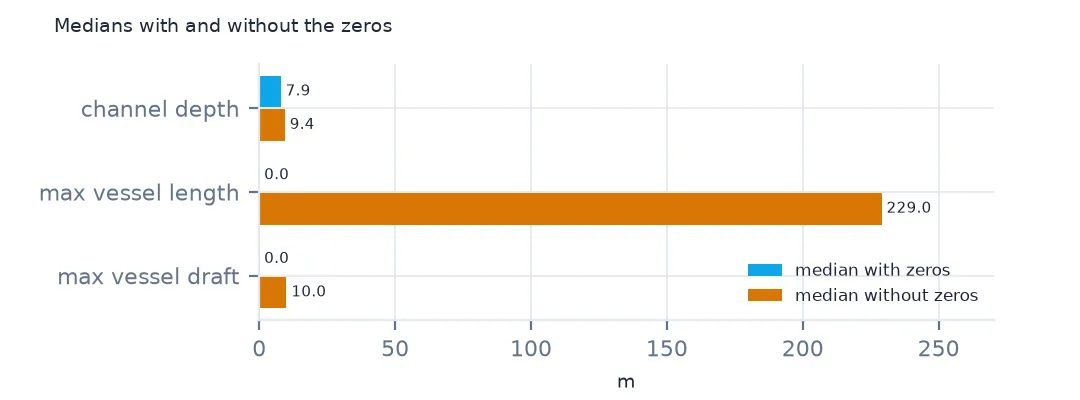
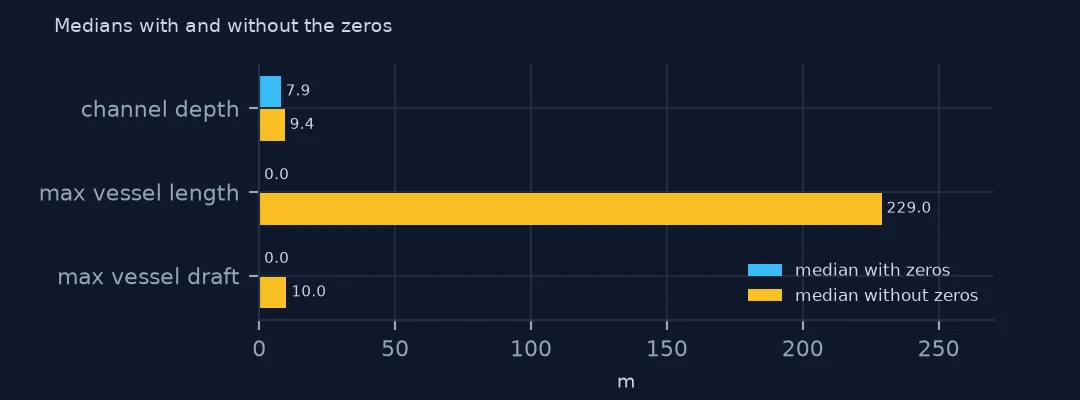
Channel Depth (m): median with zeros 7.9, without 9.4, recorded for 83.2%
Maximum Vessel Length (m): median with zeros 0.0, without 229.0, recorded for 22.7%
Maximum Vessel Draft (m): median with zeros 0.0, without 10.0, recorded for 24.8%
The median channel depth moves from 7.9 m to 9.4 m once zeros are removed. The maximum vessel length and draft have medians of 0.0 with zeros, because they are recorded for only 22.7% and 24.8% of ports; without zeros the medians are 229.0 m and 10.0 m. A median of zero is the clearest sign that a column needs this fix.
Internal links
- Reading the index — where the zeros come from
- Deep-water ports — a filter that needs the zeros removed
- Yes, No and Unknown — the same problem in the flag columns
- Hazard rasters with NoData as zero — the same convention in rasters