
Accumulated Cyclone Energy Explained: Scoring a Hurricane Season
On this page
Problem statement
Counting named storms is a poor measure of a hurricane season. A season of thirty short-lived tropical storms and a season of a dozen long-tracked major hurricanes are very different, and the second does far more damage. Accumulated cyclone energy (ACE) combines the number, strength and duration of storms in one figure: the sum of the squared maximum winds at every six-hourly fix while a storm is at least a tropical storm. This page computes ACE from HURDAT2 for every Atlantic season since 1851. It shows how much of 2025's total came from three storms, and how NOAA turns ACE into "above normal" and "below normal".
Quick answer
For every six-hourly fix (00, 06, 12, 18 UTC) where the status is TS, HU or SS and the wind is at least 35 kt, square the wind in knots, sum, and divide by 10,000. Group by season for season ACE, or by storm ID for a storm's.
ok = hd.synoptic & hd.status.isin(["TS", "HU", "SS"]) & (hd.wind >= 35)
ace = (hd.wind[ok] ** 2).groupby(hd.season[ok]).sum() / 1e4
print(f"ACE 2025: {ace[2025]:.1f}; 2024: {ace[2024]:.1f}; 1991-2020 mean: {ace.loc[1991:2020].mean():.1f}")
ACE 2025: 130.8; 2024: 161.6; 1991-2020 mean: 122.6
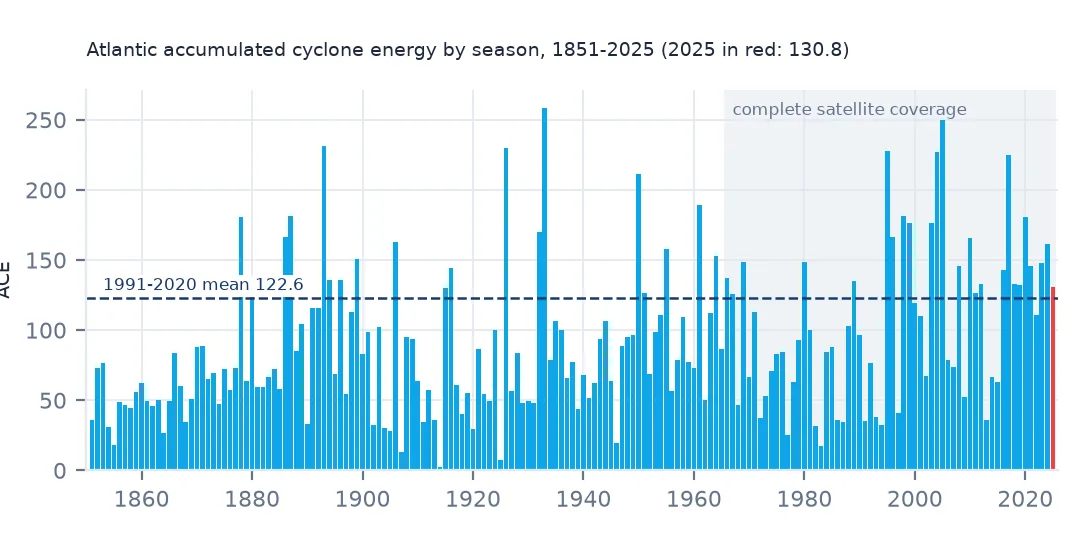
2025's ACE was 130.8, below 2024's 161.6 but above the 1991–2020 mean of 122.6. With only 13 named storms, 2025 had fewer than most recent seasons. Its energy came from a few intense, long-lived hurricanes.
From one fix to a season ranking
1. One fix contributes its wind squared
m = hd[(hd.sid == "AL132025") & ok]
print(f"Melissa: {len(m)} qualifying fixes, peak {m.wind.max():.0f} kt; one 165-kt fix adds {165 ** 2 / 1e4:.4f}, one 35-kt fix {35 ** 2 / 1e4:.4f}")
print(f"Melissa's ACE: {(m.wind ** 2).sum() / 1e4:.1f}")
Melissa: 41 qualifying fixes, peak 165 kt; one 165-kt fix adds 2.7225, one 35-kt fix 0.1225
Melissa's ACE: 34.3
Squaring the wind is what makes ACE an intensity measure. One six-hourly fix at Melissa's 165 kt contributes 2.7225 units, more than twenty times a fix at 35 kt (0.1225). Melissa's 41 qualifying fixes add up to 34.3, about a quarter of the season.
2. Per storm, then per season
per = (hd.wind[ok] ** 2).groupby(hd.sid[ok]).sum() / 1e4
s25 = per[per.index.str.endswith("2025")].sort_values(ascending=False)
print(pd.DataFrame({"name": hd.groupby("sid").name.first().reindex(s25.index), "ace": s25.round(1),
                    "share": (s25 / s25.sum()).round(3)}).to_string())
name ace share
sid
AL132025 MELISSA 34.3 0.262
AL052025 ERIN 31.8 0.243
AL082025 HUMBERTO 26.5 0.203
AL072025 GABRIELLE 18.5 0.141
AL092025 IMELDA 6.0 0.046
AL102025 JERRY 4.2 0.032
AL062025 FERNAND 2.7 0.021
AL042025 DEXTER 2.2 0.016
AL122025 LORENZO 1.7 0.013
AL032025 CHANTAL 1.0 0.007
AL112025 KAREN 0.9 0.007
AL012025 ANDREA 0.6 0.005
AL022025 BARRY 0.4 0.003
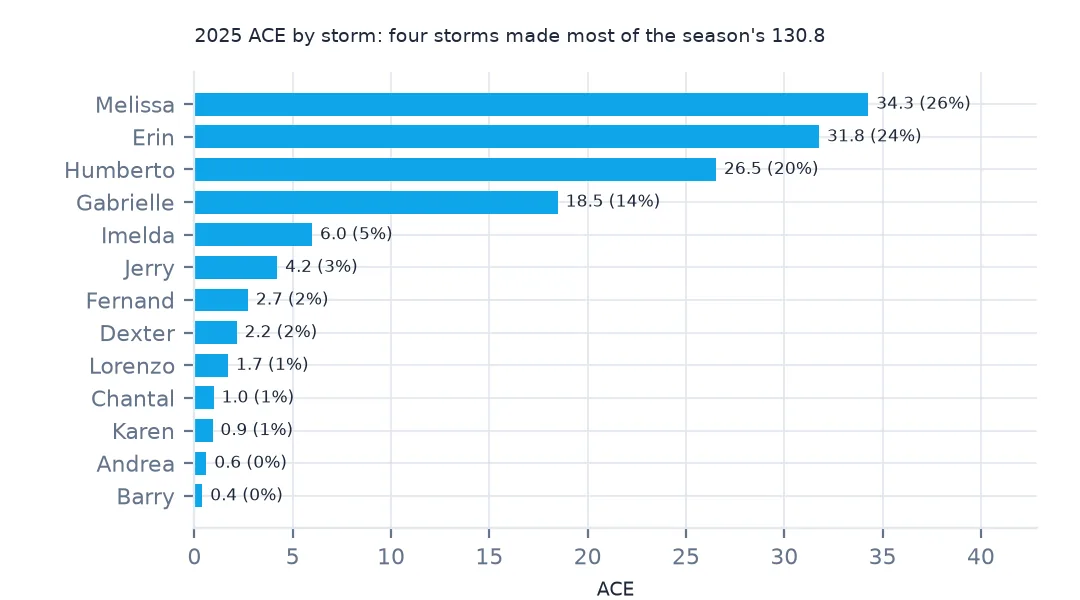
Four storms produced most of 2025's energy: Melissa (26.2%), Erin (24.3%), Humberto (20.3%) and Gabrielle (14.1%). The other nine named storms together made the remaining sixth or so. Barry, Andrea and Karen contributed less than one unit each. A count of named storms treats all thirteen the same, and ACE weights them by strength and duration.
3. Rank the seasons
print("highest:", ace.sort_values(ascending=False).head(6).round(1).to_dict())
print(f"2025 ranks {int(ace.rank(ascending=False)[2025])} of {len(ace)} seasons; since 1950, {int(ace.loc[1950:].rank(ascending=False)[2025])} of {len(ace.loc[1950:])}")
highest: {1933: 258.6, 2005: 250.1, 1893: 231.1, 1926: 229.6, 1995: 227.4, 2004: 226.9}
2025 ranks 40 of 175 seasons; since 1950, 27 of 76
The highest seasons are 1933 (258.6), 2005 (250.1), 1893, 1926, 1995 and 2004. 2025 ranks 40th of 175 seasons, and 27th of the 76 since 1950. Early seasons such as 1893 and 1926 rank high even though storms far out at sea were missed before satellites, so their true ACE was higher still.
4. NOAA's season categories
med = ace.loc[1951:2020].median()
print(f"1951-2020 median {med:.1f}; above-normal threshold (126% of the median) {1.26 * med:.1f}, below-normal (73%) {0.73 * med:.1f}")
lab = pd.cut(ace.loc[1951:], [0, 0.73 * med, 1.26 * med, 1.65 * med, 1e9], labels=["below", "near", "above", "extremely active"])
print(lab.loc[2016:].to_dict())
1951-2020 median 94.9; above-normal threshold (126% of the median) 119.5, below-normal (73%) 69.2
{2016: 'above', 2017: 'extremely active', 2018: 'above', 2019: 'above', 2020: 'extremely active', 2021: 'above', 2022: 'near', 2023: 'above', 2024: 'extremely active', 2025: 'above'}
NOAA classifies seasons by ACE against the 1951–2020 median, here 94.9. A season above 126% of the median (119.5) is above normal, below 73% (69.2) is below normal, and above 165% counts as extremely active. Every season from 2016 to 2025 except 2022 was above normal or extremely active. 2025 was above normal. NOAA's official classification also uses storm counts. This page uses ACE alone.
Storm counts and decades
The data used on this page
The National Hurricane Center's HURDAT2 Atlantic best-track file, 1851–2025.
from pathlib import Path

import geopandas as gpd
import numpy as np
import pandas as pd
import requests

Path("data").mkdir(exist_ok=True)
# NOAA National Hurricane Center HURDAT2 best tracks: Atlantic 1851-2025 (released 23 September 2026) and
# north-east and north-central Pacific 1949-2025 (29 September 2026). NHC keeps every release under its own name.
FILES = ["hurdat2-1851-2025-092326.txt", "hurdat2-nepac-1949-2025-092926.txt"]
for name in FILES:
    if not Path(f"data/{name}").exists():
        Path(f"data/{name}").write_bytes(requests.get(f"https://www.nhc.noaa.gov/data/hurdat/{name}", timeout=300).content)

COLS = ["date", "time", "record", "status", "lat", "lon", "wind", "pressure"] + \
       [f"r{kt}_{q}" for kt in (34, 50, 64) for q in ("ne", "se", "sw", "nw")] + ["rmw"]


def read_hurdat2(path):
    """One header line per storm (id, name, number of fixes), then one line per fix; -999 means missing."""
    rows = []
    for line in open(path):
        f = [x.strip() for x in line.split(",")]
        if f[0][:2].isalpha():
            sid, name = f[0], f[1]
            continue
        rows.append([sid, name] + f[:21])
    h = pd.DataFrame(rows, columns=["sid", "name"] + COLS)
    h["time"] = pd.to_datetime(h.date + h.time, format="%Y%m%d%H%M")
    h["lat"] = h.lat.str[:-1].astype(float) * np.where(h.lat.str[-1] == "S", -1, 1)
    h["lon"] = h.lon.str[:-1].astype(float) * np.where(h.lon.str[-1] == "W", -1, 1)
    for c in COLS[6:]:
        h[c] = pd.to_numeric(h[c]).replace(-999, np.nan)
    h["season"] = h.sid.str[-4:].astype(int)
    h["synoptic"] = h.time.dt.strftime("%H%M").isin(["0000", "0600", "1200", "1800"])
    return h.drop(columns="date")


hd = read_hurdat2("data/hurdat2-1851-2025-092326.txt")
print(f"HURDAT2 Atlantic: {hd.sid.nunique():,} storms, {len(hd):,} fixes, {hd.season.min()}-{hd.season.max()}")
HURDAT2 Atlantic: 1,988 storms, 55,524 fixes, 1851-2025
Example 1: ACE against the number of storms
named = hd[ok].groupby("season").sid.nunique()
both = pd.DataFrame({"ace": ace, "storms": named}).loc[1966:]
print(f"1966-2025: correlation of ACE with named-storm count {both.ace.corr(both.storms):.2f}")
print(both.assign(ace_per_storm=both.ace / both.storms).loc[[2005, 2020, 2024, 2025]].round(1).to_string())
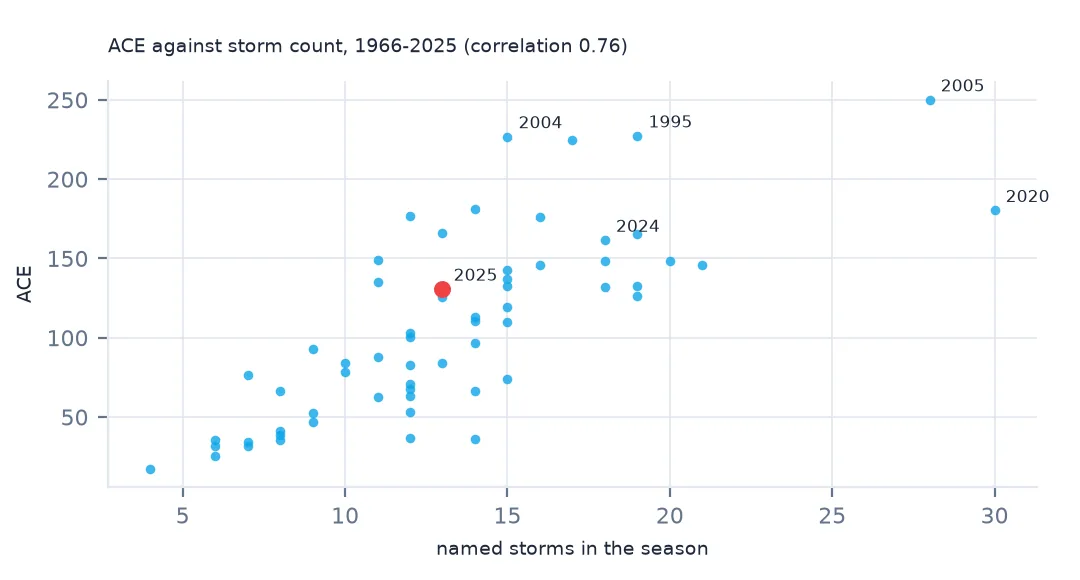
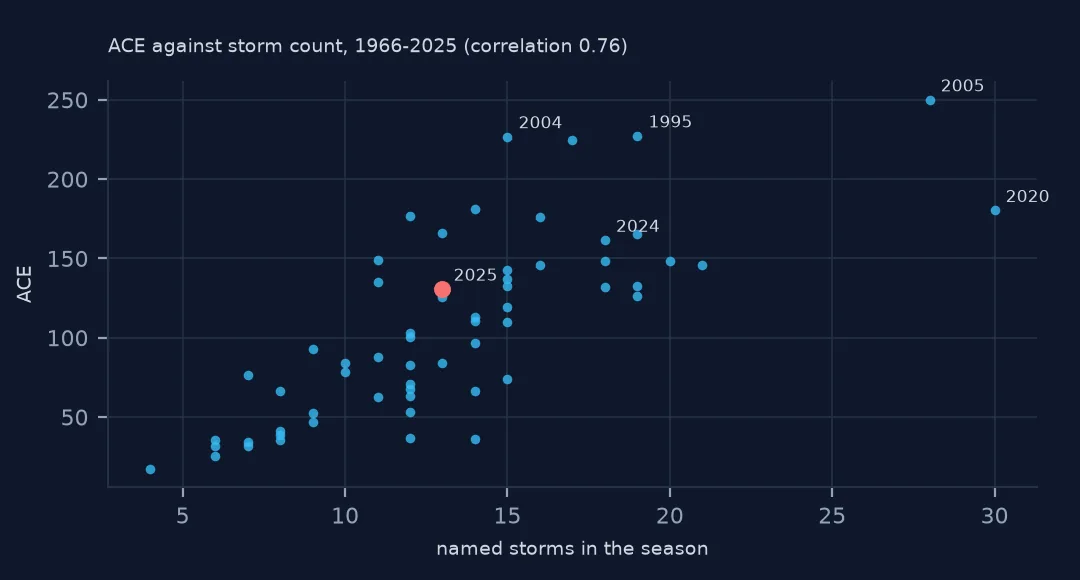
1966-2025: correlation of ACE with named-storm count 0.76
ace storms ace_per_storm
season
2005 250.1 28 8.9
2020 180.4 30 6.0
2024 161.6 18 9.0
2025 130.8 13 10.1
Since 1966, when satellite coverage became complete, ACE and the number of named storms are correlated at 0.76. They often go together, but not always. 2020 had a record 30 named storms but only 6.0 units of ACE per storm, many of them short and weak. 2025 had 13 storms and 10.1 per storm, the most intense mix of the four seasons shown.
Example 2: decades
dec = ace.groupby(ace.index // 10 * 10).mean()
print(dec.loc[1950:].round(1).to_dict())
{1950: 109.6, 1960: 112.1, 1970: 68.9, 1980: 77.8, 1990: 107.1, 2000: 130.1, 2010: 122.2, 2020: 146.2}
By decade, mean ACE fell from 112.1 in the 1960s to 68.9 in the 1970s and 77.8 in the 1980s, then rose to 130.1 in the 2000s and 146.2 so far in the 2020s. This multi-decade swing matches the Atlantic's alternating warm and cool phases. A trend line fitted from the 1970s overstates the long-term rise.
Why the wind is squared
ACE was introduced by NOAA's Climate Prediction Center in the late 1990s, based on an earlier hurricane destruction potential index, as a single measure of seasonal activity. Kinetic energy is proportional to the square of wind speed, so squaring rewards intensity, and summing every six hours rewards duration. The 35-kt threshold and the tropical or subtropical status restrict the sum to named storms, and the division by 10,000 keeps the numbers readable.
ACE does not account for a storm's size (a huge category 1 and a tiny one score the same), nor for landfall. It is a measure of the season's activity over the ocean, not of damage. For impacts, landfalls and wind fields are the better measures.
Conventions that change the number
- Only synoptic fixes. Landfall and other extra fixes between the six-hourly ones inflate ACE: including them adds several units to 2025's 130.8.
- By season, not by calendar year. A December storm that runs into January belongs to its season. Grouping by the fix's year moves Zeta's energy out of 2005.
- Status. Extratropical stages add energy if the status filter is left out.
- Subtropical storms (
SS) are included by NOAA; check before comparing with a published series that leaves them out.
Internal links
- ACE comes out too high — the fixes to leave out
- Hurricane counts before satellites — why early ACE is low
- How to map a hurricane season's tracks — the 2025 season drawn
FAQ
How do you calculate accumulated cyclone energy?
Sum the squares of the maximum sustained wind in knots at each six-hourly fix while the storm is a tropical or subtropical storm of at least 35 kt, then divide by 10,000.
What was the ACE of the 2025 Atlantic hurricane season?
130.8 from the HURDAT2 release of September 2026, above the 1991–2020 mean of 122.6. Melissa contributed 34.3 of it.