
How to Find Rapid Intensification in Hurricane Best Tracks
On this page
Problem statement
Rapid intensification, a hurricane strengthening by 30 kt or more in 24 hours, is what turns a manageable forecast into a disaster: Milton in 2024, Erin and Melissa in 2025. Finding it in HURDAT2 is a windowed difference on each storm's track, but the details matter. Extra landfall fixes break a simple shift by four rows. Overlapping windows count one burst of strengthening many times. And before aircraft and satellites the winds were too coarse to see it at all. This page finds every rapid-intensification episode in the Atlantic record, ranks the largest, and counts them since 1980.
Quick answer
Keep the synoptic fixes, index by time, and for each storm subtract the wind 24 hours earlier using a time-based shift (shift(freq="24h")), not a row shift. Flag differences of 30 kt or more while the storm is a tropical storm or hurricane, and merge consecutive flagged fixes into episodes.
syn = hd[hd.synoptic].set_index("time")
d24 = syn.groupby("sid").wind.transform(lambda w: w - w.shift(freq="24h").reindex(w.index))
syn["d24"] = d24
ri = syn[(syn.d24 >= 30) & syn.status.isin(["TS", "HU"])]
print(f"24-hour periods with an increase of 30 kt or more: {len(ri):,} in {ri.sid.nunique()} storms; largest {syn.d24.max():.0f} kt")
24-hour periods with an increase of 30 kt or more: 1,691 in 507 storms; largest 95 kt
1,691 six-hourly fixes in 507 storms end a 24-hour period with a gain of 30 kt or more. The largest is 95 kt in 24 hours.
Windows, episodes and the reliable era
1. Compare each fix with the fix 24 hours earlier
e = syn[syn.sid == "AL052025"][["wind", "pressure", "d24"]]
print(e.loc["2025-08-15 00:00":"2025-08-17 00:00"].to_string())
wind pressure d24
time
2025-08-15 00:00:00 60 997.0 15.0
2025-08-15 06:00:00 60 997.0 15.0
2025-08-15 12:00:00 65 996.0 15.0
2025-08-15 18:00:00 65 993.0 10.0
2025-08-16 00:00:00 75 981.0 15.0
2025-08-16 06:00:00 95 967.0 35.0
2025-08-16 12:00:00 130 934.0 65.0
2025-08-16 18:00:00 140 913.0 75.0
2025-08-17 00:00:00 125 934.0 50.0
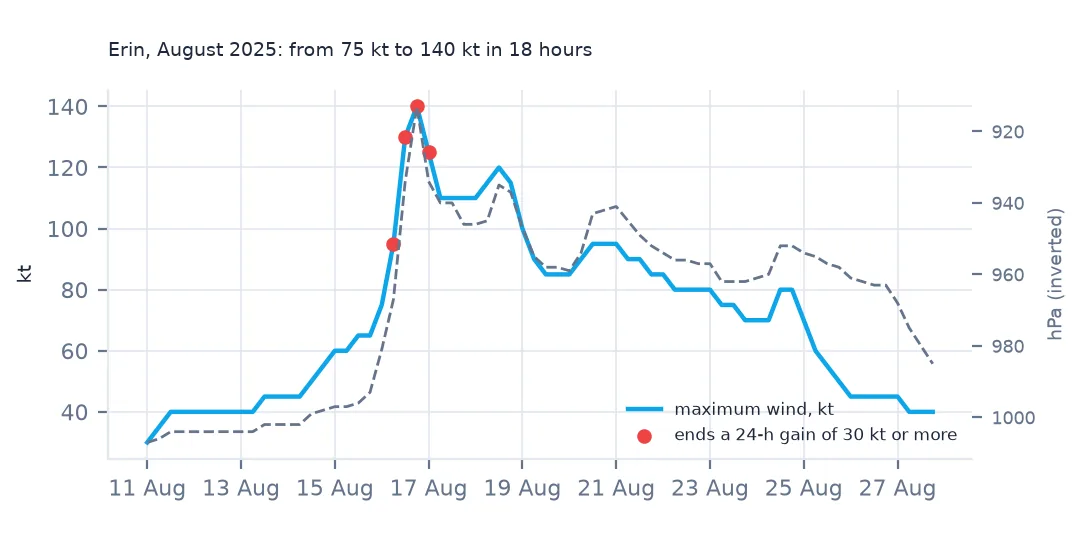
Erin shows what the column measures. On 15 August it gained 10–15 kt a day. Then from 00:00 on 16 August its wind rose from 75 to 140 kt in 18 hours, and the 24-hour gains reach 65 and then 75 kt as the window slides over the burst. Pressure fell from 981 to 913 hPa. Each of those rows is a 24-hour window, and they overlap.
2. Count events, not overlapping windows
ri = ri.reset_index().sort_values(["sid", "time"])
new = ri.groupby("sid").time.diff().ne(pd.Timedelta("6h"))
ri["event"] = new.cumsum()
ev_ = ri.groupby("event").agg(sid=("sid", "first"), name=("name", "first"), start=("time", "min"), peak_gain=("d24", "max"))
print(f"RI windows: {len(ri):,}; separate RI episodes: {len(ev_):,}")
print(ev_.sort_values("peak_gain", ascending=False).head(6).to_string(index=False))
RI windows: 1,691; separate RI episodes: 605
sid name start peak_gain
AL252005 WILMA 2005-10-18 18:00:00 95.0
AL062007 FELIX 2007-09-01 18:00:00 85.0
AL142024 MILTON 2024-10-06 18:00:00 80.0
AL052025 ERIN 2025-08-16 06:00:00 75.0
AL142016 MATTHEW 2016-09-30 06:00:00 75.0
AL132023 LEE 2023-09-07 18:00:00 70.0
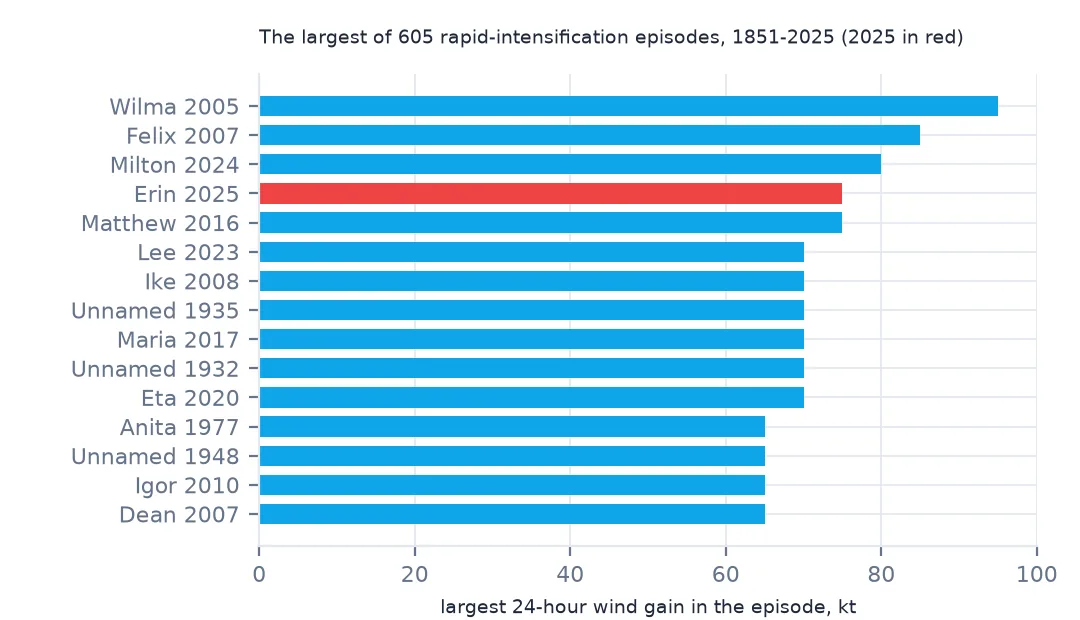
Merging consecutive windows turns 1,691 into 605 separate episodes. Wilma in October 2005 holds the record, 95 kt in 24 hours, followed by Felix 2007 (85 kt) and Milton 2024 (80 kt). Erin 2025 ties Matthew 2016 at 75 kt, the fourth-largest burst on record.
3. Since 1980 only
since = ev_[ev_.start.dt.year >= 1980]
per_year = since.groupby(since.start.dt.year).sid.nunique().reindex(range(1980, 2026), fill_value=0)
print("storms with RI per year, by decade (mean):", per_year.groupby(per_year.index // 10 * 10).mean().round(1).to_dict())
storms with RI per year, by decade (mean): {1980: 3.5, 1990: 4.9, 2000: 5.4, 2010: 4.5, 2020: 5.8}
Since 1980, the average number of storms with at least one rapid-intensification episode rose from 3.5 a year in the 1980s to 5.4 in the 2000s and 5.8 in the 2020s so far. Some of that rise is real. Some comes from better observation: more aircraft fixes, microwave satellite imagery and scatterometers make bursts easier to detect and time.
4. Which hurricanes became major through RI
peak = hd.groupby("sid").wind.max()
major = peak[(peak >= 100) & (peak.index.str[-4:].astype(int) >= 1980)]
print(f"major hurricanes since 1980: {len(major)}; with at least one RI episode: {major.index.isin(since.sid).mean():.0%}")
major hurricanes since 1980: 134; with at least one RI episode: 90%
90% of the 134 major hurricanes since 1980 went through at least one rapid-intensification episode. Becoming a major hurricane almost always involves a burst of rapid strengthening, which is why forecasting it matters so much.
Where rapid intensification happens, and 2025
The data used on this page
The National Hurricane Center's HURDAT2 Atlantic best-track file, 1851–2025.
from pathlib import Path

import geopandas as gpd
import numpy as np
import pandas as pd
import requests

Path("data").mkdir(exist_ok=True)
# NOAA National Hurricane Center HURDAT2 best tracks: Atlantic 1851-2025 (released 23 September 2026) and
# north-east and north-central Pacific 1949-2025 (29 September 2026). NHC keeps every release under its own name.
FILES = ["hurdat2-1851-2025-092326.txt", "hurdat2-nepac-1949-2025-092926.txt"]
for name in FILES:
    if not Path(f"data/{name}").exists():
        Path(f"data/{name}").write_bytes(requests.get(f"https://www.nhc.noaa.gov/data/hurdat/{name}", timeout=300).content)

COLS = ["date", "time", "record", "status", "lat", "lon", "wind", "pressure"] + \
       [f"r{kt}_{q}" for kt in (34, 50, 64) for q in ("ne", "se", "sw", "nw")] + ["rmw"]


def read_hurdat2(path):
    """One header line per storm (id, name, number of fixes), then one line per fix; -999 means missing."""
    rows = []
    for line in open(path):
        f = [x.strip() for x in line.split(",")]
        if f[0][:2].isalpha():
            sid, name = f[0], f[1]
            continue
        rows.append([sid, name] + f[:21])
    h = pd.DataFrame(rows, columns=["sid", "name"] + COLS)
    h["time"] = pd.to_datetime(h.date + h.time, format="%Y%m%d%H%M")
    h["lat"] = h.lat.str[:-1].astype(float) * np.where(h.lat.str[-1] == "S", -1, 1)
    h["lon"] = h.lon.str[:-1].astype(float) * np.where(h.lon.str[-1] == "W", -1, 1)
    for c in COLS[6:]:
        h[c] = pd.to_numeric(h[c]).replace(-999, np.nan)
    h["season"] = h.sid.str[-4:].astype(int)
    h["synoptic"] = h.time.dt.strftime("%H%M").isin(["0000", "0600", "1200", "1800"])
    return h.drop(columns="date")


hd = read_hurdat2("data/hurdat2-1851-2025-092326.txt")
print(f"HURDAT2 Atlantic: {hd.sid.nunique():,} storms, {len(hd):,} fixes, {hd.season.min()}-{hd.season.max()}")
HURDAT2 Atlantic: 1,988 storms, 55,524 fixes, 1851-2025
Example 1: where it happens
pts = syn[syn.d24 >= 30].reset_index()
pts = pts[pts.time.dt.year >= 1980]
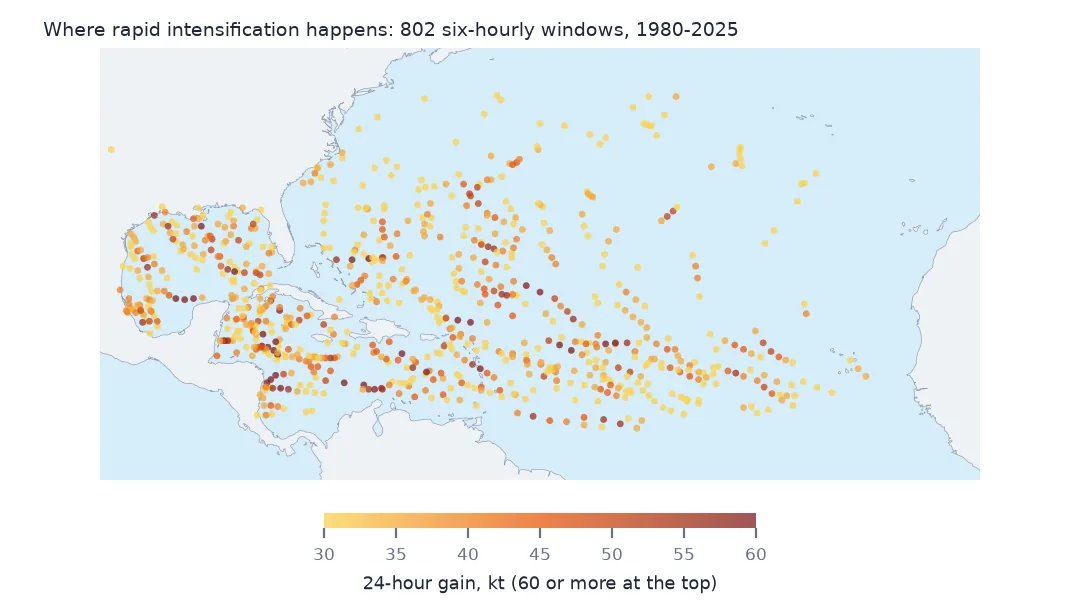
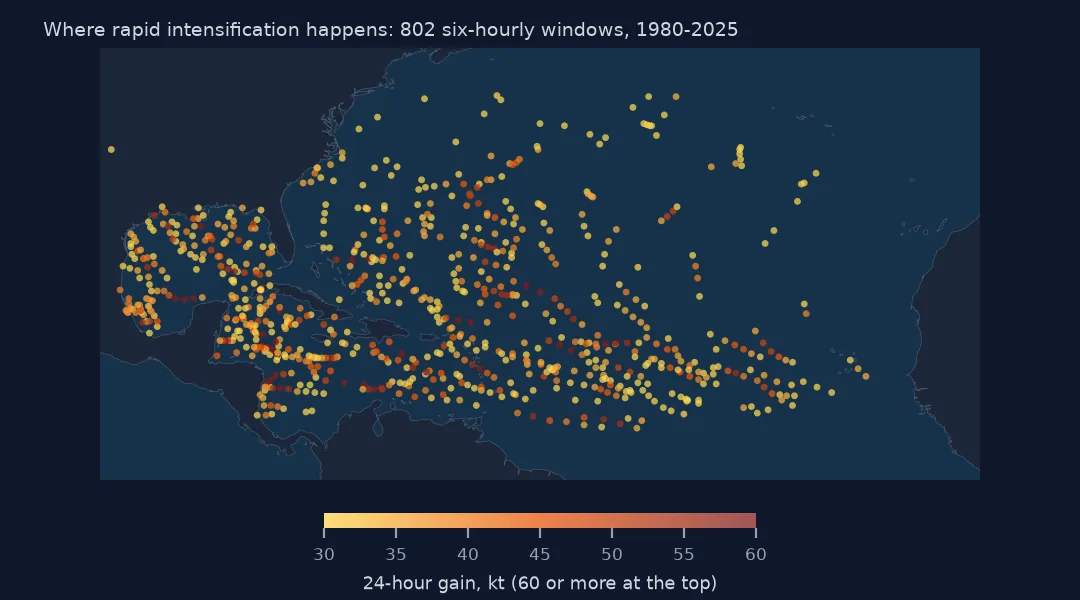
print("RI windows by region:", pd.cut(pts.lon, [-100, -80, -60, -40, 0], labels=["Gulf/W Caribbean", "Caribbean/Bahamas", "central Atlantic", "eastern Atlantic"]).value_counts().to_dict())
print(f"median latitude {pts.lat.median():.1f}N")
RI windows by region: {'Caribbean/Bahamas': 260, 'Gulf/W Caribbean': 248, 'central Atlantic': 221, 'eastern Atlantic': 73}
median latitude 20.4N
Since 1980, the Caribbean and Bahamas (260 windows) and the Gulf and western Caribbean (248) see the most rapid intensification, ahead of the central Atlantic (221). The eastern Atlantic, where storms are young and waters cooler, has 73. The median latitude is 20.4°N. Warm, deep water near land is where rapid intensification is both most common and most dangerous.
Example 2: 2025
print(ev_[ev_.start.dt.year == 2025][["name", "start", "peak_gain"]].to_string(index=False)) name start peak_gain
ERIN 2025-08-16 06:00:00 75.0
GABRIELLE 2025-09-22 12:00:00 50.0
HUMBERTO 2025-09-26 12:00:00 55.0
MELISSA 2025-10-26 00:00:00 55.0
2025 had four storms with an episode: Erin (75 kt), Humberto and Melissa (55 kt each) and Gabrielle (50 kt). All four became major hurricanes, and three of them category 5.
Why 30 knots in 24 hours
The threshold comes from Kaplan and DeMaria's 2003 study of Atlantic storms, where a 30-kt rise in 24 hours marked the top 5% of intensity changes. NHC uses it in its forecasts and verification, and SHIPS-RII, the statistical model that predicts the chance of rapid intensification, is built on it. Variants exist (25 kt, 35 kt, 40 kt, or 20 kt in 12 hours), so state the threshold you use.
Physically, rapid intensification needs warm, deep ocean water, low vertical wind shear and a moist mid-troposphere. When all three are present, a well-organised inner core can contract and spin up within hours. It is hard to forecast because the inner-core processes are small compared with what models resolve and what satellites can measure.
Pitfalls
- Row shifts.
shift(4)assumes four rows per day; extra landfall rows break that. Shift by time on synoptic fixes. - Gaps. A storm that dissipates and regenerates has missing fixes; the time-based shift leaves those windows NaN rather than comparing across the gap.
- Over land. Rapid weakening over land is the mirror image. Filter on status if you also look for drops.
- The pre-1980 record has winds rounded to 10 kt and few aircraft, so episodes are undercounted and their timing uncertain.
Internal links
- How to read HURDAT2 — synoptic and extra fixes
- How to map a hurricane season's tracks — the 2025 tracks
- How to map a hurricane track from IBTrACS — rapid intensification for one storm
FAQ
What is rapid intensification of a hurricane?
An increase in maximum sustained wind of at least 30 kt in 24 hours. In the Atlantic best track there are 605 such episodes since 1851.
Which hurricane intensified fastest?
Wilma in October 2005, with a gain of 95 kt in 24 hours in HURDAT2, ahead of Felix in 2007 (85 kt) and Milton in 2024 (80 kt).