
How to Count US Hurricane Landfalls by State and Category
On this page
Problem statement
Which US states are hit by hurricanes most often, and how strong were the hurricanes when they came ashore? HURDAT2 marks every landfall with an L record that gives the time, position and intensity. But the records are not tagged with a country or state, a hurricane can make several landfalls, and many landfalls are in the Caribbean, Mexico or Canada. This page selects the hurricane-strength landfalls, assigns each to the nearest US state, counts them by state and category since 1851, and separates landfalls from landfalling hurricanes.
Quick answer
Take fixes with record == "L" and status == "HU". Join them to US state polygons with sjoin_nearest and a maximum distance, because landfall points sit on the coastline and the simplified boundaries do not always contain them. Classify the wind into Saffir–Simpson categories, then count by state, or keep each storm's first US landfall when counting hurricanes.
lower48 = states[~states.STUSPS.isin(["AK", "HI", "PR", "GU", "VI", "MP", "AS"])].to_crs(5070)
lf = hd[(hd.record == "L") & (hd.status == "HU")].copy()
pts = gpd.GeoDataFrame(lf, geometry=gpd.points_from_xy(lf.lon, lf.lat), crs=4326).to_crs(5070)
near = gpd.sjoin_nearest(pts, lower48[["STUSPS", "geometry"]], max_distance=50_000, distance_col="m")
near = near[~near.index.duplicated()]
print(f"hurricane landfall records: {len(lf):,}; within 50 km of the lower 48: {len(near):,} by {near.sid.nunique()} hurricanes")
hurricane landfall records: 620; within 50 km of the lower 48: 367 by 290 hurricanes
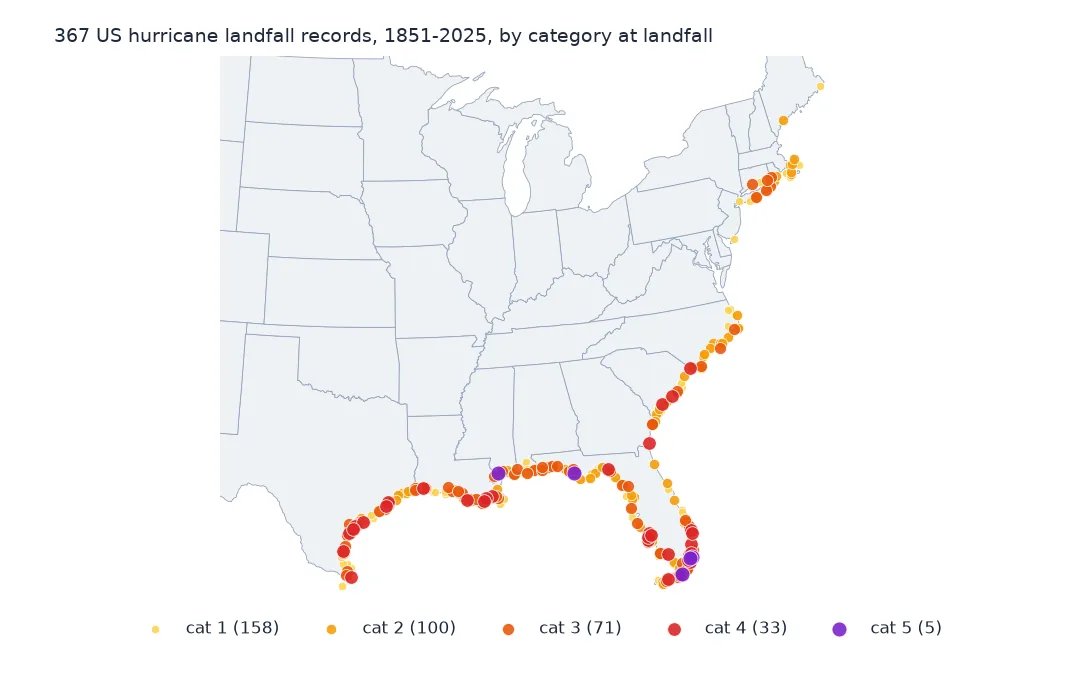
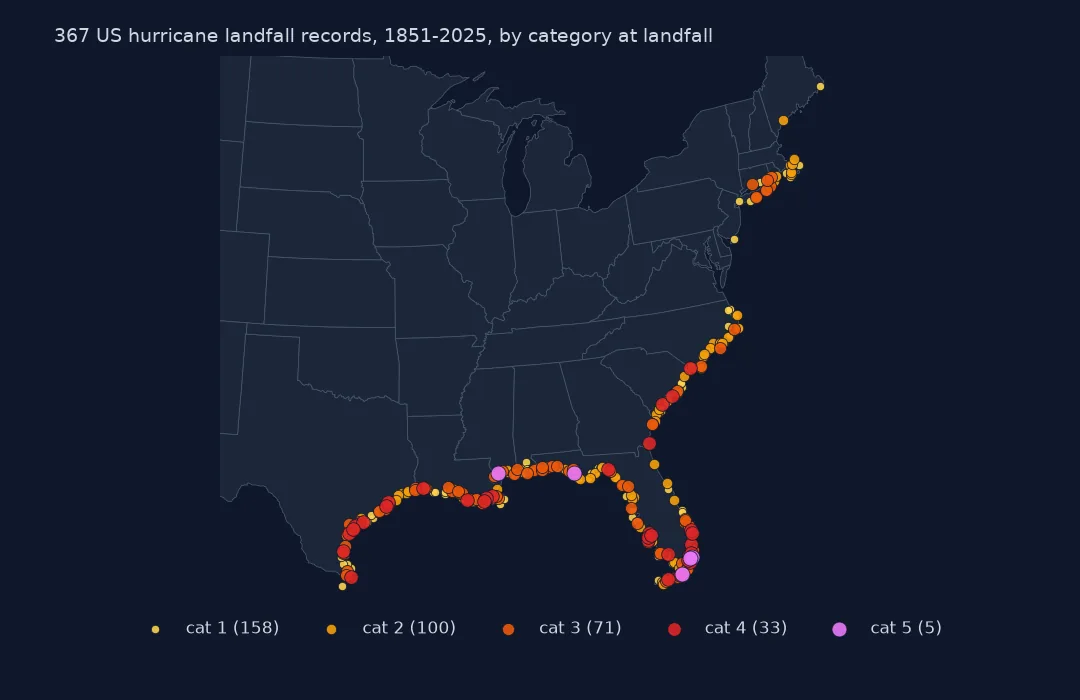
Of 620 hurricane landfall records since 1851, 367 lie within 50 km of the lower 48 states. They were made by 290 hurricanes.
From landfall records to state counts
1. Landfall records
L = hd[hd.record == "L"]
print(f"'L' records: {len(L):,}; by status: {L.status.value_counts().to_dict()}")
print(f"landfall fixes at a synoptic hour: {L.synoptic.mean():.1%}")
'L' records: 1,213; by status: {'HU': 620, 'TS': 535, 'TD': 43, 'EX': 7, 'SS': 7, 'SD': 1}
landfall fixes at a synoptic hour: 16.4%
There are 1,213 landfall records. 620 are at hurricane strength, 535 tropical storm, and the rest depressions, subtropical or extratropical systems. Only 16.4% fall exactly on a synoptic hour. Most landfall fixes are extra rows added at the time the centre crossed the coast.
2. Assign the state
print(f"distance to the nearest state, km: median {near.m.median() / 1000:.1f}, 90th percentile {near.m.quantile(0.9) / 1000:.1f}")
print(f"landfalls further than 50 km from any state (Caribbean, Mexico, Canada, Bahamas): {len(lf) - len(near):,}")
distance to the nearest state, km: median 0.0, 90th percentile 4.9
landfalls further than 50 km from any state (Caribbean, Mexico, Canada, Bahamas): 253
Half of the US landfall points fall inside a state polygon (median distance 0.0 km) and 90% within 4.9 km. The 50 km limit catches points on barrier islands and in bays without reaching across to the Bahamas or Cuba. 253 hurricane landfalls are further from any state: the Caribbean, Mexico, Central America, Bermuda and Atlantic Canada.
3. Category at landfall
near["cat"] = pd.cut(near.wind, [63, 82, 95, 112, 136, 200], labels=[1, 2, 3, 4, 5]).astype(int)
t = pd.crosstab(near.STUSPS, near.cat, margins=True, margins_name="all").sort_values("all", ascending=False)
print(t.head(9).to_string())
cat 1 2 3 4 5 all
STUSPS
all 158 100 71 33 5 367
FL 49 37 27 15 4 132
TX 27 12 11 9 0 59
LA 21 13 16 5 0 55
NC 21 15 3 0 0 39
SC 16 6 1 3 0 26
AL 8 1 2 0 0 11
MS 4 3 3 0 1 11
NY 5 2 3 0 0 10
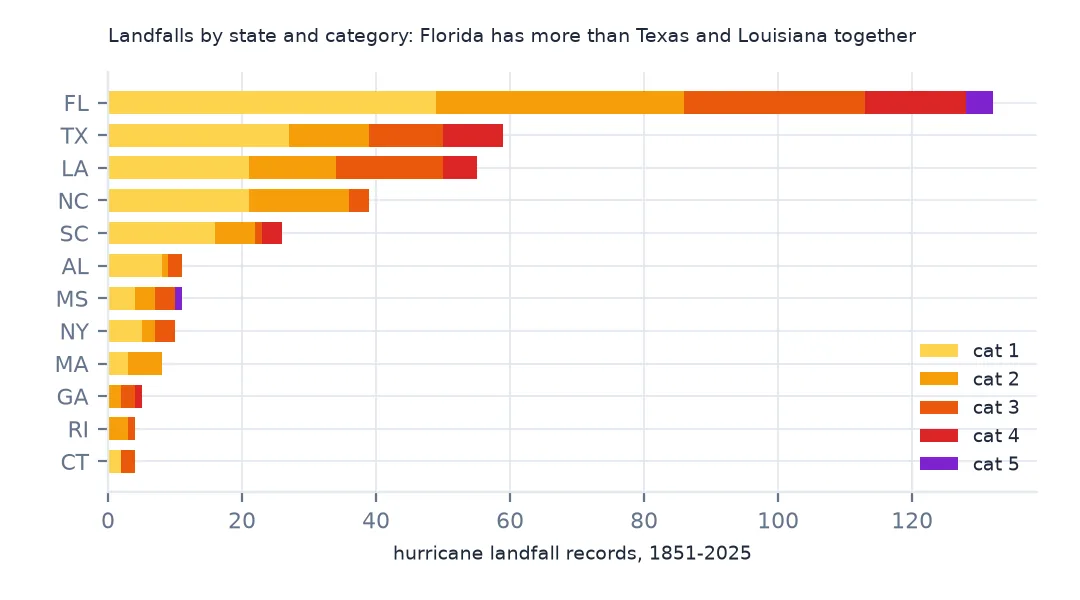
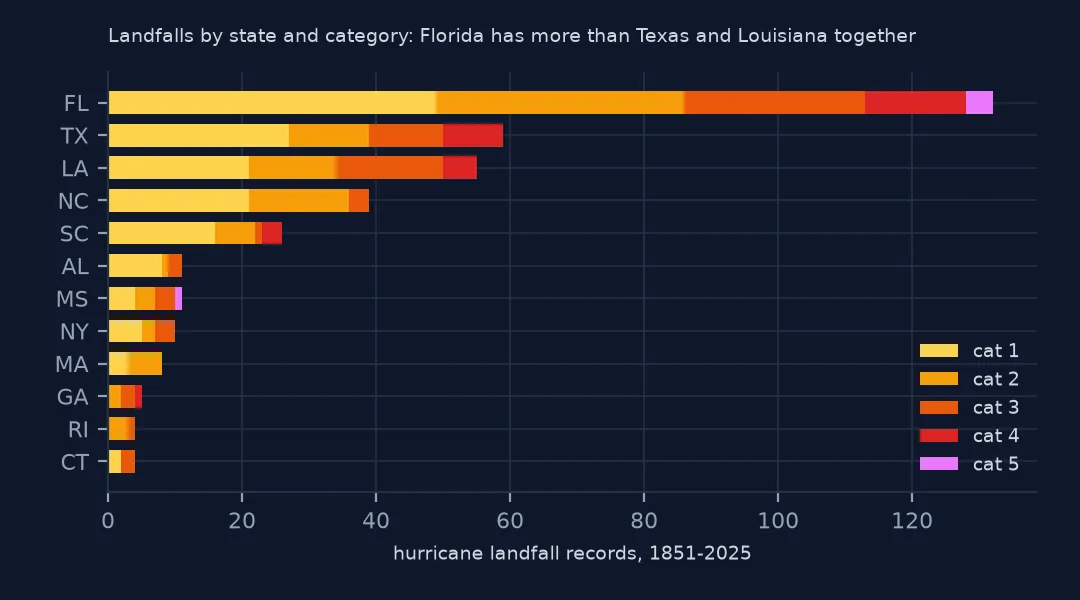
Florida has 132 hurricane landfall records, more than Texas (59) and Louisiana (55) together, and 4 of the 5 category-5 landfalls. North Carolina's 39 are mostly category 1 and 2 on the Outer Banks. New York's 10 are a reminder that the Northeast is not immune, including three at category 3.
4. Hurricanes, not landfalls
per_storm = near.groupby("sid").size()
print(f"hurricanes with more than one US landfall record: {(per_storm > 1).sum()}; most: {per_storm.max()} "
      f"({hd.loc[hd.sid == per_storm.idxmax(), 'name'].iloc[0]} {per_storm.idxmax()[-4:]})")
first = near.sort_values("time").drop_duplicates("sid")
print(f"US landfalling hurricanes 1851-2025: {len(first)}; major (category 3+) at first landfall: {(first.cat >= 3).sum()}")
hurricanes with more than one US landfall record: 62; most: 5 (DONNA 1960)
US landfalling hurricanes 1851-2025: 290; major (category 3+) at first landfall: 91
62 hurricanes have more than one US landfall record. Donna in 1960 has five, crossing the Florida Keys and south-west Florida and then North Carolina, New York and New England. Counting each hurricane once at its first US landfall gives 290 landfalling hurricanes since 1851, 91 of them major (category 3 or higher) at first landfall.
Decades and the strongest landfalls
The data used on this page
The National Hurricane Center's HURDAT2 Atlantic best-track file, 1851–2025, and Census Bureau 2023 state boundaries.
from pathlib import Path

import geopandas as gpd
import numpy as np
import pandas as pd
import requests

Path("data").mkdir(exist_ok=True)
# NOAA National Hurricane Center HURDAT2 best tracks: Atlantic 1851-2025 (released 23 September 2026) and
# north-east and north-central Pacific 1949-2025 (29 September 2026). NHC keeps every release under its own name.
FILES = ["hurdat2-1851-2025-092326.txt", "hurdat2-nepac-1949-2025-092926.txt"]
for name in FILES:
    if not Path(f"data/{name}").exists():
        Path(f"data/{name}").write_bytes(requests.get(f"https://www.nhc.noaa.gov/data/hurdat/{name}", timeout=300).content)

COLS = ["date", "time", "record", "status", "lat", "lon", "wind", "pressure"] + \
       [f"r{kt}_{q}" for kt in (34, 50, 64) for q in ("ne", "se", "sw", "nw")] + ["rmw"]


def read_hurdat2(path):
    """One header line per storm (id, name, number of fixes), then one line per fix; -999 means missing."""
    rows = []
    for line in open(path):
        f = [x.strip() for x in line.split(",")]
        if f[0][:2].isalpha():
            sid, name = f[0], f[1]
            continue
        rows.append([sid, name] + f[:21])
    h = pd.DataFrame(rows, columns=["sid", "name"] + COLS)
    h["time"] = pd.to_datetime(h.date + h.time, format="%Y%m%d%H%M")
    h["lat"] = h.lat.str[:-1].astype(float) * np.where(h.lat.str[-1] == "S", -1, 1)
    h["lon"] = h.lon.str[:-1].astype(float) * np.where(h.lon.str[-1] == "W", -1, 1)
    for c in COLS[6:]:
        h[c] = pd.to_numeric(h[c]).replace(-999, np.nan)
    h["season"] = h.sid.str[-4:].astype(int)
    h["synoptic"] = h.time.dt.strftime("%H%M").isin(["0000", "0600", "1200", "1800"])
    return h.drop(columns="date")


hd = read_hurdat2("data/hurdat2-1851-2025-092326.txt")
if not Path("data/cb_2023_us_state_20m.zip").exists():
    Path("data/cb_2023_us_state_20m.zip").write_bytes(requests.get("https://www2.census.gov/geo/tiger/GENZ2023/shp/cb_2023_us_state_20m.zip", timeout=300).content)
states = gpd.read_file("data/cb_2023_us_state_20m.zip").to_crs(4326)
print(f"HURDAT2 Atlantic: {hd.sid.nunique():,} storms, {len(hd):,} fixes, {hd.season.min()}-{hd.season.max()}")
HURDAT2 Atlantic: 1,988 storms, 55,524 fixes, 1851-2025
Example 1: by decade
dec = first.groupby(first.season // 10 * 10).agg(hurricanes=("sid", "size"), major=("cat", lambda c: (c >= 3).sum()))
print(dec.T.to_string())
print(f"seasons since 1851 with no US hurricane landfall: {175 - first.season.nunique()}; 2025 had {(first.season == 2025).sum()}")
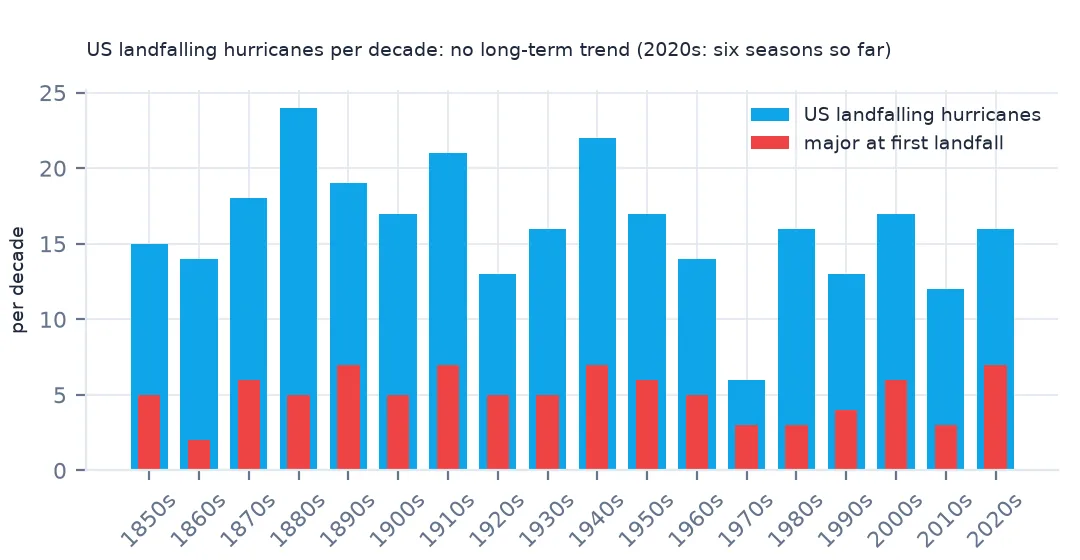
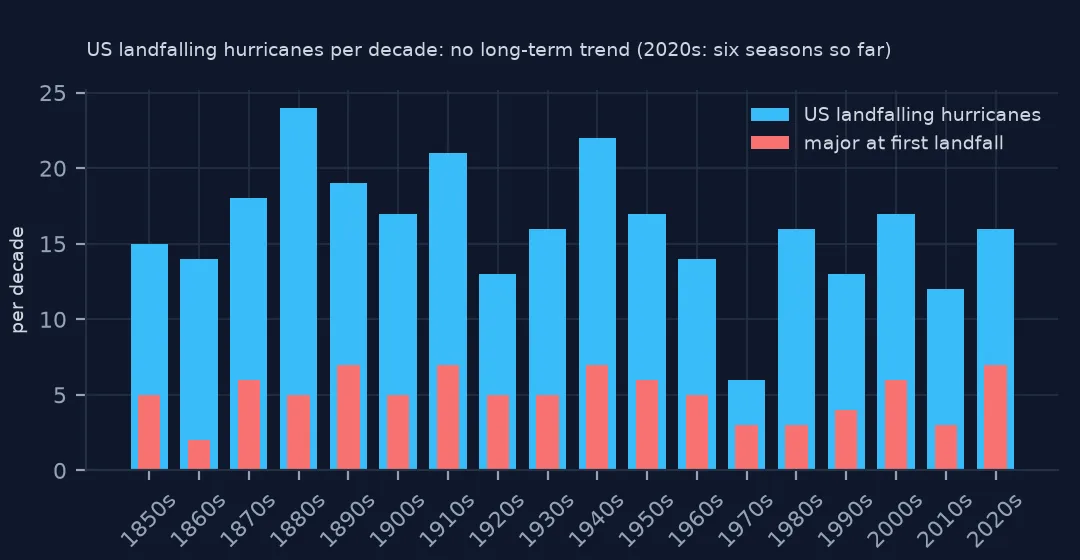
season 1850 1860 1870 1880 1890 1900 1910 1920 1930 1940 1950 1960 1970 1980 1990 2000 2010 2020
hurricanes 15 14 18 24 19 17 21 13 16 22 17 14 6 16 13 17 12 16
major 5 2 6 5 7 5 7 5 5 7 6 5 3 3 4 6 3 7
seasons since 1851 with no US hurricane landfall: 43; 2025 had 0
US hurricane landfalls show no long-term trend. Every decade from the 1850s to the 2020s has between 12 and 24 except the 1970s (6). The 2020s already have 16, 7 of them major. 43 seasons since 1851 had no US hurricane landfall, and 2025 was one of them: Melissa, the season's strongest storm, struck Jamaica, Cuba and the Bahamas.
Example 2: the strongest landfalls
print(near.sort_values(["wind", "pressure"], ascending=[False, True])[["name", "time", "STUSPS", "wind", "pressure"]].head(6).to_string(index=False)) name time STUSPS wind pressure
UNNAMED 1935-09-03 02:00:00 FL 160 892.0
CAMILLE 1969-08-18 04:00:00 MS 150 900.0
ANDREW 1992-08-24 09:05:00 FL 145 922.0
ANDREW 1992-08-24 08:40:00 FL 145 926.0
MICHAEL 2018-10-10 17:30:00 FL 140 919.0
UNNAMED 1886-08-20 13:00:00 TX 130 925.0
The strongest US landfall in the record is the 1935 Labor Day hurricane in the Florida Keys, at 160 kt and 892 hPa. Camille (Mississippi, 1969) and Andrew (Florida, 1992) follow. Andrew appears twice, because its landfall on Elliott Key and on the mainland 25 minutes later are separate records. Deduplicate by storm when ranking hurricanes.
What counts as a landfall
NHC defines landfall as the moment the centre of the storm crosses a coastline. The strongest winds are often in the eyewall, tens of kilometres from the centre, so a hurricane can batter a coast without "making landfall" there. Hurricane Dorian in 2019 is the usual example: it stayed just offshore of most of the south-east US coast. Landfall counts are therefore a measure of direct hits, not of hurricane impacts.
The early landfall record is the most complete part of the 19th-century data. A hurricane coming ashore in a populated state was hard to miss, while storms at sea often went unrecorded. That is why US landfall counts are steady across the decades even though basin-wide counts rise.
Counting choices
- Landfalls or hurricanes. State counts (a storm counts in every state it hits) and national counts (once per storm) answer different questions. Say which.
- Intensity at landfall is the HURDAT2 wind at the landfall fix, which can differ slightly from the estimate in NHC's published landfall table.
- Islands and keys. The 20m generalised boundaries drop small islands; a finer boundary file or a larger distance limit keeps the Keys and Outer Banks.
- Puerto Rico and the US Virgin Islands are excluded here; add them to the polygon set if you count all US landfalls.
Internal links
- How to read HURDAT2 — the record identifiers
- Hurricane counts before satellites — what the early record misses
- How to map a hurricane season's tracks — tracks with landfalls marked
FAQ
Which US state has the most hurricane landfalls?
Florida, with 132 hurricane landfall records in HURDAT2 from 1851 to 2025, ahead of Texas (59) and Louisiana (55).
Did a hurricane make landfall in the US in 2025?
No. None of the 2025 season's hurricanes made landfall on the US mainland, one of 43 such seasons since 1851.