
Pacific Hurricane Tracks Streak Across the Map at 180 Degrees
On this page
Problem statement
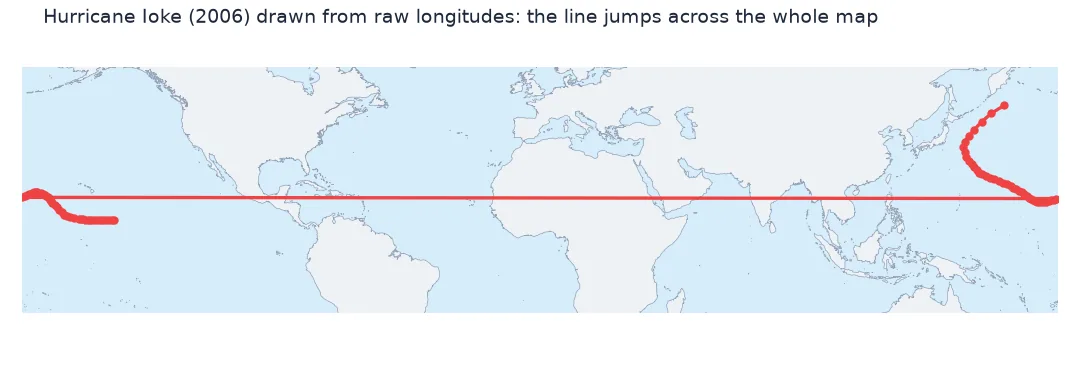
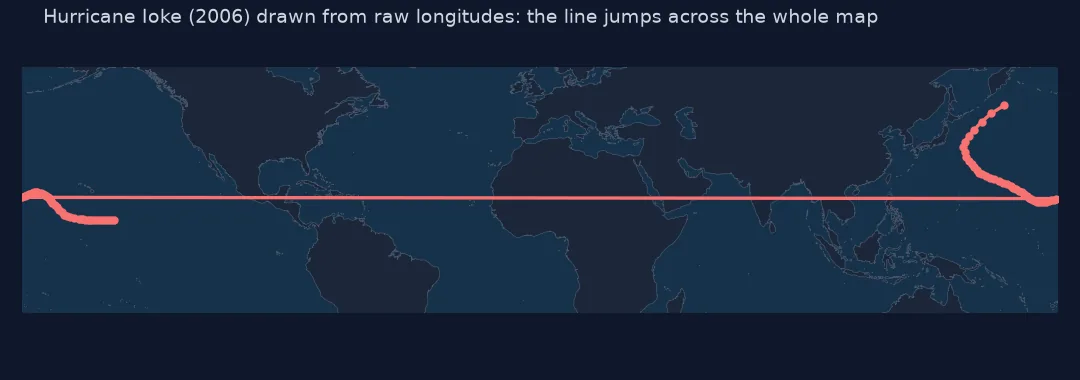
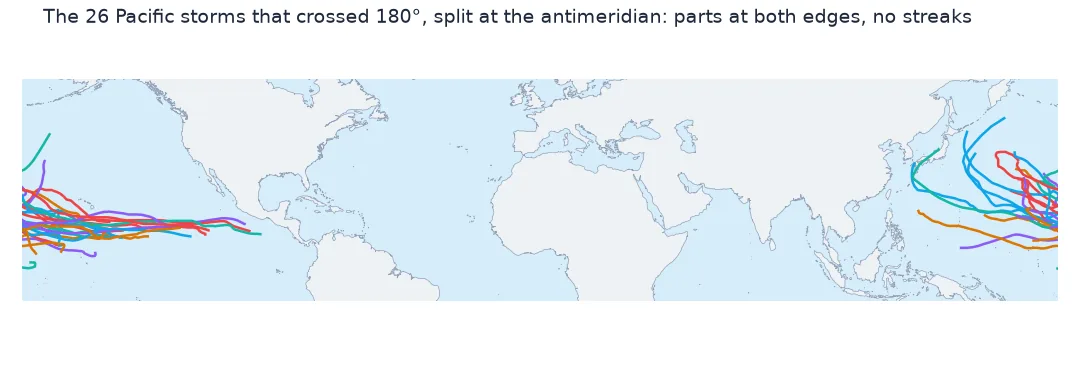
Draw the tracks from NHC's Pacific best-track file and a handful of them cut straight across the map from the western Pacific to the eastern edge, as if the storm had crossed the whole world in six hours. These are storms that crossed the 180° meridian. Their longitude jumps from 179.3 to −179.8 (or back) between two fixes, and a line through those values goes the long way round. 26 of the 1,262 storms in the file do this, including Hurricane Ioke in 2006. This page finds them and fixes them in two ways: unwrapping the longitudes for analysis, and splitting the line at the antimeridian for maps and GeoJSON.
Quick answer
For drawing in a Pacific-centred projection or measuring along the track, unwrap each storm's longitudes so they change continuously (np.unwrap in radians). For GeoJSON, web maps and anything that expects −180 to 180, split the line where it crosses 180°, interpolating the latitude, into a MultiLineString.
from shapely.geometry import LineString

pac = read_hurdat2("data/hurdat2-nepac-1949-2025-092926.txt").sort_values(["sid", "time"])
cross = pac.groupby("sid").lon.apply(lambda l: (l.diff().abs() > 180).any())
print(f"Pacific storms: {pac.sid.nunique():,}; crossing 180 degrees: {cross.sum()}")
ioke = pac[pac.sid == "CP012006"]
bad = LineString(zip(ioke.lon, ioke.lat))
print(f"Ioke (2006) drawn naively: {bad.length:,.0f} degrees of line, spanning {bad.bounds[0]:.1f} to {bad.bounds[2]:.1f}")
Pacific storms: 1,262; crossing 180 degrees: 26
Ioke (2006) drawn naively: 454 degrees of line, spanning -179.8 to 179.3
26 Pacific storms cross 180°. Ioke's track, drawn naively, is 454 degrees of line, spanning almost the full −179.8 to 179.3 range, though the storm covered less than a third of that.
Finding the jumps and two ways to fix them
1. Find the jumps
j = pac.assign(dlon=pac.groupby("sid").lon.diff())
jumps = j[j.dlon.abs() > 180]
print(jumps[["sid", "name", "time", "lon", "dlon"]].to_string(index=False))
sid name time lon dlon
CP011957 DELLA 1957-09-09 12:00:00 179.9 359.1
CP011967 SARAH 1967-09-14 06:00:00 178.6 358.0
CP011988 ULEKI 1988-09-08 12:00:00 178.7 358.5
CP011990 AKA 1990-08-13 18:00:00 177.5 356.5
CP011992 EKEKA 1992-02-04 00:00:00 178.2 358.2
CP011993 KEONI 1993-08-20 00:00:00 179.1 359.1
CP012006 IOKE 2006-08-27 12:00:00 179.3 359.1
CP012008 KIKA 2008-08-14 06:00:00 179.4 358.7
CP012009 MAKA 2009-08-13 12:00:00 179.7 359.4
CP012010 OMEKA 2010-12-17 00:00:00 -180.0 -359.0
CP012010 OMEKA 2010-12-19 00:00:00 179.4 359.2
CP012010 OMEKA 2010-12-20 06:00:00 -178.9 -358.8
CP012013 PEWA 2013-08-18 12:00:00 179.3 359.2
CP012015 HALOLA 2015-07-13 00:00:00 179.4 359.0
CP021972 RUBY 1972-11-14 12:00:00 178.7 358.7
CP021997 OLIWA 1997-09-04 00:00:00 179.4 359.2
CP022009 TWO 2009-08-30 00:00:00 179.1 358.7
CP032013 THREE 2013-08-20 18:00:00 179.7 358.5
CP032015 KILO 2015-09-01 18:00:00 179.9 359.8
CP051997 PAKA 1997-12-07 06:00:00 179.9 359.6
CP092015 NINE 2015-12-28 00:00:00 -179.7 -359.1
EP052023 DORA 2023-08-12 06:00:00 178.9 358.7
EP071999 DORA 1999-08-20 00:00:00 179.4 358.6
EP072014 GENEVIEVE 2014-08-07 06:00:00 179.8 359.0
EP081994 LI 1994-08-13 00:00:00 178.9 358.8
EP101994 JOHN 1994-08-28 12:00:00 179.2 358.8
EP101994 JOHN 1994-09-08 18:00:00 -178.9 -358.7
EP102003 JIMENA 2003-09-05 12:00:00 179.2 358.6
EP102018 HECTOR 2018-08-13 18:00:00 178.7 358.2
A jump between consecutive fixes of more than 180° can only mean a crossing; no storm moves half the planet in six hours. Most of the 29 jumps are westward (+358 to +360: from just west of 180°W to just east of 180°E), the usual direction for central Pacific storms such as Ioke, Kika and Halola. Omeka (2010), John (1994) and an unnamed 2015 depression cross back eastward, and Omeka crosses three times.
2. Unwrap to continuous longitudes
pac["lon_c"] = pac.groupby("sid").lon.transform(lambda l: np.degrees(np.unwrap(np.radians(l))))
ioke = pac[pac.sid == "CP012006"]
good = LineString(zip(ioke.lon_c, ioke.lat))
print(f"Ioke unwrapped: {good.length:.0f} degrees of line, from {good.bounds[0]:.1f} to {good.bounds[2]:.1f}")
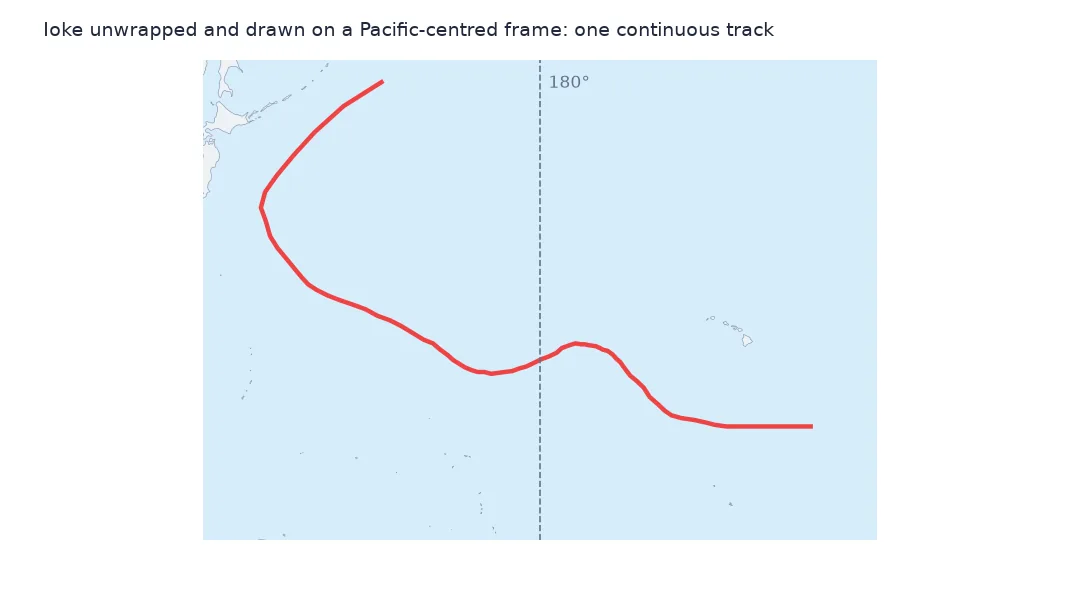
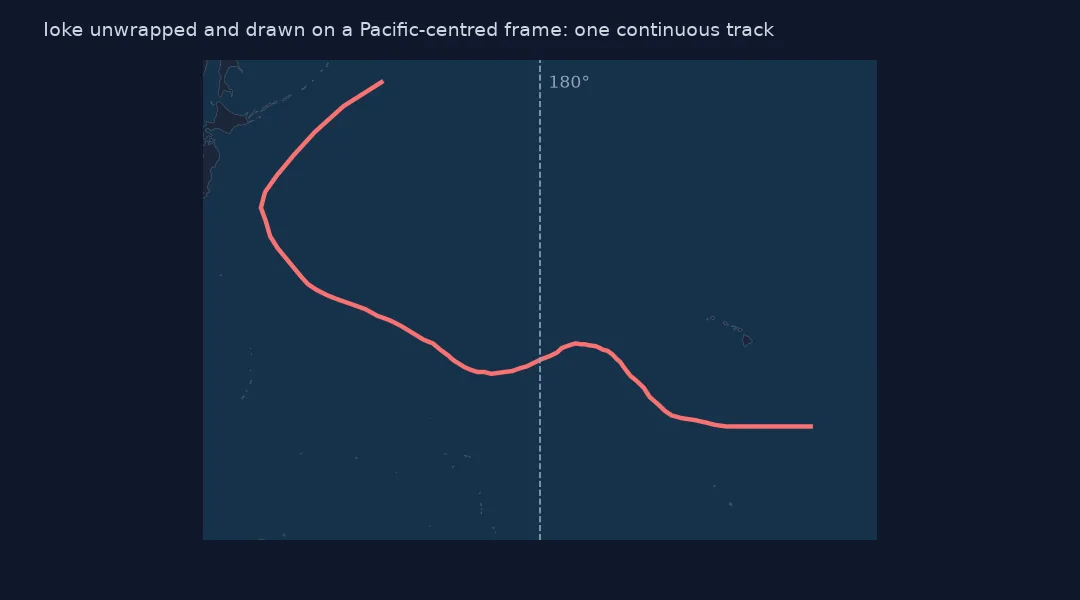
Ioke unwrapped: 96 degrees of line, from -213.1 to -147.9
Unwrapping lets the longitude continue past −180 instead of jumping to +180. Ioke's track becomes 96 degrees of line from −213.1 to −147.9. That is right for analysis and for drawing in a projection centred on the Pacific, but a GeoJSON viewer would reject or misplace values below −180.
3. Or split at the antimeridian
from shapely.geometry import MultiLineString


def split_at_180(lon, lat):
    parts, cur = [], [(lon[0], lat[0])]
    for (x0, y0), (x1, y1) in zip(zip(lon[:-1], lat[:-1]), zip(lon[1:], lat[1:])):
        if abs(x1 - x0) > 180:
            x1u = x1 - 360 if x1 > 0 else x1 + 360
            edge = 180 if x0 > 0 else -180
            y = y0 + (y1 - y0) * (edge - x0) / (x1u - x0)
            cur.append((edge, y)); parts.append(cur); cur = [(-edge, y)]
        cur.append((x1, y1))
    parts.append(cur)
    return MultiLineString(parts)


ml = split_at_180(ioke.lon.values, ioke.lat.values)
print(f"Ioke split: {len(ml.geoms)} parts, longitudes within {ml.bounds[0]:.1f} to {ml.bounds[2]:.1f}; length {ml.length:.0f} degrees")
Ioke split: 2 parts, longitudes within -180.0 to 180.0; length 96 degrees
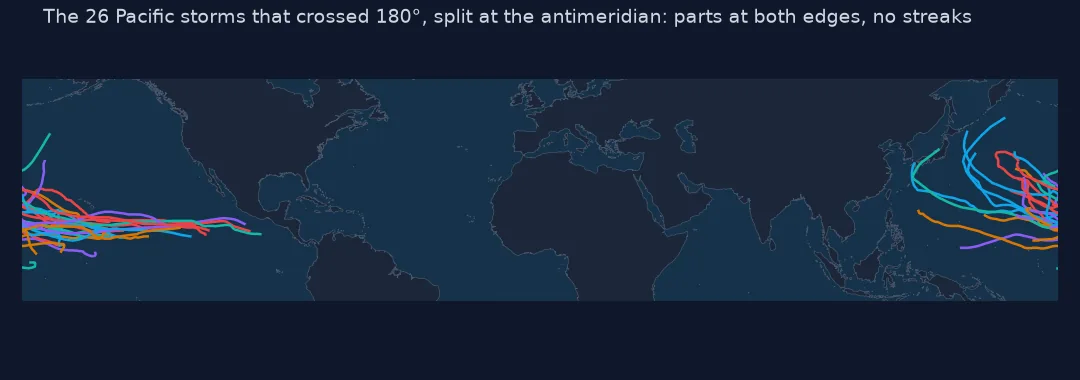
Splitting gives Ioke two parts that meet at 180°, with the latitude at the crossing interpolated, and every longitude within −180.0 to 180.0. Its length, 96 degrees, matches the unwrapped line. Each part is drawn correctly on a standard world map.
Output files and distances
The data used on this page
The National Hurricane Center's HURDAT2 best-track file for the north-east and north-central Pacific, 1949–2025.
from pathlib import Path

import geopandas as gpd
import numpy as np
import pandas as pd
import requests

Path("data").mkdir(exist_ok=True)
# NOAA National Hurricane Center HURDAT2 best tracks: Atlantic 1851-2025 (released 23 September 2026) and
# north-east and north-central Pacific 1949-2025 (29 September 2026). NHC keeps every release under its own name.
FILES = ["hurdat2-1851-2025-092326.txt", "hurdat2-nepac-1949-2025-092926.txt"]
for name in FILES:
    if not Path(f"data/{name}").exists():
        Path(f"data/{name}").write_bytes(requests.get(f"https://www.nhc.noaa.gov/data/hurdat/{name}", timeout=300).content)

COLS = ["date", "time", "record", "status", "lat", "lon", "wind", "pressure"] + \
       [f"r{kt}_{q}" for kt in (34, 50, 64) for q in ("ne", "se", "sw", "nw")] + ["rmw"]


def read_hurdat2(path):
    """One header line per storm (id, name, number of fixes), then one line per fix; -999 means missing."""
    rows = []
    for line in open(path):
        f = [x.strip() for x in line.split(",")]
        if f[0][:2].isalpha():
            sid, name = f[0], f[1]
            continue
        rows.append([sid, name] + f[:21])
    h = pd.DataFrame(rows, columns=["sid", "name"] + COLS)
    h["time"] = pd.to_datetime(h.date + h.time, format="%Y%m%d%H%M")
    h["lat"] = h.lat.str[:-1].astype(float) * np.where(h.lat.str[-1] == "S", -1, 1)
    h["lon"] = h.lon.str[:-1].astype(float) * np.where(h.lon.str[-1] == "W", -1, 1)
    for c in COLS[6:]:
        h[c] = pd.to_numeric(h[c]).replace(-999, np.nan)
    h["season"] = h.sid.str[-4:].astype(int)
    h["synoptic"] = h.time.dt.strftime("%H%M").isin(["0000", "0600", "1200", "1800"])
    return h.drop(columns="date")


hd = read_hurdat2("data/hurdat2-1851-2025-092326.txt")
print(f"HURDAT2 Atlantic: {hd.sid.nunique():,} storms, {len(hd):,} fixes, {hd.season.min()}-{hd.season.max()}")
HURDAT2 Atlantic: 1,988 storms, 55,524 fixes, 1851-2025
Example 1: which method for which output
tracks = gpd.GeoDataFrame({"sid": cross[cross].index}, crs=4326,
                          geometry=[split_at_180(g.lon.values, g.lat.values) for _, g in pac[pac.sid.isin(cross[cross].index)].groupby("sid")])
tracks.to_file("pacific_crossers.geojson", driver="GeoJSON")
back = gpd.read_file("pacific_crossers.geojson")
print(f"{len(back)} crossing tracks written as GeoJSON; max longitude span of any part {max(g.bounds[2] - g.bounds[0] for m in back.geometry for g in m.geoms):.1f} degrees")
26 crossing tracks written as GeoJSON; max longitude span of any part 82.9 degrees
The 26 crossing tracks, split, write to GeoJSON and read back with no part spanning more than 82.9 degrees of longitude. That is a long track, not a wrapped one. The GeoJSON specification asks writers to split geometries at the antimeridian in exactly this way.
Example 2: distances are not affected
from pyproj import Geod

geod = Geod(ellps="WGS84")
print(f"Ioke geodesic length: {geod.line_length(ioke.lon.values, ioke.lat.values) / 1000:,.0f} km from wrapped longitudes, "
      f"{geod.line_length(ioke.lon_c.values, ioke.lat.values) / 1000:,.0f} km from unwrapped")
Ioke geodesic length: 10,062 km from wrapped longitudes, 10,062 km from unwrapped
Geodesic measurement is not affected: pyproj.Geod gives Ioke's track as 10,062 km from either the wrapped or the unwrapped longitudes, because it computes each segment on the ellipsoid. The problem is only in planar geometry and drawing. Anything computed with shapely in degrees (length, buffer, intersection) needs the unwrapped or split form.
Why the line goes the wrong way
Shapely, GeoPandas and most plotting libraries treat longitude and latitude as plain x and y on a flat plane. On that plane, the shortest way from x = 179.3 to x = −179.8 is to travel 359.1 units west rather than a short step east, because the plane has no idea that the two edges meet. The data are correct; the geometry model is planar. Every format that stores coordinates in −180 to 180 has the same problem, which is why GeoJSON's specification spells out the split, and why Pacific maps are usually drawn in a projection centred on 180° with unwrapped longitudes.
Other places this bites
- Bounding boxes. The bounds of a crossing track span nearly the whole globe; compute extents on unwrapped longitudes.
- Buffers and swaths of crossing storms need splitting first, or the buffer fills the map.
- Spatial joins with a Pacific basin polygon fail for the wrapped line; use the split MultiLineString.
- Cartopy handles crossing lines if you pass
transform=ccrs.Geodetic(); matplotlib alone does not.
Internal links
- Hurricane tracks in the wrong hemisphere — the sign of the longitude
- How to read HURDAT2 — the Pacific file uses the same format
- How to animate a hurricane track — keeping a map still
FAQ
Why does my hurricane track draw a line across the whole map?
The storm crossed 180° and its longitude jumped between −180 and 180. Unwrap the longitudes or split the line at the antimeridian.
How many eastern and central Pacific storms crossed the date line?
26 of the 1,262 in the HURDAT2 Pacific file for 1949–2025, among them Ioke (2006) and Genevieve (2014).