
How to Read HURDAT2 Hurricane Best Tracks in Python
On this page
Problem statement
HURDAT2 is the National Hurricane Center's official record of every Atlantic tropical and subtropical cyclone since 1851: 1,988 storms and 55,524 positions in the release of September 2026. It is a plain text file, but not a CSV. Each storm starts with a header line, followed by a block of fix lines. Coordinates carry hemisphere letters instead of signs, missing values are -999, and a one-letter code marks landfalls and other special fixes that fall between the regular six-hourly ones. This page parses it into a pandas table, explains each field, and writes the tracks as lines.
Quick answer
Read the file line by line. A line starting with letters (AL011851) is a header: remember its ID and name. Every other line is a fix: split on commas, attach the current ID, and parse date and time together. Turn 28.0N/94.8W into signed degrees and -999 into NaN. The setup's read_hurdat2() does it in about twenty lines.
storms = hd.groupby("sid").agg(name=("name", "first"), start=("time", "min"), fixes=("time", "size"),
                               peak_kt=("wind", "max"), min_hpa=("pressure", "min"))
print(storms.tail(4).to_string())
name start fixes peak_kt min_hpa
sid
AL302005 EPSILON 2005-11-29 06:00:00 43 75 981.0
AL302020 THETA 2020-11-08 12:00:00 33 60 987.0
AL312005 ZETA 2005-12-30 00:00:00 36 55 994.0
AL312020 IOTA 2020-11-12 12:00:00 26 135 917.0
One row per fix becomes one row per storm with a groupby. Here are the last four by ID: the late storms of the record-breaking 2005 and 2020 seasons, which ran through the alphabet (Epsilon, Zeta, Theta, Iota). Zeta of 2005 started on 30 December and belongs to the 2005 season, although most of its fixes are in January 2006.
Headers, fixes, identifiers and missing values
1. Two kinds of line
lines = open("data/hurdat2-1851-2025-092326.txt").read().splitlines()
print("\n".join(lines[:3]))
heads = [l for l in lines if l[:2].isalpha()]
declared = sum(int(h.split(",")[2]) for h in heads)
print(f"header lines: {len(heads):,}; fixes declared in headers: {declared:,}; data lines: {len(lines) - len(heads):,}")
AL011851, UNNAMED, 14,
18510625, 0000, , HU, 28.0N, 94.8W, 80, -999, -999, -999, -999, -999, -999, -999, -999, -999, -999, -999, -999, -999, -999
18510625, 0600, , HU, 28.0N, 95.4W, 80, -999, -999, -999, -999, -999, -999, -999, -999, -999, -999, -999, -999, -999, -999
header lines: 1,988; fixes declared in headers: 55,524; data lines: 55,524
A header holds the storm ID (basin, number in the season, year), the name (UNNAMED before names were assigned in 1950) and the number of fix lines that follow. The 1,988 headers declare 55,524 fixes, exactly the number of data lines, which is a useful check that a download is complete. Each fix line has 21 fields: date, time, identifier, status, latitude, longitude, maximum wind in knots, central pressure in hPa, twelve wind radii and the radius of maximum wind.
2. The record identifier
print(hd.record.replace("", "(blank)").value_counts().to_dict())
print(f"fixes at a synoptic hour (00, 06, 12, 18 UTC): {hd.synoptic.mean():.1%}; "
      f"non-synoptic fixes that carry an identifier: {(hd.record[~hd.synoptic] != '').mean():.1%}")
{'(blank)': 54228, 'L': 1213, 'I': 35, 'R': 11, 'P': 10, 'T': 9, 'S': 8, 'C': 5, 'W': 4, 'G': 1}
fixes at a synoptic hour (00, 06, 12, 18 UTC): 98.0%; non-synoptic fixes that carry an identifier: 100.0%
The third field is usually blank. L marks a landfall (1,213 fixes); the others mark an intensity peak (I), a minimum in pressure (P), a change of status (S), genesis (G) and similar events. 98.0% of fixes fall at 00, 06, 12 or 18 UTC, the synoptic hours. Every one of the remaining fixes carries an identifier: the extra fixes are added only to record such moments. Sums and rates over time must leave them out, or a landfall counts twice.
3. The status of the system
print(hd.status.value_counts().to_dict())
tropical = hd.status.isin(["TD", "TS", "HU"])
print(f"fixes when the system was tropical: {tropical.mean():.1%}; subtropical (SD, SS): {hd.status.isin(['SD', 'SS']).mean():.1%}")
{'TS': 20572, 'HU': 15779, 'TD': 9388, 'EX': 6444, 'LO': 1775, 'SS': 758, 'SD': 355, 'DB': 315, 'WV': 138}
fixes when the system was tropical: 82.4%; subtropical (SD, SS): 2.0%
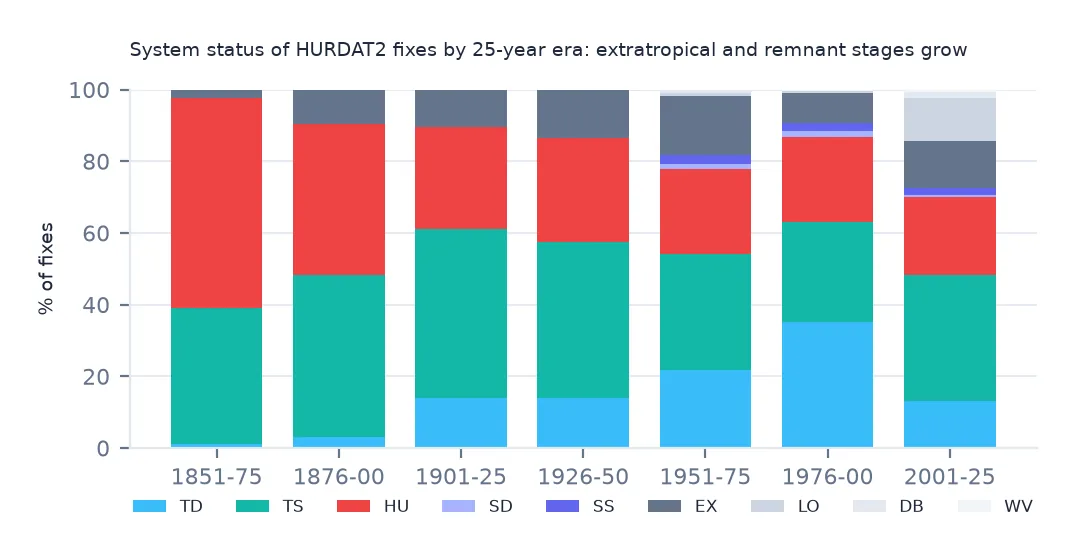
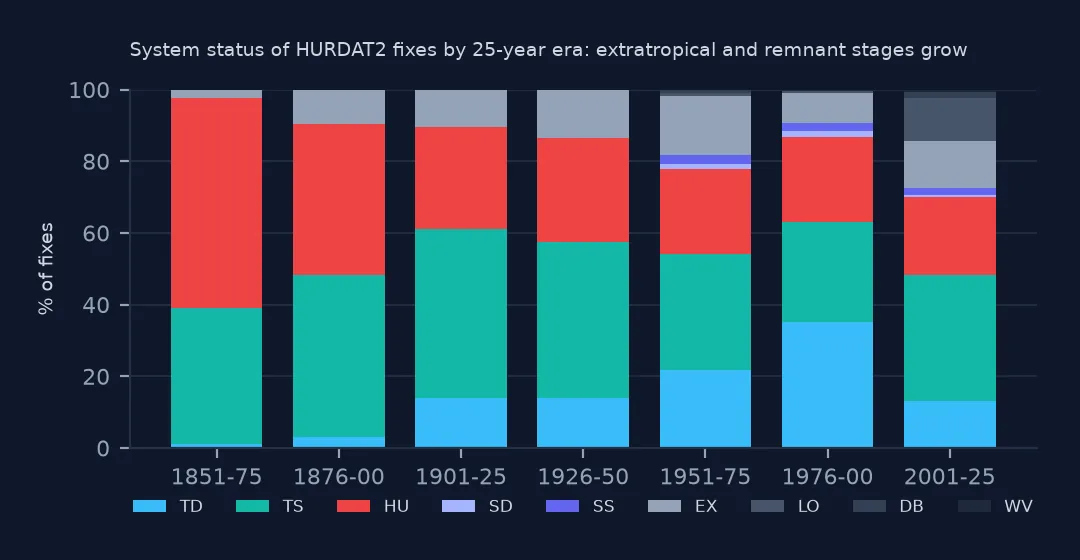
The status says what kind of system the storm was at that moment: tropical depression (TD), tropical storm (TS) or hurricane (HU), their subtropical equivalents (SD, SS), or not a tropical cyclone at all: extratropical (EX), a remnant low (LO), a disturbance (DB) or a tropical wave (WV). 82.4% of fixes are tropical. The 6,444 extratropical fixes include some of the strongest winds in the file, from storms that turned into North Atlantic gales. Category and energy statistics should filter on status as well as wind.
4. Missing values are -999
raw_p = pd.to_numeric(pd.Series([l.split(",")[7] for l in lines if not l[:2].isalpha()]))
print(f"pressure as read: mean {raw_p.mean():.0f}; after -999 to NaN: mean {hd.pressure.mean():.0f} hPa from {hd.pressure.notna().sum():,} fixes")
by = hd.groupby((hd.season - 1851) // 25 * 25 + 1851).agg(pressure=("pressure", lambda s: s.notna().mean()), radii=("r34_ne", lambda s: s.notna().mean()))
print(by.round(3).to_string())
pressure as read: mean -95; after -999 to NaN: mean 992 hPa from 25,193 fixes
pressure radii
season
1851 0.015 0.000
1876 0.019 0.000
1901 0.023 0.000
1926 0.055 0.000
1951 0.321 0.000
1976 0.820 0.000
2001 1.000 0.883
Read as numbers without replacing -999, central pressure averages −95 hPa. Replaced, it averages 992 hPa over the 25,193 fixes that have one. The table shows how coverage grew: pressure is known for about 2% of fixes before 1926, 32.1% in 1951–1975 and all fixes since 2001, and wind radii exist only from 2004.
A season table, a track layer and the Pacific file
The data used on this page
The National Hurricane Center's HURDAT2 best-track files for the Atlantic (1851–2025) and the north-east and north-central Pacific (1949–2025).
from pathlib import Path

import geopandas as gpd
import numpy as np
import pandas as pd
import requests

Path("data").mkdir(exist_ok=True)
# NOAA National Hurricane Center HURDAT2 best tracks: Atlantic 1851-2025 (released 23 September 2026) and
# north-east and north-central Pacific 1949-2025 (29 September 2026). NHC keeps every release under its own name.
FILES = ["hurdat2-1851-2025-092326.txt", "hurdat2-nepac-1949-2025-092926.txt"]
for name in FILES:
    if not Path(f"data/{name}").exists():
        Path(f"data/{name}").write_bytes(requests.get(f"https://www.nhc.noaa.gov/data/hurdat/{name}", timeout=300).content)

COLS = ["date", "time", "record", "status", "lat", "lon", "wind", "pressure"] + \
       [f"r{kt}_{q}" for kt in (34, 50, 64) for q in ("ne", "se", "sw", "nw")] + ["rmw"]


def read_hurdat2(path):
    """One header line per storm (id, name, number of fixes), then one line per fix; -999 means missing."""
    rows = []
    for line in open(path):
        f = [x.strip() for x in line.split(",")]
        if f[0][:2].isalpha():
            sid, name = f[0], f[1]
            continue
        rows.append([sid, name] + f[:21])
    h = pd.DataFrame(rows, columns=["sid", "name"] + COLS)
    h["time"] = pd.to_datetime(h.date + h.time, format="%Y%m%d%H%M")
    h["lat"] = h.lat.str[:-1].astype(float) * np.where(h.lat.str[-1] == "S", -1, 1)
    h["lon"] = h.lon.str[:-1].astype(float) * np.where(h.lon.str[-1] == "W", -1, 1)
    for c in COLS[6:]:
        h[c] = pd.to_numeric(h[c]).replace(-999, np.nan)
    h["season"] = h.sid.str[-4:].astype(int)
    h["synoptic"] = h.time.dt.strftime("%H%M").isin(["0000", "0600", "1200", "1800"])
    return h.drop(columns="date")


hd = read_hurdat2("data/hurdat2-1851-2025-092326.txt")
print(f"HURDAT2 Atlantic: {hd.sid.nunique():,} storms, {len(hd):,} fixes, {hd.season.min()}-{hd.season.max()}")
HURDAT2 Atlantic: 1,988 storms, 55,524 fixes, 1851-2025
Example 1: the 2025 season in one table
s25 = storms[storms.index.str.endswith("2025")]
print(s25.assign(start=s25.start.dt.strftime("%d %b")).to_string())
name start fixes peak_kt min_hpa
sid
AL012025 ANDREA 22 Jun 15 35 1014.0
AL022025 BARRY 28 Jun 8 40 1006.0
AL032025 CHANTAL 04 Jul 16 50 1002.0
AL042025 DEXTER 02 Aug 43 70 988.0
AL052025 ERIN 11 Aug 68 140 913.0
AL062025 FERNAND 23 Aug 21 50 999.0
AL072025 GABRIELLE 17 Sep 45 120 944.0
AL082025 HUMBERTO 24 Sep 29 140 918.0
AL092025 IMELDA 26 Sep 38 80 966.0
AL102025 JERRY 07 Oct 18 55 1000.0
AL112025 KAREN 08 Oct 15 50 996.0
AL122025 LORENZO 13 Oct 10 50 1000.0
AL132025 MELISSA 21 Oct 49 165 892.0
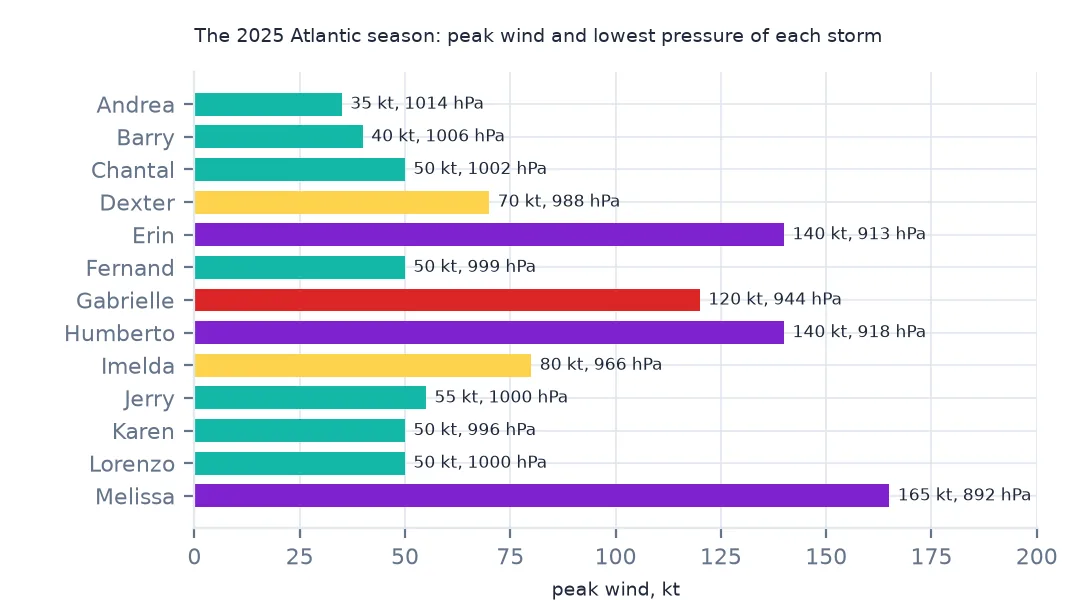
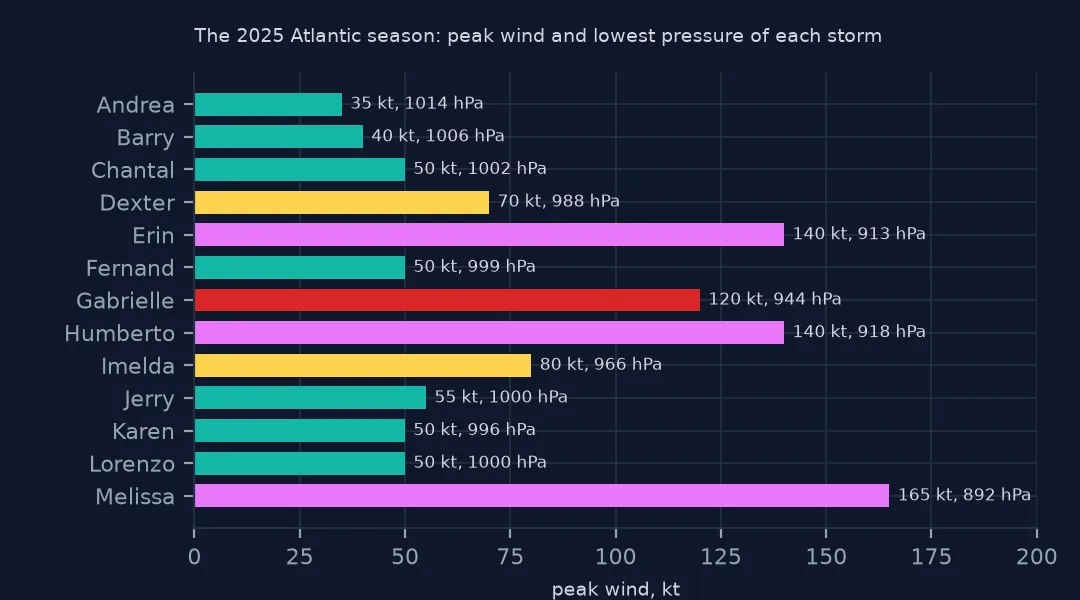
The 2025 season had 13 named storms. Three reached 140 kt or more: Erin, Humberto and Melissa. Melissa's 165 kt and 892 hPa make it the strongest of the season and one of the strongest Atlantic hurricanes on record.
Example 2: tracks as lines
from shapely.geometry import LineString

trk = hd[hd.synoptic].sort_values(["sid", "time"]).groupby("sid").filter(lambda g: len(g) > 1)
lines_gdf = gpd.GeoDataFrame(storms.loc[trk.sid.unique()], crs=4326,
                             geometry=[LineString(zip(g.lon, g.lat)) for _, g in trk.groupby("sid", sort=False)])
lines_gdf.reset_index().assign(start=lambda d: d.start.astype(str)).to_file("hurdat2_atlantic.gpkg", layer="tracks", driver="GPKG")
print(f"{len(lines_gdf):,} tracks written; storms with a single fix: {hd.sid.nunique() - len(lines_gdf)}")
1,957 tracks written; storms with a single fix: 31
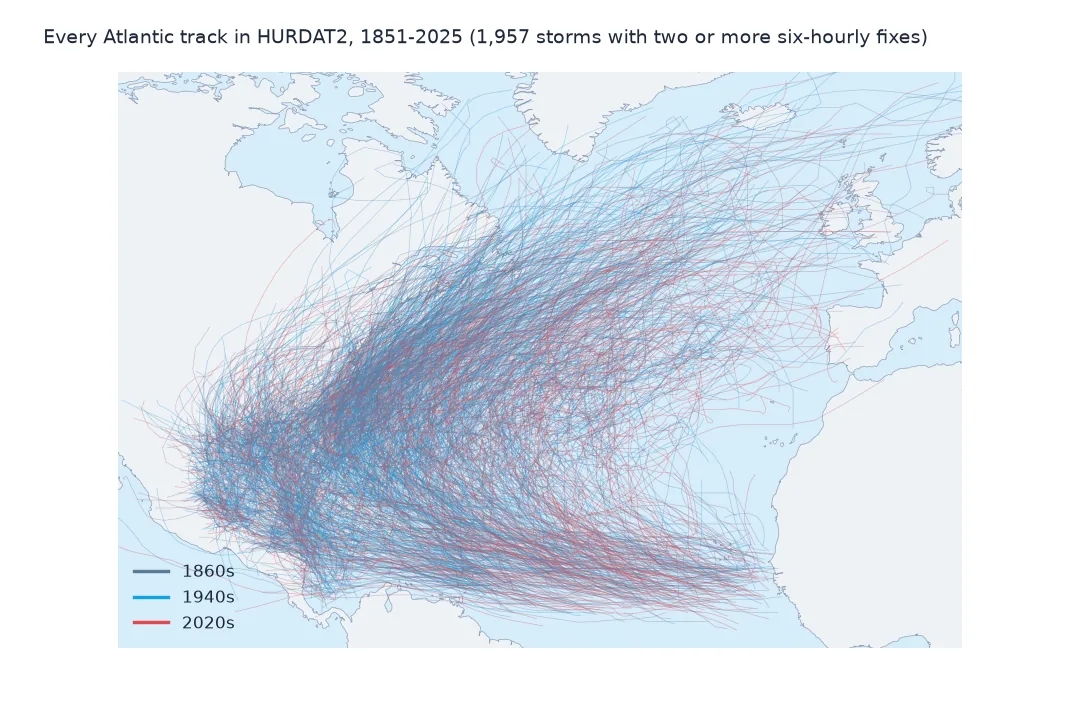
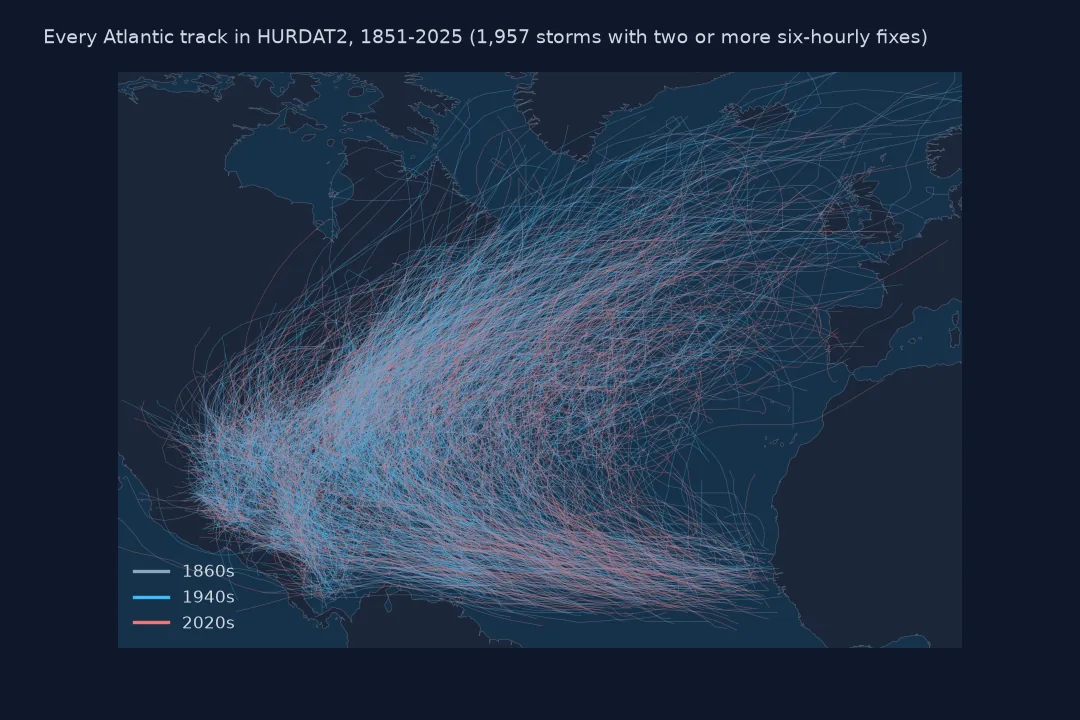
Drawing one line per storm through its six-hourly fixes gives 1,957 tracks. The 31 storms with a single synoptic fix cannot form a line and are left out. Keep them as points if you are counting storms. The GeoPackage carries each storm's name, start, peak wind and minimum pressure.
Example 3: the Pacific file reads the same way
pac = read_hurdat2("data/hurdat2-nepac-1949-2025-092926.txt")
print(f"north-east and central Pacific: {pac.sid.nunique():,} storms, {len(pac):,} fixes, basins {sorted(pac.sid.str[:2].unique())}; "
      f"east longitudes: {(pac.lon > 0).sum()}")
north-east and central Pacific: 1,262 storms, 32,060 fixes, basins ['CP', 'EP']; east longitudes: 633
The Pacific file has the same layout: 1,262 storms from the eastern (EP) and central (CP) Pacific since 1949. It has 633 fixes with east longitudes, from storms that crossed the date line, which is why the parser applies the sign from the letter rather than assuming west.
What a best track is
A best track is a post-season reanalysis. After each season, NHC forecasters re-examine every storm with all the data that arrived late or was not available in real time, such as aircraft reconnaissance, scatterometer winds, ship and buoy reports and satellite estimates, and write down their best estimate of position and intensity every six hours. Older seasons are revised too: the Atlantic Hurricane Reanalysis Project has been working forward through the record from 1851, revising it a few seasons at a time. That is why NHC keeps every release under a dated name, and why a published analysis should cite the release it used, here the one of 23 September 2026.
Parsing details
- Whitespace. Fields are padded with spaces; strip each one after splitting.
- Names repeat.
UNNAMEDcovers hundreds of storms, and names are reused every six years. Always group by the ID. - The season is in the ID, not the date: Zeta (
AL312005) runs into 2006. - Wind is in knots and is a one-minute sustained wind, rounded to 5 kt; pressure is in hPa (millibars).
Internal links
- How to map a hurricane season's tracks — the tracks drawn by intensity
- Hurricane tracks in the wrong hemisphere — the N and W suffixes
- ACE comes out too high — what the record identifier does to sums
- How to map a hurricane track from IBTrACS — the multi-agency archive
FAQ
How do I read HURDAT2 in pandas?
Not with read_csv alone: the header lines have a different number of fields. Read the file line by line, carry the storm ID from each header to the fix lines below it, and build a DataFrame from the fixes.
What does -999 mean in HURDAT2?
Missing. Pressure is missing for most fixes before the 1950s, and wind radii exist only from 2004.