
Hurricane Counts Before Satellites: Why the Early Record Runs Low
On this page
Problem statement
Plot the number of Atlantic named storms per year from HURDAT2 and the line climbs: from about 6.7 a year in the first 25 years of the record to 16.3 in 2001–2025. It is tempting to read that as the effect of a warming ocean. But for most of the record, a storm was only recorded if a ship ran into it or it reached land, and short storms far out at sea went unseen. This page measures how the record's completeness changed, through storm duration, where storms were first seen, and how precisely positions and winds were recorded, so that a trend can be read with the right caution.
Quick answer
Do not fit trends to raw storm counts across the whole record. Compare like with like: restrict to the satellite era (1966 onward), or to measures the early record captured well, such as long-lived storms, hurricanes reaching land and US landfalls. Treat counts before about 1950 as lower bounds.
def era(season):
    """25-year eras starting in 1851: 1851-1875, ..., 2001-2025."""
    return (season - 1851) // 25 * 25 + 1851


first = hd[hd.status.isin(["TS", "HU", "SS"])].groupby("sid").agg(season=("season", "first"), peak=("wind", "max"),
                                                                    start=("time", "min"), end=("time", "max"))
per = first.groupby(era(first.season)).size() / 25
print("named storms per year:", per.round(1).to_dict())
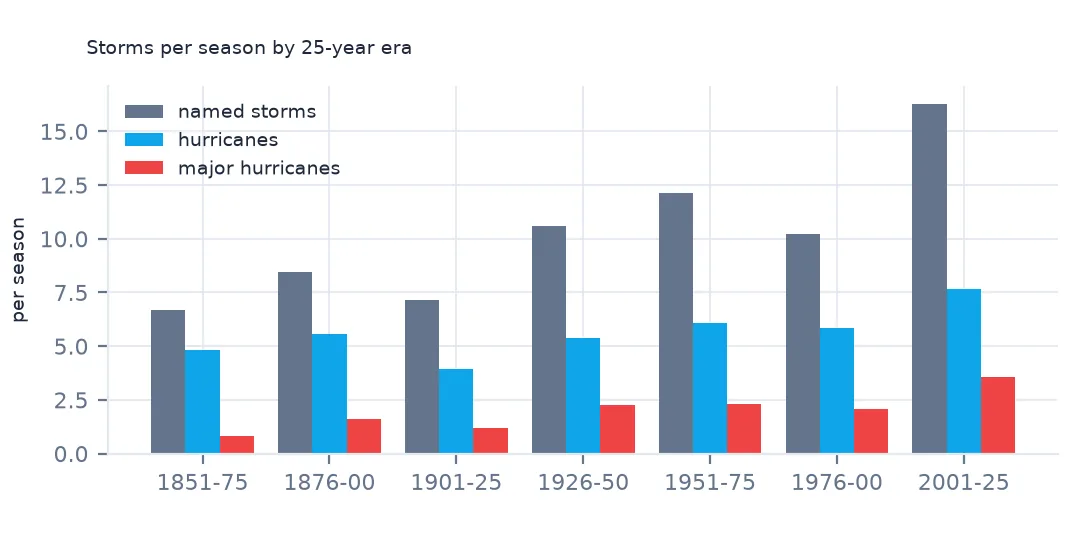
named storms per year: {1851: 6.7, 1876: 8.4, 1901: 7.2, 1926: 10.6, 1951: 12.1, 1976: 10.2, 2001: 16.3}
In 25-year eras, named storms per year rise from 6.7 (1851–75) to 12.1 (1951–1975), dip to 10.2 (1976–2000) and reach 16.3 (2001–2025). The next steps show how much of that rise comes from better observation.
Four signs of an incomplete record
1. Short-lived storms
first["days"] = (first.end - first.start).dt.total_seconds() / 86400
short = first.days < 2
print("storms lasting under 2 days, per year:", short.groupby(era(first.season)).sum().div(25).round(2).to_dict())
print("storms lasting 2 days or more, per year:", (~short).groupby(era(first.season)).sum().div(25).round(2).to_dict())
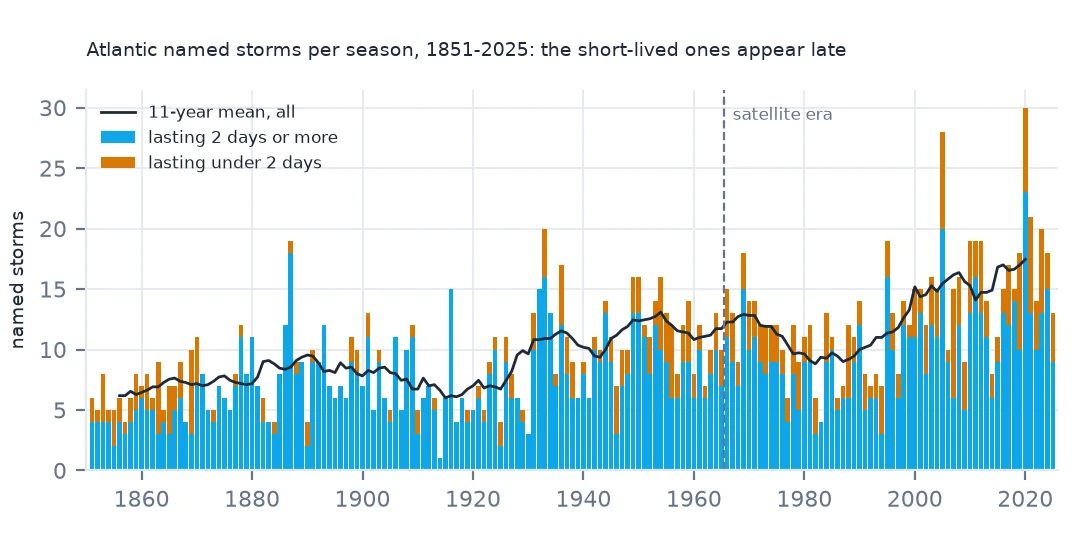
storms lasting under 2 days, per year: {1851: 2.08, 1876: 0.56, 1901: 0.6, 1926: 1.8, 1951: 3.12, 1976: 2.48, 2001: 4.44}
storms lasting 2 days or more, per year: {1851: 4.6, 1876: 7.88, 1901: 6.56, 1926: 8.8, 1951: 9.0, 1976: 7.72, 2001: 11.84}
Storms that lasted less than 2 days account for much of the rise. They average 0.56–0.60 a year in 1876–1925 and 4.44 a year in 2001–2025. Storms lasting 2 days or more rose from 7.88 a year in 1876–1900 to 11.84, a much smaller relative increase. Short storms are exactly the ones that ships could miss and that modern satellites, scatterometers and aircraft now catch.
2. Hurricanes and major hurricanes
hur = first[first.peak >= 64].groupby(era(first.season)).size() / 25
maj = first[first.peak >= 100].groupby(era(first.season)).size() / 25
print(pd.DataFrame({"hurricanes": hur, "major": maj}).round(2).T.to_string())
season 1851 1876 1901 1926 1951 1976 2001
hurricanes 4.8 5.56 3.92 5.40 6.08 5.84 7.64
major 0.8 1.60 1.20 2.24 2.32 2.08 3.56
Hurricanes rose less: from 4.8 a year in 1851–75 to 7.64 in 2001–2025, with a dip in 1901–1925 (3.92). Major hurricanes rose from 0.8 to 3.56 a year. Part of the rise is real warming and the active phase since the mid-1990s. Part is that a hurricane's peak intensity over the open ocean is now measured, where in the 19th century its strongest winds were seldom observed.
3. How precise the positions are
tenths = (hd.lat * 10 % 10).round().astype(int)
print("share of latitudes on a whole or half degree, by era:",
      tenths.isin([0, 5]).groupby(era(hd.season)).mean().round(2).to_dict())
share of latitudes on a whole or half degree, by era: {1851: 0.39, 1876: 0.29, 1901: 0.35, 1926: 0.29, 1951: 0.33, 1976: 0.3, 2001: 0.23}
Precision tells the same story. 39% of latitudes in 1851–75 sit on a whole or half degree, against 23% in 2001–2025, which is close to the one in five that random tenths would give. Early positions were estimated from scattered reports and rounded. Modern ones come from satellite and aircraft fixes.
4. How the winds were rounded
w = hd.wind.dropna()
print("share of winds that are multiples of 10 kt, by era:", (w % 10 == 0).groupby(era(hd.season)).mean().round(2).to_dict())
print("share of fixes with a pressure, by era:", hd.pressure.notna().groupby(era(hd.season)).mean().round(2).to_dict())
share of winds that are multiples of 10 kt, by era: {1851: 1.0, 1876: 0.64, 1901: 0.51, 1926: 0.52, 1951: 0.5, 1976: 0.53, 2001: 0.5}
share of fixes with a pressure, by era: {1851: 0.01, 1876: 0.02, 1901: 0.02, 1926: 0.06, 1951: 0.32, 1976: 0.82, 2001: 1.0}
Every wind in 1851–75 is a multiple of 10 kt, and the share falls to about half from 1901 on, as 5-kt steps came into use. Central pressure exists for 1% of fixes in the first era and 32% in 1951–1975, and only reaches 100% in 2001–2025. Before aircraft reconnaissance began in the 1940s, a pressure came from a ship or station that happened to be in the eye.
Where storms were seen, and trends by window
The data used on this page
The National Hurricane Center's HURDAT2 Atlantic best-track file, 1851–2025.
from pathlib import Path

import geopandas as gpd
import numpy as np
import pandas as pd
import requests

Path("data").mkdir(exist_ok=True)
# NOAA National Hurricane Center HURDAT2 best tracks: Atlantic 1851-2025 (released 23 September 2026) and
# north-east and north-central Pacific 1949-2025 (29 September 2026). NHC keeps every release under its own name.
FILES = ["hurdat2-1851-2025-092326.txt", "hurdat2-nepac-1949-2025-092926.txt"]
for name in FILES:
    if not Path(f"data/{name}").exists():
        Path(f"data/{name}").write_bytes(requests.get(f"https://www.nhc.noaa.gov/data/hurdat/{name}", timeout=300).content)

COLS = ["date", "time", "record", "status", "lat", "lon", "wind", "pressure"] + \
       [f"r{kt}_{q}" for kt in (34, 50, 64) for q in ("ne", "se", "sw", "nw")] + ["rmw"]


def read_hurdat2(path):
    """One header line per storm (id, name, number of fixes), then one line per fix; -999 means missing."""
    rows = []
    for line in open(path):
        f = [x.strip() for x in line.split(",")]
        if f[0][:2].isalpha():
            sid, name = f[0], f[1]
            continue
        rows.append([sid, name] + f[:21])
    h = pd.DataFrame(rows, columns=["sid", "name"] + COLS)
    h["time"] = pd.to_datetime(h.date + h.time, format="%Y%m%d%H%M")
    h["lat"] = h.lat.str[:-1].astype(float) * np.where(h.lat.str[-1] == "S", -1, 1)
    h["lon"] = h.lon.str[:-1].astype(float) * np.where(h.lon.str[-1] == "W", -1, 1)
    for c in COLS[6:]:
        h[c] = pd.to_numeric(h[c]).replace(-999, np.nan)
    h["season"] = h.sid.str[-4:].astype(int)
    h["synoptic"] = h.time.dt.strftime("%H%M").isin(["0000", "0600", "1200", "1800"])
    return h.drop(columns="date")


hd = read_hurdat2("data/hurdat2-1851-2025-092326.txt")
print(f"HURDAT2 Atlantic: {hd.sid.nunique():,} storms, {len(hd):,} fixes, {hd.season.min()}-{hd.season.max()}")
HURDAT2 Atlantic: 1,988 storms, 55,524 fixes, 1851-2025
Example 1: where early storms were seen
gen = hd[hd.status.isin(["TS", "HU", "SS"])].sort_values("time").drop_duplicates("sid")
gen["era"] = np.where(gen.season < 1966, "before 1966", "1966 onward")
print(gen.groupby("era").lon.describe()[["25%", "50%", "75%"]].round(1).to_string())
print("share first named east of 50W:", gen.groupby("era").lon.apply(lambda l: (l > -50).mean()).round(3).to_dict())
25% 50% 75%
era
1966 onward -80.0 -64.4 -44.8
before 1966 -81.7 -70.6 -55.6
share first named east of 50W: {'1966 onward': 0.32, 'before 1966': 0.168}
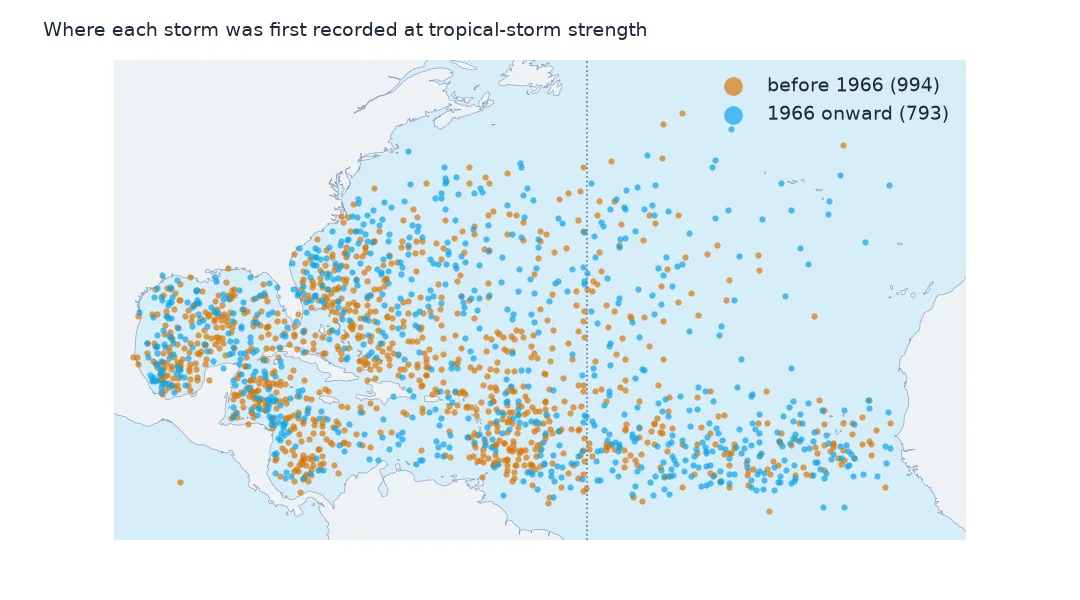
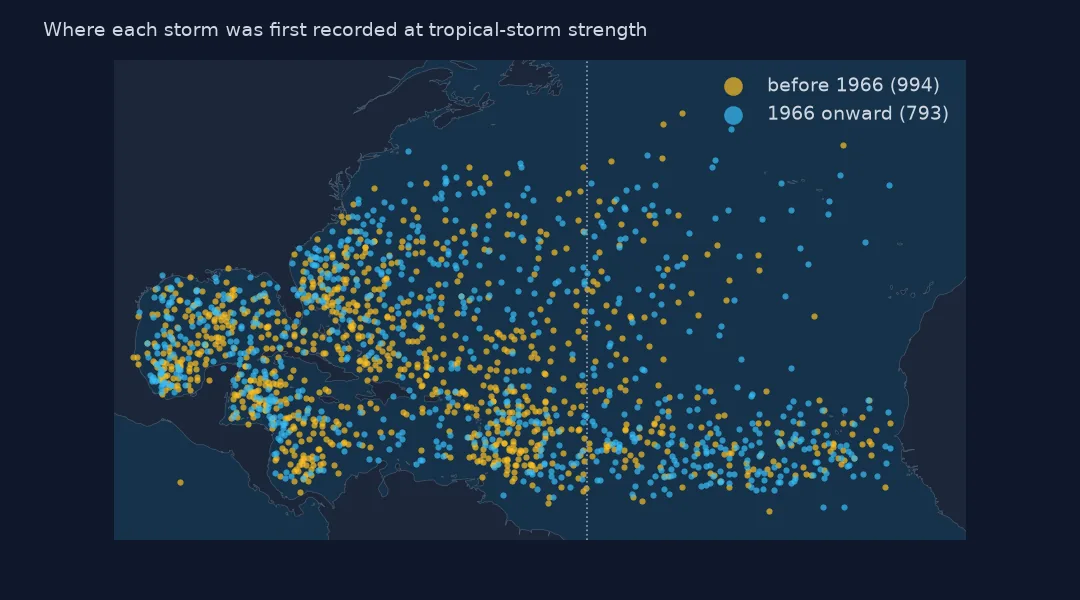
Before 1966, storms were first recorded at tropical-storm strength at a median longitude of 70.6°W, close to the Caribbean and the US coast. Since 1966 the median is 64.4°W. 32% of storms are now first named east of 50°W, against 16.8% before satellites. Storms that formed and died in the eastern Atlantic were the most likely to be missed.
Example 2: trends over different windows
n = first.groupby("season").size().reindex(range(1851, 2026), fill_value=0)
for a in (1851, 1900, 1966):
    s_ = n.loc[a:]
    print(f"{a}-2025 trend: {np.polyfit(s_.index, s_.values, 1)[0] * 100:+.1f} named storms per century")
1851-2025 trend: +5.3 named storms per century
1900-2025 trend: +7.1 named storms per century
1966-2025 trend: +12.8 named storms per century
The fitted trend depends on the window: +5.3 named storms per century over 1851–2025, +7.1 from 1900 and +12.8 from 1966. None of these is a clean climate signal. The long windows mix in the observing change, and the satellite-era window starts in the quiet 1970s and ends in an active phase. Studies that adjust for missed storms find little long-term trend in Atlantic storm numbers, and a clearer rise in the share that become intense.
How the observing system changed
Until the 1940s, Atlantic storms were known from ship logs, island and coastal stations, and damage. Aircraft reconnaissance began during the Second World War and became routine in the late 1940s, which brought measured central pressures and eye positions for storms near land. Weather satellites provided pictures from the 1960s, and complete geostationary coverage of the basin dates from about 1966, the usual start of the "satellite era". Later additions improved intensity estimates more than detection: the Dvorak technique (1970s), microwave imagers and scatterometers (1990s–2000s) and dropsondes.
The Atlantic Hurricane Reanalysis Project has revised the early record, adding storms found in ship logs and correcting intensities, but it cannot add storms nobody saw.
Working with the long record
- Duration filters. Counting only storms that lasted 2 days or more removes the category most affected by detection.
- US landfalls are the most homogeneous long series in HURDAT2 and show no clear trend.
- ACE is less sensitive to short storms than counts, but early intensities over the ocean are still underestimated.
- Reanalysis releases change the early numbers. Note the HURDAT2 release date with any long-term figure.
Internal links
- Accumulated cyclone energy explained — a season measure less sensitive to short storms
- How to count US hurricane landfalls — the most complete part of the early record
- How to read HURDAT2 — the file
FAQ
Are there more hurricanes now than in the past?
The record shows more, but much of the rise in named storms comes from short-lived storms that were missed before satellites: storms lasting under 2 days went from 0.56 to 4.44 a year between 1876–1900 and 2001–2025.
When does the reliable Atlantic hurricane record begin?
For counts of all storms, around 1966, when satellite coverage of the basin became complete. For US landfalls the record is reasonably complete back to the late 1800s.