
How to Map a Hurricane Track from IBTrACS in Python
On this page
Problem statement
IBTrACS, the International Best Track Archive for Climate Stewardship, collects every tropical cyclone track from every warning agency into one dataset: position, wind, pressure and much more every three hours, back to the 1840s. It is the starting point for any map of a storm's path, a count of landfalls or a climatology. Its CSV is also 170 columns wide, has a units row under the header, mixes official six-hourly fixes with interpolated three-hourly points, and carries several agencies' estimates of the same wind — so a careless read gets the wrong intensity, the wrong time of landfall or a track that zig-zags.
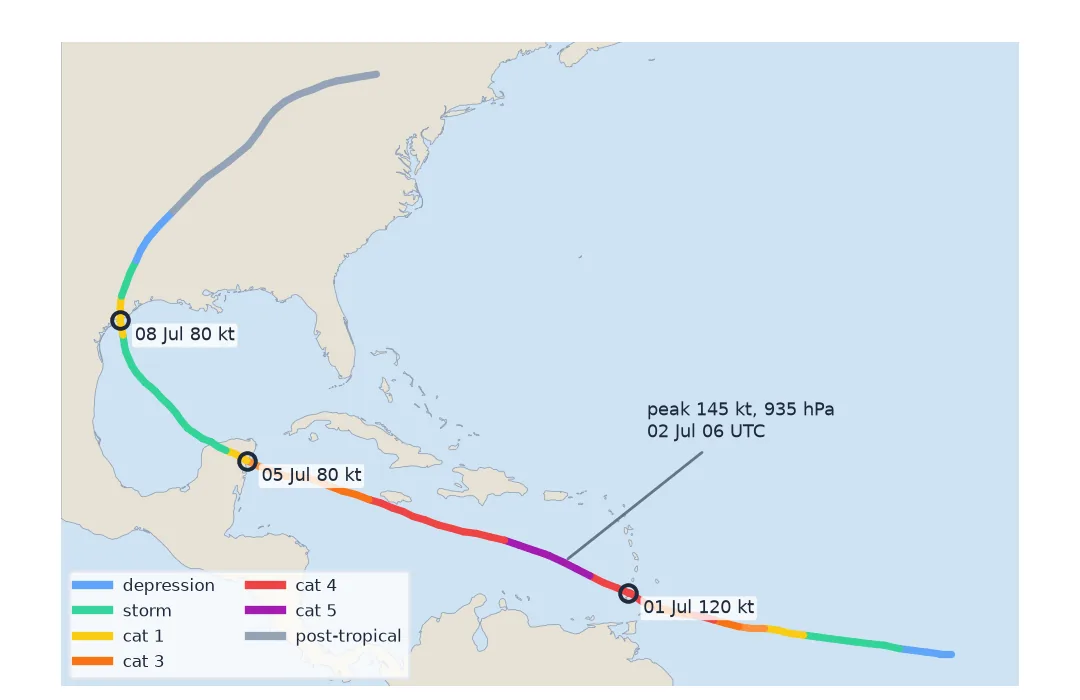
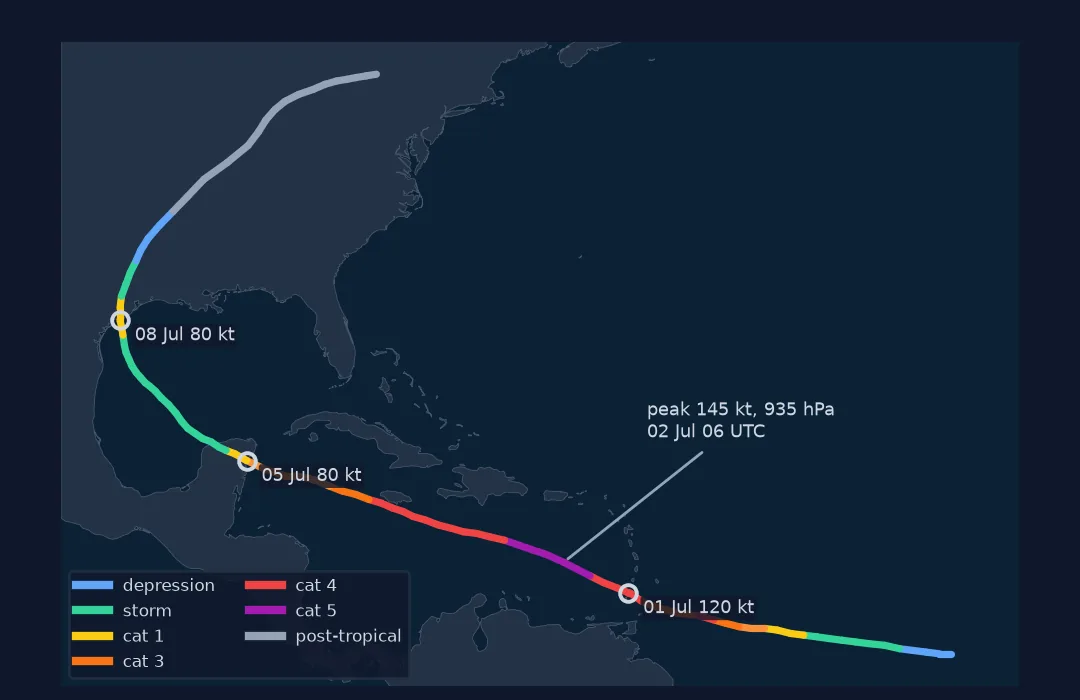
This page reads Hurricane Beryl (2024) from the North Atlantic file, maps it by Saffir–Simpson category, and extracts landfalls, peak intensity and rapid intensification.
Quick answer
Read the basin file skipping the units row, select the storm by name and season, parse the time, and use one agency's wind consistently:
d = pd.read_csv("data/ibtracs.NA.list.v04r01.csv", skiprows=[1], low_memory=False, keep_default_na=False, na_values=[" ", ""])
b = d[(d.NAME == "BERYL") & (d.SEASON == 2024)].copy()
b["time"] = pd.to_datetime(b.ISO_TIME)
for c in ("LAT", "LON", "USA_WIND", "USA_PRES", "USA_SSHS", "STORM_SPEED"):
    b[c] = pd.to_numeric(b[c])
peak = b.loc[b.USA_WIND.idxmax()]
print(f"{len(b)} points, {b.time.min():%d %b} to {b.time.max():%d %b %Y}; peak {peak.USA_WIND:.0f} kt / {peak.USA_PRES:.0f} hPa "
      f"at {peak.time:%d %b %H:%M} UTC, {peak.LAT:.1f} N {abs(peak.LON):.1f} W")
109 points, 28 Jun to 11 Jul 2024; peak 145 kt / 935 hPa at 02 Jul 06:00 UTC, 14.3 N 65.9 W
The right file, the units row, official fixes against interpolation
1. Choose the file
IBTrACS comes per basin (NA, EP, WP, NI, SI, SP, SA) or as one global file. The North Atlantic CSV is about 57 MB; the global one several hundred. Columns fall into groups: common fields (SID, NAME, ISO_TIME, LAT, LON, NATURE), WMO-agency fields (WMO_WIND, WMO_PRES), and each agency's own estimates (USA_, TOKYO_, REUNION_*…).
2. Skip the units row and keep blanks as missing
The second line of the file holds units, not data. Missing values are blank strings, and some columns contain a single space. NCEI rewrites this file every week while storms are active, so the row count below is the copy downloaded on 1 October 2026 (127,390 rows; it had 128,125 by 11 October) — yours will be larger:
print(d.shape, "| units row skipped | first SID:", d.SID.iloc[0])
print("blank USA_WIND in the file:", d.USA_WIND.isna().mean().round(3))
(127390, 174) | units row skipped | first SID: 1851175N26270
blank USA_WIND in the file: 0.148
3. Separate official fixes from interpolated points
Best tracks are issued every six hours (00, 06, 12, 18 UTC), plus special points such as landfalls. IBTrACS interpolates to every three hours and marks which points were interpolated in the IFLAG column:
synoptic = b[b.time.dt.hour.isin([0, 6, 12, 18]) & (b.time.dt.minute == 0)]
special = b[b.USA_RECORD.astype(str).str.strip().isin(["L", "I", "P", "W"])]
print(f"{len(synoptic)} six-hourly fixes, {len(special)} special records, {len(b) - len(synoptic) - len(special)} interpolated 3-hourly points")
print("intervals between points (h):", b.time.diff().dt.total_seconds().div(3600).round(2).value_counts().head(4).to_dict())
53 six-hourly fixes, 4 special records, 52 interpolated 3-hourly points
intervals between points (h): {3.0: 100, 0.33: 2, 2.67: 2, 0.75: 1}
Statistics such as rapid intensification should use the six-hourly fixes, not the interpolated points.
4. Pick one agency's wind
WMO_WIND is the official agency's estimate, but agencies average winds over different periods (1, 3 or 10 minutes). For an Atlantic storm the US agency (NHC) is the official one and uses one-minute winds; keeping to USA_WIND avoids mixing definitions. Saffir–Simpson category (USA_SSHS) is derived from it:
print(b[["USA_WIND", "USA_SSHS"]].groupby("USA_SSHS").USA_WIND.agg(["min", "max", "count"]).to_string()) min max count
USA_SSHS
-4 25.0 30.0 17
-1 25.0 33.0 8
0 35.0 60.0 29
1 65.0 80.0 11
2 85.0 95.0 8
3 98.0 110.0 11
4 113.0 135.0 18
5 138.0 145.0 7
5. Find landfalls and rapid intensification
Landfall records have USA_RECORD == "L". Rapid intensification is conventionally a 30-knot increase in 24 hours:
for _, r in b[b.USA_RECORD.astype(str).str.strip() == "L"].iterrows():
    print(f"landfall {r.time:%d %b %H:%M} UTC at {r.LAT:.1f} N {abs(r.LON):.1f} W, {r.USA_WIND:.0f} kt, category {r.USA_SSHS:.0f}")
w = synoptic.set_index("time").USA_WIND
gain = w - w.shift(4)
print(f"largest 24 h gain: {gain.max():.0f} kt ending {gain.idxmax():%d %b %H} UTC; 24 h periods at 30 kt or more: {(gain >= 30).sum()}")
landfall 01 Jul 15:20 UTC at 12.5 N 61.5 W, 120 kt, category 4
landfall 05 Jul 11:00 UTC at 20.3 N 87.4 W, 80 kt, category 1
landfall 08 Jul 08:40 UTC at 28.6 N 96.0 W, 80 kt, category 1
largest 24 h gain: 55 kt ending 30 Jun 18 UTC; 24 h periods at 30 kt or more: 8
Distance, forward speed and a GeoJSON track
The data used on this page
IBTrACS version 04r01, North Atlantic CSV, NOAA NCEI. Knapp, K. R., M. C. Kruk, D. H. Levinson, H. J. Diamond, and C. J. Neumann (2010). Coastlines: Natural Earth 1:50m land.
from pathlib import Path

import numpy as np
import pandas as pd
import requests
from pyproj import Geod

Path("data").mkdir(exist_ok=True)
URL = ("https://www.ncei.noaa.gov/data/international-best-track-archive-for-climate-stewardship-ibtracs/"
       "v04r01/access/csv/ibtracs.NA.list.v04r01.csv")
if not Path("data/ibtracs.NA.list.v04r01.csv").exists():
    Path("data/ibtracs.NA.list.v04r01.csv").write_bytes(requests.get(URL, timeout=300).content)
print(round(Path("data/ibtracs.NA.list.v04r01.csv").stat().st_size / 1e6), "MB")
57 MB
Example 1: distance and forward speed
g = Geod(ellps="WGS84")
step = [g.inv(*p, *q)[2] / 1000 for p, q in zip(zip(b.LON[:-1], b.LAT[:-1]), zip(b.LON[1:], b.LAT[1:]))]
print(f"track length {sum(step):,.0f} km; IBTrACS forward speed (STORM_SPEED, kt): median {b.STORM_SPEED.median():.0f}, "
      f"max {b.STORM_SPEED.max():.0f}")
track length 9,040 km; IBTrACS forward speed (STORM_SPEED, kt): median 16, max 31
Example 2: the track as GeoJSON for a web map
import geopandas as gpd
from shapely.geometry import LineString
seg = gpd.GeoDataFrame(
    {"time": b.time.iloc[:-1].astype(str).values, "wind_kt": b.USA_WIND.iloc[:-1].values, "sshs": b.USA_SSHS.iloc[:-1].values},
    geometry=[LineString([p, q]) for p, q in zip(zip(b.LON[:-1], b.LAT[:-1]), zip(b.LON[1:], b.LAT[1:]))], crs=4326)
seg.to_file("data/beryl_2024.geojson")
print(len(seg), "segments,", round(Path("data/beryl_2024.geojson").stat().st_size / 1000), "kB")
108 segments, 21 kB
Segments rather than one line let a web map colour each leg by category.
Example 3: how unusual was Beryl?
The whole basin file answers questions no single track can. When in the year has any Atlantic storm first reached category 5, and how quickly did Beryl get from tropical-storm strength to category 4?
all_ = d[["SID", "NAME", "ISO_TIME", "USA_SSHS"]].assign(time=pd.to_datetime(d.ISO_TIME),
                                                         USA_SSHS=pd.to_numeric(d.USA_SSHS, errors="coerce"))
first5 = all_[all_.USA_SSHS >= 5].groupby("SID").agg(name=("NAME", "first"), t=("time", "min"))
first5["doy"] = first5.t.dt.dayofyear
print(first5.sort_values("doy").head(3).assign(t=lambda x: x.t.dt.strftime("%Y-%m-%d %H UTC")).to_string())
ts = b[b.USA_WIND >= 34].time.min(); c4 = b[b.USA_SSHS >= 4].time.min()
print(f"Beryl: tropical-storm winds {ts:%d %b %H} UTC, category 4 {c4:%d %b %H} UTC - {(c4 - ts).total_seconds() / 3600:.0f} hours")
name t doy
SID
2024181N09320 BERYL 2024-07-02 00 UTC 184
2005192N11318 EMILY 2005-07-16 21 UTC 197
1980214N11330 ALLEN 1980-08-05 00 UTC 218
Beryl: tropical-storm winds 29 Jun 00 UTC, category 4 30 Jun 18 UTC - 42 hours
A best track is a post-season reanalysis
A best track is a post-season reanalysis: forecasters revisit every observation of a storm — aircraft, satellites, buoys, radar — and issue a single consistent history. IBTrACS gathers these from all agencies and adds interpolation, derived fields and metadata. The richness is the point, and also the risk: the same row holds several agencies' winds, official and interpolated positions sit side by side, and the documentation matters as much as the data.
For a single storm three choices keep the result clean. Use one agency's wind and its definition. Base rates of change on the official six-hourly fixes. And read special records — landfalls, peaks — from their flags, not by guessing from the nearest synoptic time. Beryl illustrates why the effort pays: Example 3 measures its rise from tropical-storm winds to category 4 in 42 hours and finds it the earliest category 5 in the Atlantic record by two weeks, and the landfall flags give three landfalls in a week.
Units rows, blank strings and repeated names
- Skip the units row (
skiprows=[1]). - Blank strings are missing; set
keep_default_na=False, na_values=[" ", ""]. - IFLAG and synoptic times distinguish fixes from interpolations.
- One agency's wind; WMO_WIND mixes averaging periods across basins.
- Names repeat; select by SID or by name and season.
- Longitude runs −180 to 180 in IBTrACS; tracks crossing the date line need care (see storm track crosses the date line).
Internal links
- Storm track crosses the date line — Pacific tracks
- How to read NEXRAD Level II — Beryl's landfall on radar
- How to map storm-total rainfall — the rain Beryl brought
- How to read MRMS rainfall from GRIB2 — the rainfall grids
- Rainfall return periods explained — how rare the rain was
FAQ
Where can I download hurricane tracks?
IBTrACS from NOAA NCEI, as CSV, netCDF or shapefile, by basin or globally, free.
How do I read IBTrACS in pandas?
pd.read_csv(path, skiprows=[1], keep_default_na=False, na_values=[" ", ""], low_memory=False), then filter by SID or by NAME and SEASON.
Which wind column should I use in IBTrACS?
One agency's, consistently — USA_WIND (one-minute sustained, knots) for Atlantic and East Pacific storms.
How strong was Hurricane Beryl?
In IBTrACS v04r01 Beryl peaked at 145 knots and 935 hPa on 2 July 2024 at 06 UTC, category 5, and made landfall in Texas on 8 July at 80 knots.