
ACE Comes Out Too High: Landfall Records Between Six-Hourly Fixes
On this page
Problem statement
Compute accumulated cyclone energy from HURDAT2 by summing squared winds over every row, and the 2025 Atlantic season comes out at 135.8 instead of 130.8. Earlier seasons are inflated by up to 26 units. The rows are not wrong. The file adds extra fixes between the regular six-hourly ones to record landfalls, intensity peaks and status changes, and ACE is defined only on the six-hourly fixes. A second mistake, leaving out the status filter, adds the energy of extratropical gales. This page shows both, which seasons and storms they affect, and a function that applies both filters.
Quick answer
Before summing, keep only rows whose time is 00:00, 06:00, 12:00 or 18:00 UTC and whose status is TS, HU or SS, with wind of at least 35 kt. Filtering on the record identifier is not enough, because some synoptic fixes also carry an L.
strong = hd.status.isin(["TS", "HU", "SS"]) & (hd.wind >= 35)
all_rows = (hd.wind[strong] ** 2).groupby(hd.season[strong]).sum() / 1e4
right = (hd.wind[strong & hd.synoptic] ** 2).groupby(hd.season[strong & hd.synoptic]).sum() / 1e4
print(f"2025 ACE: {all_rows[2025]:.1f} from every row, {right[2025]:.1f} from six-hourly fixes only")
2025 ACE: 135.8 from every row, 130.8 from six-hourly fixes only
Summing every qualifying row gives 135.8 for 2025, and the six-hourly fixes alone give 130.8. The extra five units come from just six rows.
Extra fixes and extra statuses
1. What the extra rows are
extra = hd[~hd.synoptic]
print(f"non-synoptic rows: {len(extra):,}; record identifiers: {extra.record.value_counts().to_dict()}")
print(f"in 2025: {(~hd.synoptic & (hd.season == 2025)).sum()}, e.g.",
      extra[extra.season == 2025][["name", "time", "record", "wind"]].head(3).values.tolist())
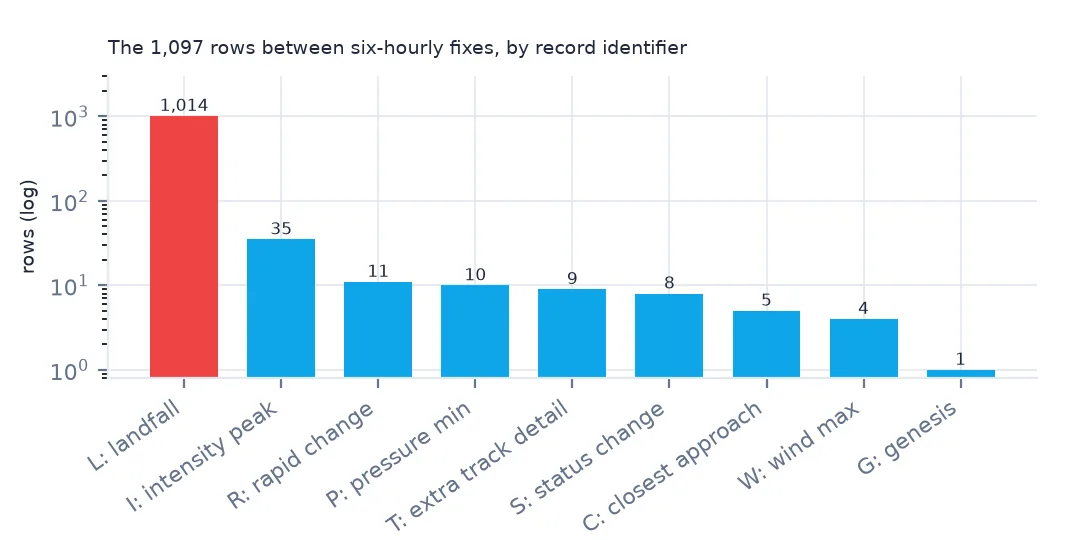
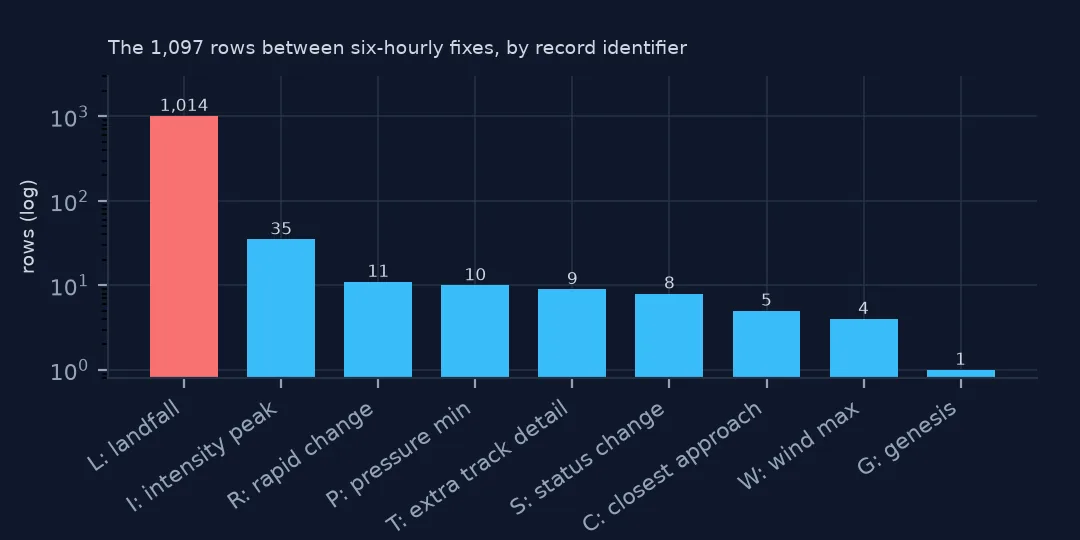
non-synoptic rows: 1,097; record identifiers: {'L': 1014, 'I': 35, 'R': 11, 'P': 10, 'T': 9, 'S': 8, 'C': 5, 'W': 4, 'G': 1}
in 2025: 6, e.g. [['BARRY', Timestamp('2025-06-30 02:00:00'), 'L', 30], ['CHANTAL', Timestamp('2025-07-06 08:00:00'), 'L', 45], ['MELISSA', Timestamp('2025-10-28 17:25:00'), 'L', 160]]
There are 1,097 non-synoptic rows in the file, 1,014 of them landfalls and the rest intensity peaks (I), pressure minima (P), status changes and similar events. In 2025 there are six, including Melissa's landfall in Jamaica at 17:25 UTC and 160 kt. Counted, that single row would add as much energy as several of the season's tropical storms did in their whole lives.
2. Which seasons are inflated most
diff = (all_rows - right).reindex(right.index)
print("largest overcounts:", diff.sort_values(ascending=False).head(5).round(2).to_dict())
print(f"seasons affected: {(diff > 0).sum()} of {len(right)}; mean overcount since 2000 {diff.loc[2000:].mean():.2f}")
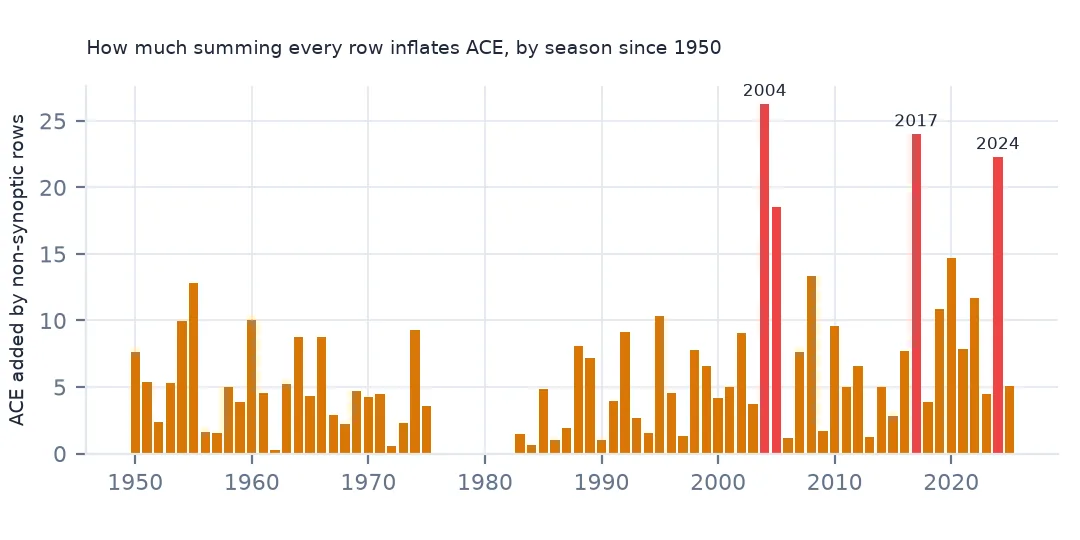
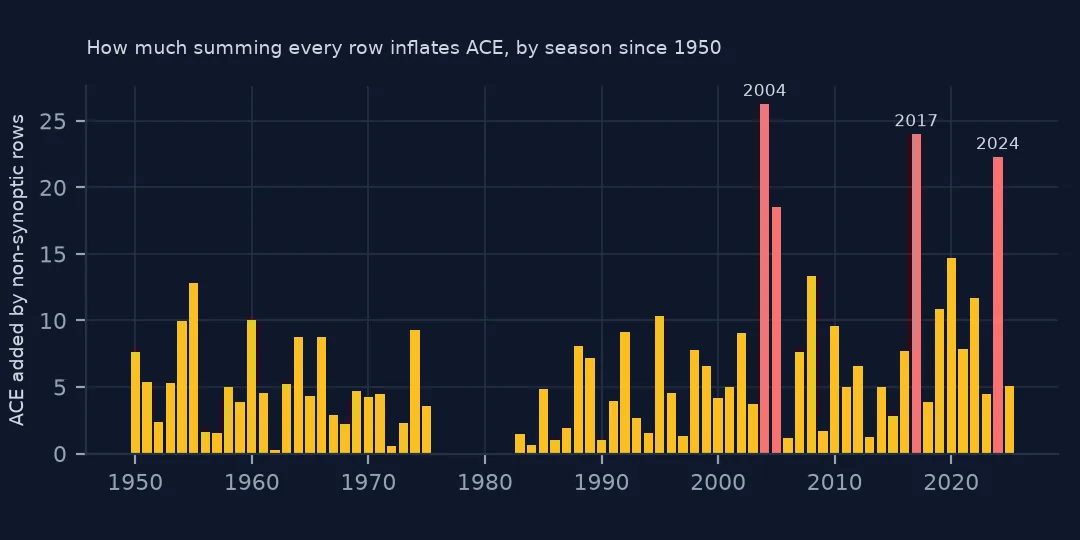
largest overcounts: {2004: 26.27, 2017: 24.0, 2024: 22.28, 2005: 18.52, 2020: 14.66}
seasons affected: 162 of 175; mean overcount since 2000 8.97
The overcount is largest in busy landfall seasons: 26.27 units in 2004, when four hurricanes hit Florida, 24.0 in 2017 and 22.28 in 2024. 162 of 175 seasons are affected, by 8.97 units on average since 2000. That is enough to move a season across NOAA's threshold between near normal and above normal.
3. Status matters too
wide = hd.synoptic & (hd.wind >= 35)
loose = (hd.wind[wide] ** 2).groupby(hd.season[wide]).sum() / 1e4
print(f"2025 including extratropical and low stages: {loose[2025]:.1f} (vs {right[2025]:.1f})")
print("statuses that add energy:", hd[wide & ~hd.status.isin(["TS", "HU", "SS"])].status.value_counts().to_dict())
2025 including extratropical and low stages: 155.7 (vs 130.8)
statuses that add energy: {'EX': 5240, 'LO': 211, 'DB': 92, 'WV': 17}
Dropping the status filter (keeping all six-hourly fixes of at least 35 kt) raises 2025 to 155.7. The extra energy is mostly extratropical stages (EX, 5,240 fixes in the whole record), plus remnant lows, disturbances and waves. ACE measures tropical and subtropical cyclone activity, so those stages do not belong in it.
Per storm, and a function to reuse
The data used on this page
The National Hurricane Center's HURDAT2 Atlantic best-track file, 1851–2025.
from pathlib import Path

import geopandas as gpd
import numpy as np
import pandas as pd
import requests

Path("data").mkdir(exist_ok=True)
# NOAA National Hurricane Center HURDAT2 best tracks: Atlantic 1851-2025 (released 23 September 2026) and
# north-east and north-central Pacific 1949-2025 (29 September 2026). NHC keeps every release under its own name.
FILES = ["hurdat2-1851-2025-092326.txt", "hurdat2-nepac-1949-2025-092926.txt"]
for name in FILES:
    if not Path(f"data/{name}").exists():
        Path(f"data/{name}").write_bytes(requests.get(f"https://www.nhc.noaa.gov/data/hurdat/{name}", timeout=300).content)

COLS = ["date", "time", "record", "status", "lat", "lon", "wind", "pressure"] + \
       [f"r{kt}_{q}" for kt in (34, 50, 64) for q in ("ne", "se", "sw", "nw")] + ["rmw"]


def read_hurdat2(path):
    """One header line per storm (id, name, number of fixes), then one line per fix; -999 means missing."""
    rows = []
    for line in open(path):
        f = [x.strip() for x in line.split(",")]
        if f[0][:2].isalpha():
            sid, name = f[0], f[1]
            continue
        rows.append([sid, name] + f[:21])
    h = pd.DataFrame(rows, columns=["sid", "name"] + COLS)
    h["time"] = pd.to_datetime(h.date + h.time, format="%Y%m%d%H%M")
    h["lat"] = h.lat.str[:-1].astype(float) * np.where(h.lat.str[-1] == "S", -1, 1)
    h["lon"] = h.lon.str[:-1].astype(float) * np.where(h.lon.str[-1] == "W", -1, 1)
    for c in COLS[6:]:
        h[c] = pd.to_numeric(h[c]).replace(-999, np.nan)
    h["season"] = h.sid.str[-4:].astype(int)
    h["synoptic"] = h.time.dt.strftime("%H%M").isin(["0000", "0600", "1200", "1800"])
    return h.drop(columns="date")


hd = read_hurdat2("data/hurdat2-1851-2025-092326.txt")
print(f"HURDAT2 Atlantic: {hd.sid.nunique():,} storms, {len(hd):,} fixes, {hd.season.min()}-{hd.season.max()}")
HURDAT2 Atlantic: 1,988 storms, 55,524 fixes, 1851-2025
Example 1: per storm in 2025
def storm_ace(mask):
    return (hd.wind[mask] ** 2).groupby(hd.sid[mask]).sum() / 1e4


t = pd.DataFrame({"name": hd.groupby("sid").name.first(), "every_row": storm_ace(strong), "synoptic": storm_ace(strong & hd.synoptic),
                  "with_ex": storm_ace(wide)}).dropna(subset=["synoptic"])
t = t[t.index.str.endswith("2025")]
print(t.round(2).sort_values("synoptic", ascending=False).to_string())
name every_row synoptic with_ex
sid
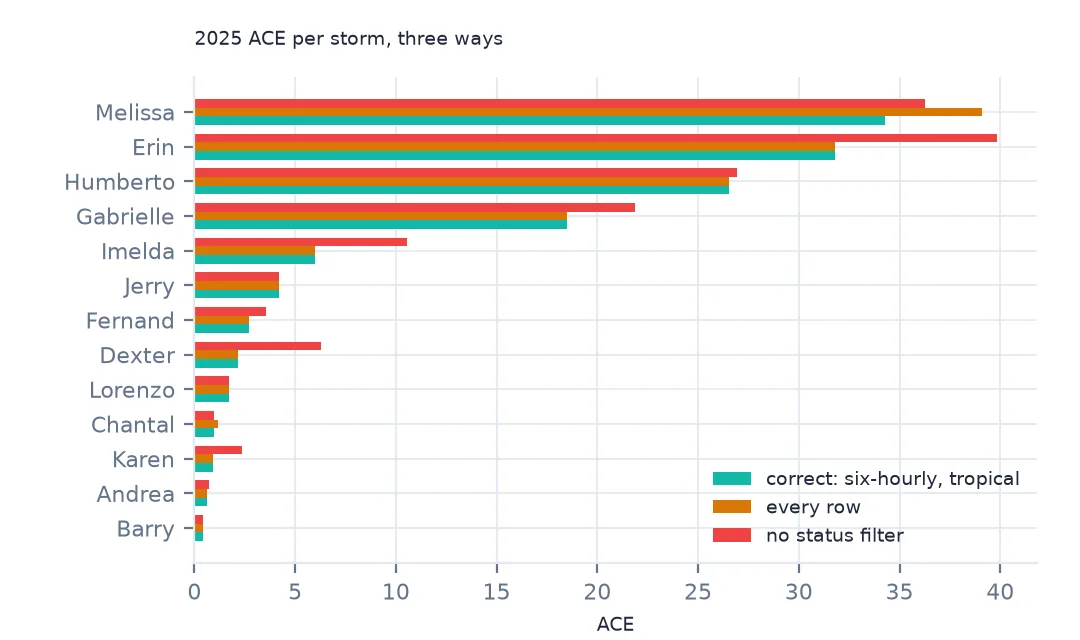
AL132025 MELISSA 39.12 34.28 36.24
AL052025 ERIN 31.77 31.77 39.82
AL082025 HUMBERTO 26.53 26.53 26.95
AL072025 GABRIELLE 18.48 18.48 21.88
AL092025 IMELDA 5.99 5.99 10.55
AL102025 JERRY 4.21 4.21 4.21
AL062025 FERNAND 2.73 2.73 3.54
AL042025 DEXTER 2.15 2.15 6.29
AL122025 LORENZO 1.72 1.72 1.72
AL032025 CHANTAL 1.18 0.98 0.98
AL112025 KAREN 0.92 0.92 2.36
AL012025 ANDREA 0.61 0.61 0.74
AL022025 BARRY 0.40 0.40 0.40
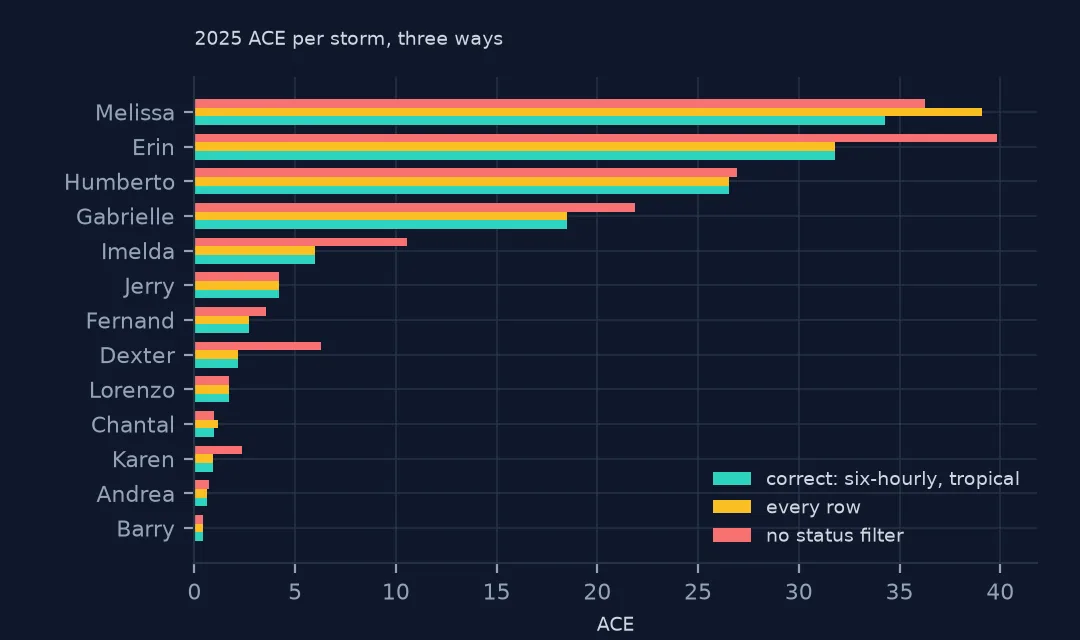
Per storm, only Melissa and Chantal change with the extra rows: Melissa from 34.28 to 39.12, because three of its landfalls were at hurricane strength, and Chantal from 0.98 to 1.18. The status filter matters for more storms. Erin's long extratropical phase would add 8 units, Imelda's would nearly double its total (5.99 to 10.55), and Dexter's ACE would almost triple.
Example 2: a guard for any ACE function
def ace_by_season(h):
    m = h.time.dt.strftime("%H%M").isin(["0000", "0600", "1200", "1800"]) & h.status.isin(["TS", "HU", "SS"]) & (h.wind >= 35)
    return (h.wind[m] ** 2).groupby(h.season[m]).sum() / 1e4


check = ace_by_season(hd)
print(f"2005 {check[2005]:.1f}, 2024 {check[2024]:.1f}, 2025 {check[2025]:.1f}")
2005 250.1, 2024 161.6, 2025 130.8
The function applies both filters and reproduces the season totals of the concept page: 250.1 for 2005, 161.6 for 2024 and 130.8 for 2025. Compute from the time column rather than a synoptic flag so the function works on any HURDAT2 or IBTrACS table.
Why the definition uses six-hourly fixes
ACE is a sum over time. Each six-hourly fix stands for six hours of the storm's life, so the sum is proportional to the integral of the squared wind over its lifetime. An extra row at 17:25 is not another six hours: it is a snapshot added for the record, and counting it adds time the storm did not spend. The best track stays on the six-hourly schedule precisely so that sums like this work. The extra rows are annotations, kept because landfall times and peak intensities matter in their own right.
The same logic applies to anything that integrates over time: hours at hurricane strength, power dissipation index, or distance travelled from fix-to-fix speeds.
Checks before publishing an ACE figure
- Compare with a published value. NOAA and Colorado State publish season ACE; a mismatch of several units usually means the extra rows were counted.
- Season, not year. Group by the season in the storm ID, not by the year of each fix.
- Subtropical storms are included in NOAA's ACE. Check whether the series you compare with counts them.
Internal links
- Accumulated cyclone energy explained — what the number means
- How to read HURDAT2 — record identifiers and status codes
- How to find rapid intensification — another calculation that needs the six-hourly fixes
FAQ
Why is my ACE calculation higher than NOAA's?
Most likely because you summed every HURDAT2 row, including landfall and other extra fixes between the six-hourly ones, or included extratropical stages. For 2025, every row gives 135.8 and the correct sum 130.8.
Should landfall records be included in ACE?
No. Only the 00, 06, 12 and 18 UTC fixes count. Landfall rows are extra snapshots and would add time the storm did not spend.