
How to Compare Air Temperature with Land Surface Temperature in Python
On this page
Problem statement
Heat warnings, health studies and comfort thresholds are written in air temperature, measured in a ventilated screen about two metres above short grass. Satellite heat maps show land surface temperature — the skin of roofs, roads and fields. The two are related and very different: on a summer morning the surface can be 15–25 °C hotter than the air above it, and the gap depends on what the surface is. Using LST as if it were air temperature overstates heat by a large and variable amount.
Pairing the two on the same days, at the same places and the same times, shows how large the gap is and what drives it.
Quick answer
Read hourly station observations from NOAA's Integrated Surface Database, sample LST at each station on clear overpass days, and compare:
import io, requests, numpy as np, pandas as pd, rasterio, pystac_client, planetary_computer
from rasterio.warp import transform

STATIONS = {"08221099999": "Barajas airport", "08223099999": "Cuatro Vientos airfield",
            "08224099999": "Getafe air base"}

def isd(station, year=2023):
    df = pd.read_csv(f"https://noaa-global-hourly-pds.s3.amazonaws.com/{year}/{station}.csv",
                     usecols=["DATE", "LATITUDE", "LONGITUDE", "TMP"], low_memory=False)
    val, flag = df.TMP.str.split(",", expand=True).T.values
    t = pd.to_numeric(val, errors="coerce") / 10
    ok = (np.abs(t) < 90) & np.isin(flag, ["0", "1", "4", "5", "9", "A", "C", "I", "M", "P", "R", "U"])
    s = pd.Series(np.where(ok, t, np.nan), index=pd.to_datetime(df.DATE).dt.tz_localize("UTC"))
    return s.dropna().groupby(level=0).mean(), df.LATITUDE.iloc[0], df.LONGITUDE.iloc[0]

cat = pystac_client.Client.open("https://planetarycomputer.microsoft.com/api/stac/v1")
scenes = [i for i in cat.search(collections=["landsat-c2-l2"], bbox=[-3.80, 40.30, -3.55, 40.47],
                                datetime="2023-06-01/2023-08-31").items()
          if i.properties["platform"] in ("landsat-8", "landsat-9") and i.properties["eo:cloud_cover"] < 20]

rows = []
for sid, name in STATIONS.items():
    air, lat, lon = isd(sid)
    for it in scenes:
        with rasterio.open(planetary_computer.sign(it.assets["lwir11"].href)) as st, \
             rasterio.open(planetary_computer.sign(it.assets["qa_pixel"].href)) as qa:
            x, y = transform("EPSG:4326", st.crs, [lon], [lat])
            dn = next(st.sample([(x[0], y[0])]))[0]
            q = int(next(qa.sample([(x[0], y[0])]))[0])
        if dn == 0 or (q >> 3) & 1 or (q >> 1) & 1:
            continue
        near = air[(air.index > it.datetime - pd.Timedelta("45min")) &
                   (air.index < it.datetime + pd.Timedelta("45min"))]
        if len(near):
            rows.append({"station": name, "date": it.datetime.date(),
                         "LST": dn * 0.00341802 + 149.0 - 273.15, "air": near.mean()})
pairs = pd.DataFrame(rows)
pairs["gap"] = pairs.LST - pairs.air
print(f"{len(pairs)} station-overpass pairs, overpass ≈ {scenes[0].datetime:%H:%M} UTC")
print(pairs.groupby("station")[["air", "LST", "gap"]].agg(["mean", "count"]).round(1).to_string())
22 station-overpass pairs, overpass ≈ 10:55 UTC
air LST gap
mean count mean count mean count
station
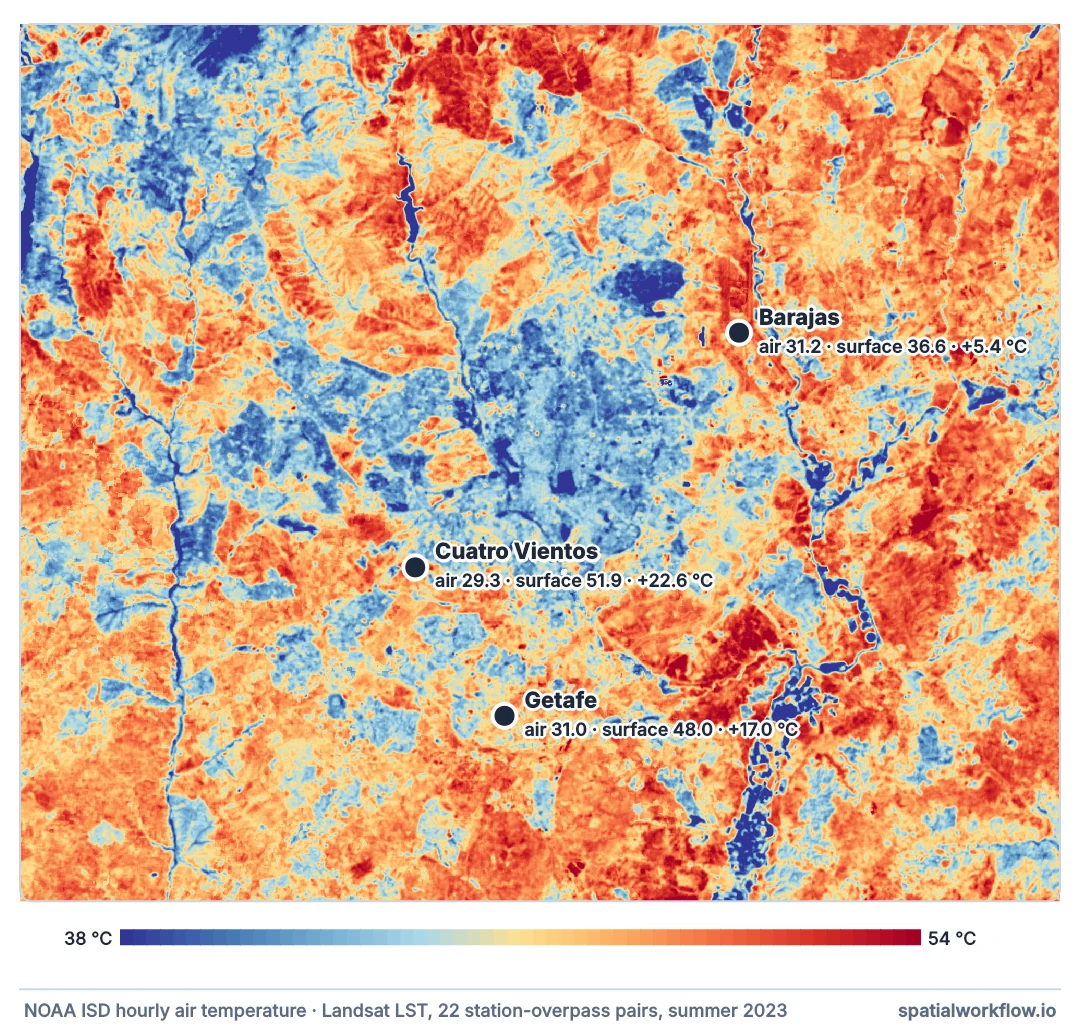
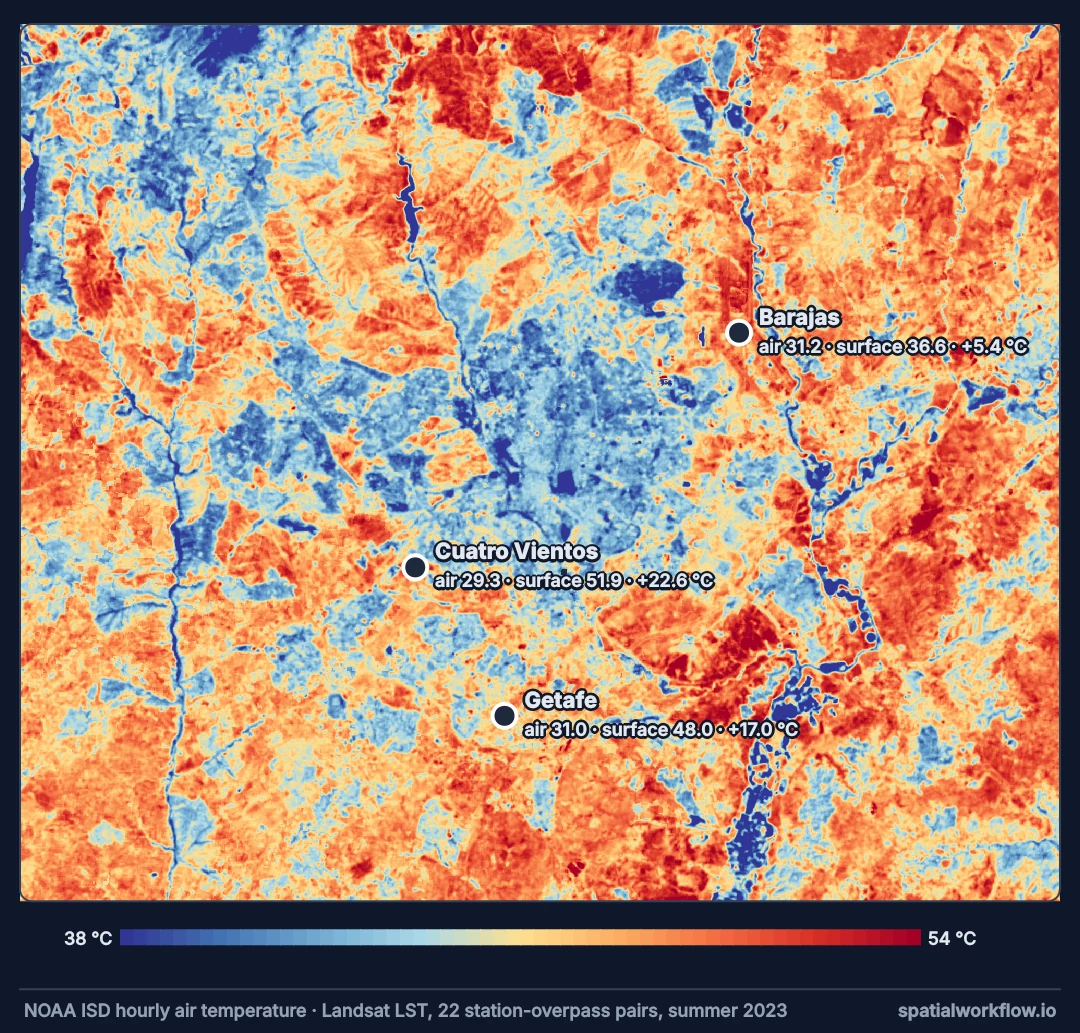
Barajas airport 31.2 7 36.6 7 5.4 7
Cuatro Vientos airfield 29.3 7 51.9 7 22.6 7
Getafe air base 31.0 8 48.0 8 17.0 8
At every station the surface is hotter than the air at the late-morning overpass, but by very different amounts: 5 °C at Barajas, 17 °C at Getafe, 23 °C at Cuatro Vientos, with air temperatures within two degrees of each other. The gap is a property of what surrounds each thermometer, not a constant offset.
Observations, decoded fields, matched time and place
1. Use observations, not model output
Some station-data services fill gaps with forecasts and label them only in a source column. NOAA's ISD holds the reported observations (METAR and SYNOP) with quality flags.
2. Decode the temperature field
ISD's TMP is "+0260,1": tenths of a degree and a quality code. +9999 is missing. Keep only accepted quality codes.
3. Match time and place
Landsat 8/9 pass Madrid shortly before 11:00 UTC. Average air temperature within ±45 minutes of the scene time, and sample the LST pixel at the station coordinates.
4. Mask clouds at the station pixel
A cloud over the station makes LST cold for that day and says nothing about the relationship.
5. Interpret by surface
Airfield stations sit on grass among runways. The LST pixel at the station includes both; the difference to air temperature reflects that mixture.
How well LST tracks air temperature
Example 1 — how well does LST track air temperature?
for name, g in pairs.groupby("station"):
    if len(g) >= 4:
        r = np.corrcoef(g.air, g.LST)[0, 1]
        print(f"{name:<24} {len(g)} days, r = {r:.2f}, gap {g.gap.min():.1f}–{g.gap.max():.1f} °C")
Barajas airport 7 days, r = 0.94, gap 3.7–7.0 °C
Cuatro Vientos airfield 7 days, r = 0.83, gap 20.5–26.6 °C
Getafe air base 8 days, r = 0.79, gap 13.4–21.3 °C
Across clear summer days LST and air temperature rise and fall together at each site, but the gap swings by several degrees from day to day with wind, soil moisture and sun.
Example 2 — the daily cycle the satellite misses
air, _, _ = isd("08221099999")
jja = air[(air.index.month >= 6) & (air.index.month <= 8)]
hourly = jja.groupby(jja.index.hour).mean()
print(f"Barajas summer 2023: coolest hour {hourly.idxmin():02d} UTC ({hourly.min():.1f} °C), "
      f"warmest {hourly.idxmax():02d} UTC ({hourly.max():.1f} °C)")
print(f"at the ~11 UTC overpass: {hourly.loc[11]:.1f} °C — "
      f"{hourly.max() - hourly.loc[11]:.1f} °C below the afternoon peak")
Barajas summer 2023: coolest hour 05 UTC (18.9 °C), warmest 16 UTC (33.2 °C)
at the ~11 UTC overpass: 30.0 °C — 3.2 °C below the afternoon peak
The overpass comes hours before the air reaches its peak, and Landsat never sees the night, when urban heat matters most for sleep and health. Satellite LST is one snapshot of a daily cycle that air temperature describes in full.
Example 3 — the surface temperature spread around a station
it = scenes[0]
with rasterio.open(planetary_computer.sign(it.assets["lwir11"].href)) as st:
    air, lat, lon = isd("08221099999")
    x, y = transform("EPSG:4326", st.crs, [lon], [lat])
    r, c = st.index(x[0], y[0])
    win = st.read(1, window=((r - 16, r + 17), (c - 16, c + 17))).astype(float)
win = np.where(win == 0, np.nan, win * 0.00341802 + 149.0 - 273.15)
print(f"{it.datetime:%Y-%m-%d}: LST within ~500 m of the Barajas station "
      f"{np.nanmin(win):.1f}–{np.nanmax(win):.1f} °C")
2023-08-30: LST within ~500 m of the Barajas station 22.1–45.7 °C
Within half a kilometre of one thermometer, surfaces range over many degrees. A single air temperature represents all of them; a satellite pixel represents one mixture of them.
Why the surface is hotter, and both are needed
Why the surface is so much hotter
A surface in sun gains energy faster than it can pass it to the air. It warms until conduction, convection and radiation balance the input. Dry, dark, still surfaces reach the highest temperatures; wet or vegetated ones stay closer to the air. The air two metres up mixes heat from all surfaces around it and is buffered.
Why the relationship varies
The surface–air gap grows with sunshine and shrinks with wind and moisture. On a windy day heat is carried away and the surface stays closer to the air; after rain, evaporation cools the surface. A fixed conversion from LST to air temperature does not exist.
Why both are needed for heat studies
LST maps where surfaces heat, at high resolution, which guides greening and materials. Air temperature measures what people experience and is what health evidence uses. Air temperature maps at city scale need modelling — often with LST as one of the predictors.
Station exposure, duplicates and time zones
- Station exposure: official stations are on grass away from buildings, which is exactly not the urban surface.
- ISD duplicates: METAR (FM-15) and SYNOP (FM-12) reports can both exist for one hour; average them.
- Time zones: ISD is in UTC; Landsat metadata is in UTC.
- LST at 100 m: the station pixel mixes runway, grass and buildings; a larger window gives context.
- Night: sensors with night passes (ECOSTRESS, MODIS) are needed for night-time LST.
Internal links
- Land surface temperature explained — what LST is
- Heat exposure explained — why air temperature drives health effects
- How to count heatwave days — air temperature over decades
- How to read Landsat surface temperature — the LST side
- How to analyse an air quality time series — the same diurnal methods
- Air pollution meteorology explained — the boundary layer that mixes surface heat
FAQ
Is land surface temperature the same as air temperature?
No. In daytime the surface can be 15–25 °C hotter than the air above it.
Where can I get hourly station air temperature?
NOAA's Integrated Surface Database has hourly observations for thousands of stations, free and without a key.
Can I convert LST to air temperature?
Not with a fixed formula; the relationship depends on wind, moisture and surface type. Statistical models can estimate it.
Why does the satellite miss the hottest time?
Landsat passes in late morning; air temperature peaks mid-afternoon and urban heat is strongest at night.
Why are station temperatures lower than the heat map suggests?
Stations measure air over grass; heat maps show surfaces such as roofs and roads.
Which is better for heat health studies?
Air temperature, for exposure; LST for locating hot surfaces.