
How to Analyse Snow Depth from GHCN-Daily in Python
On this page
Problem statement
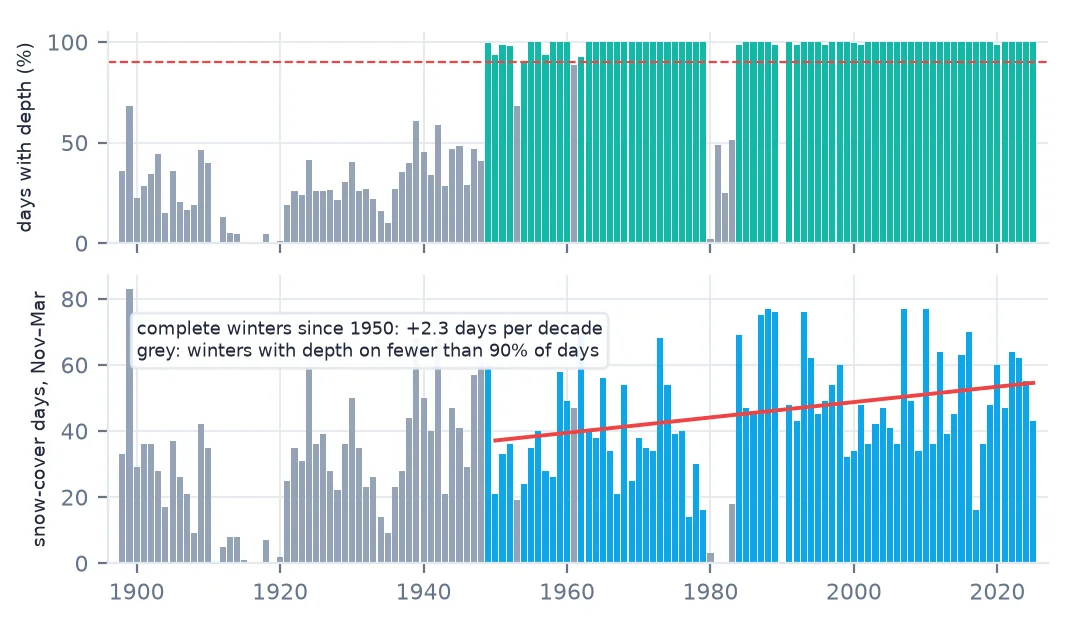
The Global Historical Climatology Network – Daily (GHCN-Daily) holds daily observations from over 100,000 stations, many with snowfall and snow depth going back more than a century. It is the record behind most "days with snow on the ground" statistics. It is also a record kept by people with rulers, and it looks like one: values recorded in tenths of a unit you have to guess, quality flags you have to read, winters where depth was not recorded at all, and zeros that may mean "no snow" or "nobody measured".
This page reads the full record for Boulder, Colorado — snowfall since 1893, snow depth since 1897 — applies the quality flags, separates complete winters from incomplete ones, and measures how many days a winter has snow on the ground and whether that has changed.
Quick answer
Read the station CSV, split the attribute string into its flags, drop values with a quality flag, keep only winters where depth was recorded nearly every day, and count snow-cover days:
d = pd.read_csv("data/USC00050848.csv", usecols=["DATE", "SNOW", "SNOW_ATTRIBUTES", "SNWD", "SNWD_ATTRIBUTES"],
                parse_dates=["DATE"], low_memory=False).set_index("DATE")
q = d["SNWD_ATTRIBUTES"].fillna(",,,").str.split(",", expand=True)[1]       # MFLAG, QFLAG, SFLAG, time
d["depth_mm"] = d["SNWD"].where(q == "")                                       # GHCN-Daily stores SNWD in mm
winter = d[d.index.month.isin([11, 12, 1, 2, 3])].copy()
winter["season"] = (winter.index + pd.DateOffset(months=3)).year
complete = winter.groupby("season").depth_mm.apply(lambda s: s.notna().mean() >= 0.9)
days = (winter.depth_mm >= 25).groupby(winter.season).sum()[complete].loc[:2025]
print(f"{complete.loc[:2025].sum()} complete winters of {complete.loc[:2025].size}; snow-cover days (>= 25 mm), Nov-Mar: "
      f"median {days.median():.0f}, range {days.min():.0f}-{days.max():.0f}")
70 complete winters of 129; snow-cover days (>= 25 mm), Nov-Mar: median 45, range 14-77
Station file, flags, no snow versus not measured
1. Get the station file
NCEI publishes one CSV per station with every element it has reported, each followed by an attribute column. The station inventory says which elements a station has and for which years:
inv = pd.read_fwf("data/ghcnd-inventory.txt", widths=[11, 9, 10, 5, 5, 5],
                  names=["id", "lat", "lon", "element", "first", "last"])
print(inv[inv.id == "USC00050848"].query("element in ['SNOW', 'SNWD', 'PRCP', 'TMAX']").to_string(index=False))
print(len(d), "days in the file,", d.index.min().date(), "to", d.index.max().date())
id lat lon element first last
USC00050848 39.9928 -105.2669 TMAX 1893 2026
USC00050848 39.9928 -105.2669 PRCP 1893 2026
USC00050848 39.9928 -105.2669 SNOW 1893 2026
USC00050848 39.9928 -105.2669 SNWD 1897 2026
47064 days in the file, 1893-10-01 to 2026-09-27
2. Read the flags
Each attribute is four comma-separated fields: measurement flag, quality flag, source flag and observation time. An empty quality flag means the value passed NCEI's checks; anything else means it failed one:
flags = d["SNWD_ATTRIBUTES"].dropna().str.split(",", expand=True)
print("quality flags on SNWD:", flags[1].replace("", "passed").value_counts().to_dict())
print(d.loc[d.SNWD.idxmax(), ["SNOW", "SNWD", "SNWD_ATTRIBUTES"]].to_dict())
quality flags on SNWD: {'passed': 29705, 'I': 12, 'G': 3, 'W': 2}
{'SNOW': 356.0, 'SNWD': 3556.0, 'SNWD_ATTRIBUTES': ',G,6,'}
The largest snow depth in the Boulder file — 3,556 mm, three and a half metres, on 28 February 1931 — carries quality flag G, a failed gross-limits check, and 356 mm of snowfall the same day. It looks like a decimal point in the wrong place. Without the flag it would be the deepest snow ever recorded on the Colorado plains.
3. Separate "no snow" from "not measured"
Depth missing on a day with snowfall is common in the early record, and some observers recorded snowfall but not depth for whole decades. A winter with half its days missing is not a winter with half its snow:
comp = winter.groupby("season").depth_mm.apply(lambda s: s.notna().mean())
print("share of Nov-Mar days with a depth value, by decade:")
print(comp.groupby(comp.index // 10 * 10).mean().loc[1890:2020].round(2).to_string())
share of Nov-Mar days with a depth value, by decade:
season
1890 0.26
1900 0.28
1910 0.07
1920 0.24
1930 0.30
1940 0.48
1950 0.94
1960 0.98
1970 1.00
1980 0.72
1990 1.00
2000 1.00
2010 1.00
2020 1.00
Before the 1950s depth was recorded on well under half of winter days, and the 1980s have a gap too. Counting snow-cover days in those winters would put fewer snow days in the past simply because fewer days were measured.
4. Count snow-cover days in complete winters
A day with at least 25 mm (one inch) on the ground is the standard "snow cover" threshold. Using only winters with depth on at least 90% of days:
recent = days.loc[1950:]
b = np.polyfit(recent.index, recent.values, 1)[0] * 10
r = stats.spearmanr(recent.index, recent.values)
print(f"{len(recent)} complete winters since 1950: median {recent.median():.0f} days, "
      f"trend {b:+.1f} days per decade, Spearman rho {r.statistic:+.2f} (p = {r.pvalue:.3f})")
69 complete winters since 1950: median 45 days, trend +2.3 days per decade, Spearman rho +0.34 (p = 0.004)
At this station the complete winters show more snow-cover days over time, not fewer — about two more per decade, with a rank correlation that is unlikely to be chance. One station cannot say why: snowier storms, colder spells after them, or a change in when and where the observer measured would all look the same in this file.
5. Cross-check with snowfall
Snowfall (SNOW) is recorded more consistently than depth and gives an independent view of each winter:
d["snow_mm"] = d["SNOW"].where(d["SNOW_ATTRIBUTES"].fillna(",,,").str.split(",", expand=True)[1] == "")
sf = d[d.index.month.isin([10, 11, 12, 1, 2, 3, 4, 5])]
season_snow = sf.snow_mm.groupby((sf.index + pd.DateOffset(months=3)).year).sum(min_count=200)
both = pd.concat({"snow-cover days": days, "seasonal snowfall (mm)": season_snow}, axis=1).dropna().loc[1950:]
print(both.corr(method="spearman").iloc[0, 1].round(2), "rank correlation over", len(both), "winters")
0.67 rank correlation over 68 winters
Boulder's snow comes in large storms that melt within days in the dry, sunny air east of the mountains, so seasonal snowfall and days with snow on the ground are related but far from interchangeable.
What ignoring flags and gaps does
The data used on this page
NOAA NCEI Global Historical Climatology Network – Daily, version 3, station USC00050848 (Boulder, Colorado), per-station CSV and the station inventory. Menne, M.J., I. Durre, R.S. Vose, B.E. Gleason, and T.G. Houston, 2012: An overview of the Global Historical Climatology Network-Daily Database. Values used here end with winter 2024–25.
from pathlib import Path

import numpy as np
import pandas as pd
import requests
from scipy import stats

Path("data").mkdir(exist_ok=True)
BASE = "https://www.ncei.noaa.gov"
for url, name in ((f"{BASE}/data/global-historical-climatology-network-daily/access/USC00050848.csv", "USC00050848.csv"),
                  (f"{BASE}/pub/data/ghcn/daily/ghcnd-inventory.txt", "ghcnd-inventory.txt")):
    if not Path(f"data/{name}").exists():
        # Both files grow daily: the lengths and flag counts on this page are the 2026-10-01 copies.
        Path(f"data/{name}").write_bytes(requests.get(url, timeout=300).content)
print({p.name: f"{p.stat().st_size / 1e6:.1f} MB" for p in Path("data").iterdir()})
{'USC00050848.csv': '9.1 MB', 'ghcnd-inventory.txt': '36.0 MB'}
Example 1: what happens if you ignore the flags and the gaps
The same count with every value used and every winter included:
naive_w = d[d.index.month.isin([11, 12, 1, 2, 3])]
naive = (naive_w.SNWD >= 25).groupby((naive_w.index + pd.DateOffset(months=3)).year).sum().loc[1898:2025]
print(f"naive: median {naive.median():.0f} days; 1898-1937 median {naive.loc[:1937].median():.0f}, "
      f"1950-2025 median {naive.loc[1950:].median():.0f}")
print(f"naive trend 1898-2025: {np.polyfit(naive.index, naive.values, 1)[0] * 10:+.1f} days per decade")
naive: median 36 days; 1898-1937 median 26, 1950-2025 median 43
naive trend 1898-2025: +2.4 days per decade
The naïve series gives the early winters a median of 26 snow-cover days against 43 since 1950 — a difference made mostly of missing measurements. Its century-long trend looks like the complete-winter trend since 1950, but for the wrong reason: one is the climate of this site, the other the history of its paperwork.
Example 2: the first and last snow cover of each winter
w = d[d.index.month.isin([9, 10, 11, 12, 1, 2, 3, 4, 5, 6])].copy()
w["season"] = (w.index + pd.DateOffset(months=3)).year
cover = w[w.depth_mm >= 25]
first = cover.groupby("season").apply(lambda g: g.index.min())
last = cover.groupby("season").apply(lambda g: g.index.max())
ok = complete[complete].index.intersection(first.index)
span = (last[ok] - first[ok]).dt.days
print(f"first cover, median: {pd.Series([t.strftime('%m-%d') for t in first[ok]]).sort_values().iloc[len(ok) // 2]}; "
      f"last, median: {pd.Series([t.strftime('%m-%d') for t in last[ok]]).sort_values().iloc[len(ok) // 2]}; "
      f"median span {span.median():.0f} days")
first cover, median: 10-30; last, median: 04-19; median span 168 days
The span from first to last snow cover is far longer than the number of snow-cover days: Boulder's snow comes and goes all winter.
An archive of observations
GHCN-Daily is an archive of observations, and its structure follows how they were made. Cooperative observers measured snowfall and snow depth once a day with a ruler; their records were digitised decades later; and NCEI applies automated checks that flag, but do not remove, suspicious values. The data model keeps every value with four flags, and the analysis has to read them.
Three kinds of problem follow, each with its own fix. Bad values — a misplaced decimal, a transposed digit — carry quality flags and should be dropped. Missing values are absences, not zeros, and the share of missing days changes over a station's history, so statistics must be limited to periods where the record is complete enough. And true zeros are information: a day with no snow on the ground is a measurement, and it is what makes snow-cover days countable at all.
Once those are handled, a long station record supports careful statements about its own site. Boulder's complete winters since 1950 give a median of 45 days with an inch of snow on the ground and an increase of about two days per decade. That is a statement about one station, whose observation time and exposure may have changed in ways the file does not record; before it is generalised, the station history and neighbouring stations need checking.
Units, missing values and station moves
- SNWD and SNOW are in millimetres in the NCEI CSV; the "T" measurement flag marks a trace.
- Quality flags in the second attribute field: drop anything non-empty.
- Missing is not zero. Count only winters with near-complete records.
- Observation time changed at many stations; a morning reading and an evening one differ by a day of melt.
- Station moves are not in the file; check the station history before a long trend.
- The per-station CSV changes daily; fix an end date.
Internal links
- Snow depth has gaps and zeros — the cleaning problems in detail
- How to analyse SNOTEL snow water equivalent — automated mountain stations
- Snow water equivalent explained — depth versus water
- How to analyse a sea-ice extent time series — another record with seams
- How to make a MODIS snow cover time series — snow cover from space
FAQ
How do I download GHCN-Daily data for one station?
NCEI serves a CSV per station at https://www.ncei.noaa.gov/data/global-historical-climatology-network-daily/access/<ID>.csv, with all elements and their attribute flags.
What units are GHCN-Daily snow depth and snowfall in?
Millimetres in the per-station CSV files (the original .dly files use the same units for SNOW and SNWD).
What do the GHCN-Daily flags mean?
Each value has a measurement flag (e.g. T for trace), a quality flag (empty if it passed all checks, a letter naming the failed check otherwise), a source flag, and the observation time.
How many days a year does Boulder have snow on the ground?
In complete winters since 1950, a median of 45 days from November to March with at least 25 mm on the ground, increasing by about two days per decade at this station.