
Building Permit Estimates Explained: Reported Against Imputed Units
On this page
Problem statement
Every Census Bureau permit file carries each count twice. The first twelve numeric columns are estimates: what permit-issuing places reported, plus imputed figures for places that did not report for some months or at all. The last twelve, marked rep, are what was actually reported. Most analyses use the estimates without knowing it, and most of the time that is right, but the imputed share is not small, it varies by state and county, and in some counties it is everything. This page measures how much of the 2025 file is imputed, where, and whether it changes a ranking.
Quick answer
Compare the estimate columns with the rep columns:
print(f"2025: estimate {y25.units.sum():,} units, reported {y25.reported.sum():,}; imputed {1 - y25.reported.sum() / y25.units.sum():.1%}")2025: estimate 1,431,616 units, reported 1,298,881; imputed 9.3%
Of the 1,431,616 units in the 2025 estimates, 1,298,881 were reported; 9.3% were imputed.
Where the imputation sits
1. Year by year
years = pd.concat([permits(f"co{y}a.txt").assign(year=y) for y in range(1990, 2026)], ignore_index=True)
t = years.groupby("year")[["units", "reported"]].sum()
t["imputed"] = 1 - t.reported / t.units
print(t.imputed.loc[[1990, 1995, 2000, 2002, 2003, 2004, 2010, 2018, 2019, 2020, 2024, 2025]].map("{:.1%}".format).to_string())
year
1990 2.1%
1995 5.8%
2000 4.7%
2002 5.0%
2003 0.0%
2004 5.3%
2010 7.0%
2018 8.4%
2019 5.2%
2020 9.8%
2024 9.6%
2025 9.3%
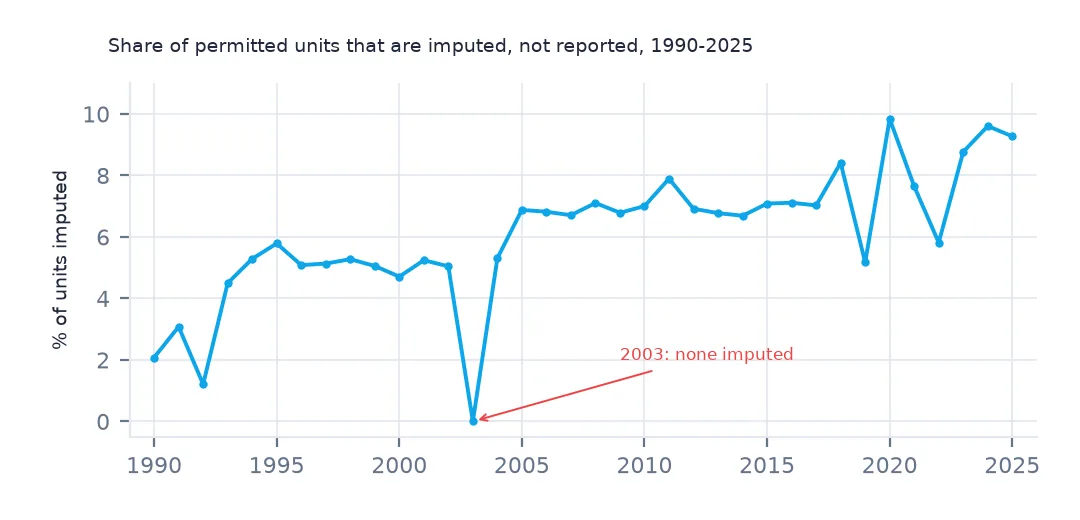
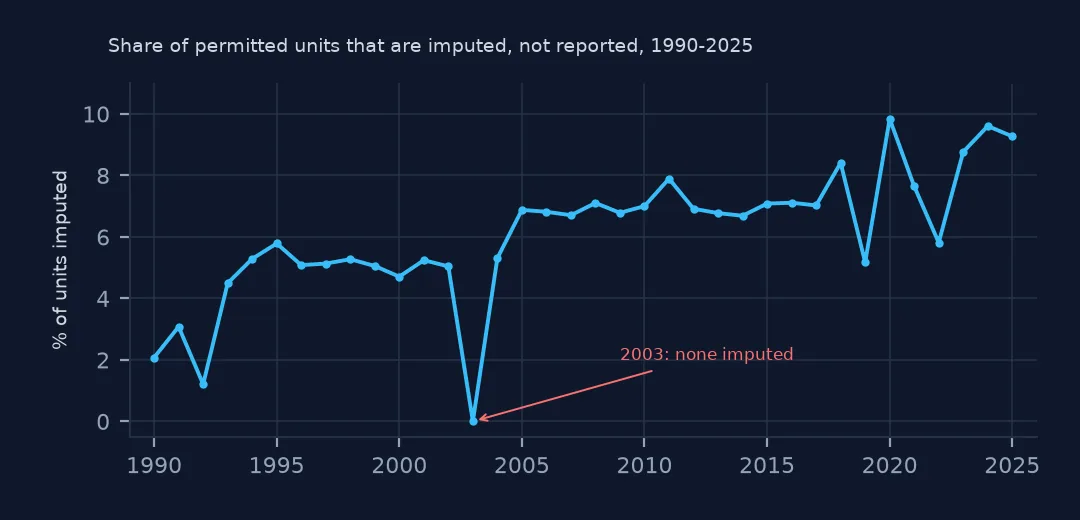
The imputed share has crept up, from 2.1% in 1990 to 9.8% in 2020 and 9.3% in 2025. 2003 is the exception: the estimate and reported columns are identical in every county that year, so that file carries no imputation at all, and a series of reported units has a step there.
2. By county: mostly reported, a few mostly estimated
c = y25[y25.units > 0].copy()
c["imp"] = 1 - c.reported / c.units
print(pd.cut(c.imp, [-.001, 0, .1, .5, .999, 1], labels=["none", "under 10%", "10-50%", "50-99%", "all"]).value_counts(sort=False).to_string())
print(f"units in fully imputed counties: {c[c.reported == 0].units.sum():,}")
imp
none 1462
under 10% 431
10-50% 459
50-99% 216
all 213
units in fully imputed counties: 17,031
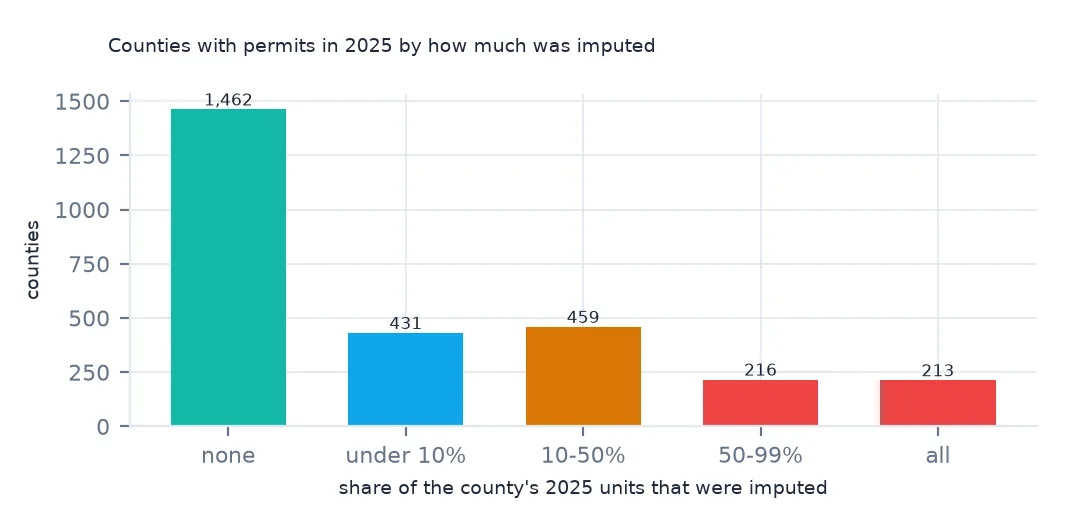
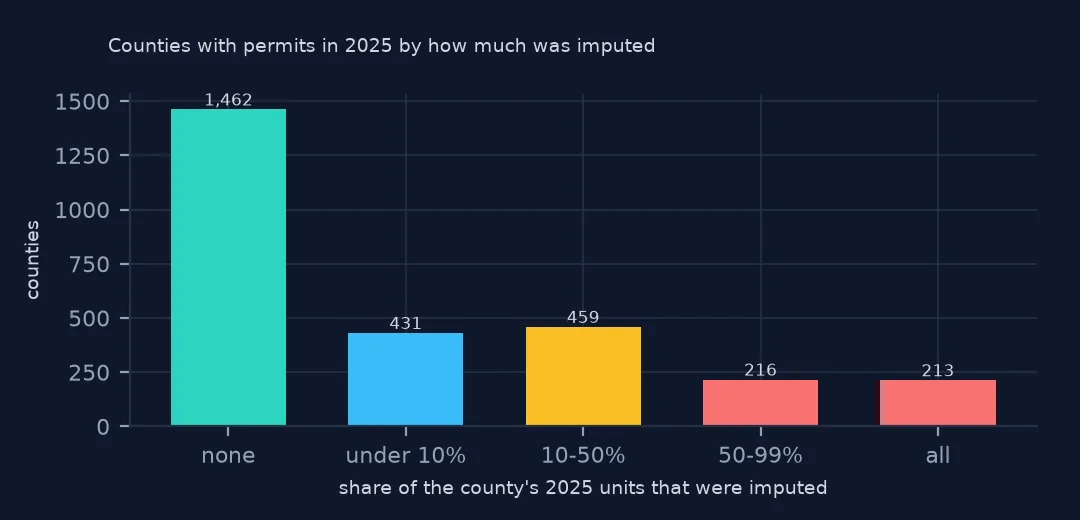
1,462 counties with permits in 2025 had nothing imputed. At the other end, 216 were mostly and 213 entirely imputed, 17,031 units in counties where nothing was reported. Those are places whose permit offices did not respond, and their numbers are the Bureau's model, not a count.
3. By state
names = pop.drop_duplicates("STATE").set_index("STATE").STNAME
s = y25.groupby("state")[["units", "reported"]].sum()
s.index = s.index.map(names)
s["imputed"] = 1 - s.reported / s.units
print(s.sort_values("imputed", ascending=False).head(6).imputed.map("{:.1%}".format).to_string())
print(f"states with no imputation: {(s.imputed == 0).sum()}")
state
Hawaii 40.2%
New Jersey 33.2%
Maine 32.0%
Mississippi 25.9%
Louisiana 22.1%
Massachusetts 19.5%
states with no imputation: 1
Hawaii's 2025 total is 40.2% imputed, New Jersey's 33.2% and Maine's 32.0%. Only one state reported everything.
By size of building, and which to use
The data used on this page
The US Census Bureau's Building Permits Survey county files (annual 1990–2025 and year-to-date 2025–2026), its Northeast place files for 2020–2025, the Vintage 2025 county population estimates and the 2024 cartographic boundary counties, all public domain. They were downloaded on 16 October 2026 and saved on this site in one archive, because Census revises recent months as late reports arrive.
from pathlib import Path
import zipfile

import geopandas as gpd
import numpy as np
import pandas as pd
import requests

Path("data").mkdir(exist_ok=True)
# US Census Bureau Building Permits Survey: annual county files co1990a.txt-co2025a.txt, year-to-date county files
# co2501y.txt-co2512y.txt and co2601y.txt-co2608y.txt, Northeast place files ne2020a.txt-ne2025a.txt; the Vintage 2025
# county population estimates; 2024 cartographic boundary counties. Downloaded 16 October 2026, saved here unchanged.
# Live: https://www2.census.gov/econ/bps/County/co2025a.txt (and the same folder for the others),
# https://www2.census.gov/econ/bps/Place/Northeast%20Region/ne2025a.txt,
# https://www2.census.gov/programs-surveys/popest/datasets/2020-2025/counties/totals/co-est2025-alldata.csv,
# https://www2.census.gov/geo/tiger/GENZ2024/shp/cb_2024_us_county_20m.zip
ARCHIVE = "census-building-permits-2026-10-16.zip"
if not Path(f"data/{ARCHIVE}").exists():
    Path(f"data/{ARCHIVE}").write_bytes(requests.get(f"https://data.spatialworkflow.io/{ARCHIVE}", timeout=600).content)
Z = zipfile.ZipFile(f"data/{ARCHIVE}")

SIZES = ["1", "2", "34", "5"]  # buildings with 1 unit, 2 units, 3-4 units, 5 or more units
COLS = (["survey", "state", "county", "region", "division", "name"]
        + [f"{k}{s}_{m}" for k in ("est", "rep") for s in SIZES for m in ("bldgs", "units", "value")])


def permits(name):
    """One county file: two header rows and a blank line, then a row per county. est = estimate with
    imputation for places that did not report, rep = reported only."""
    d = pd.read_csv(Z.open(name), skiprows=3, header=None, names=COLS, skipinitialspace=True,
                    dtype={"survey": str, "state": str, "county": str, "name": str})
    d["survey"], d["name"] = d.survey.str.strip(), d.name.str.strip()
    d["state"], d["county"] = d.state.str.strip().str.zfill(2), d.county.str.strip().str.zfill(3)
    return d.assign(GEOID=d.state + d.county,
                    units=d[[f"est{s}_units" for s in SIZES]].sum(axis=1),
                    reported=d[[f"rep{s}_units" for s in SIZES]].sum(axis=1),
                    value=d[[f"est{s}_value" for s in SIZES]].sum(axis=1))


pop = pd.read_csv(Z.open("co-est2025-alldata.csv"), encoding="latin-1", dtype={"STATE": str, "COUNTY": str})
pop = pop[pop.SUMLEV == 50].assign(GEOID=lambda p: p.STATE + p.COUNTY)
Path("data/cb_2024_us_county_20m.zip").write_bytes(Z.read("cb_2024_us_county_20m.zip"))
counties = gpd.read_file("data/cb_2024_us_county_20m.zip")
counties = counties[~counties.STUSPS.isin(["AK", "HI", "PR"])].to_crs(5070)
y25 = permits("co2025a.txt")
print(f"2025 county file: {len(y25):,} rows, {y25.units.sum():,} units permitted; {len(pop):,} counties in the estimates")
2025 county file: 3,029 rows, 1,431,616 units permitted; 3,144 counties in the estimates
Example 1: single-family against apartments
for sz, lab in [("1", "1 unit"), ("2", "2 units"), ("34", "3-4 units"), ("5", "5+ units")]:
    e, r = y25[f"est{sz}_units"].sum(), y25[f"rep{sz}_units"].sum()
    print(f"{lab:9} estimate {e:>9,} reported {r:>9,} imputed {1 - r / e:.1%}")
1 unit estimate 911,903 reported 819,046 imputed 10.2%
2 units estimate 36,748 reported 33,330 imputed 9.3%
3-4 units estimate 18,993 reported 16,891 imputed 11.1%
5+ units estimate 463,972 reported 429,614 imputed 7.4%
Single-family units are more often imputed (10.2%) than units in five-plus buildings (7.4%), so a single-family series leans on the model a little more than an apartment one.
Example 2: does it change a county ranking?
c = y25.merge(pop[["GEOID", "POPESTIMATE2025"]], on="GEOID")
c = c[c.POPESTIMATE2025 >= 50_000]
a = (c.units / c.POPESTIMATE2025).rank(ascending=False)
b = (c.reported / c.POPESTIMATE2025).rank(ascending=False)
print(f"counties of 50,000+ people: {len(c):,}; rank correlation {a.corr(b, method='spearman'):.3f}; moved 50+ places: {((a - b).abs() >= 50).sum()}")
print(c.assign(moved=(a - b).abs()).nlargest(4, "moved")[["name", "units", "reported"]].to_string(index=False))
counties of 50,000+ people: 1,013; rank correlation 0.919; moved 50+ places: 448
name units reported
Sumter County 3516 0
Catoosa County 546 0
New Hanover County 2332 83
Lowndes County 804 0
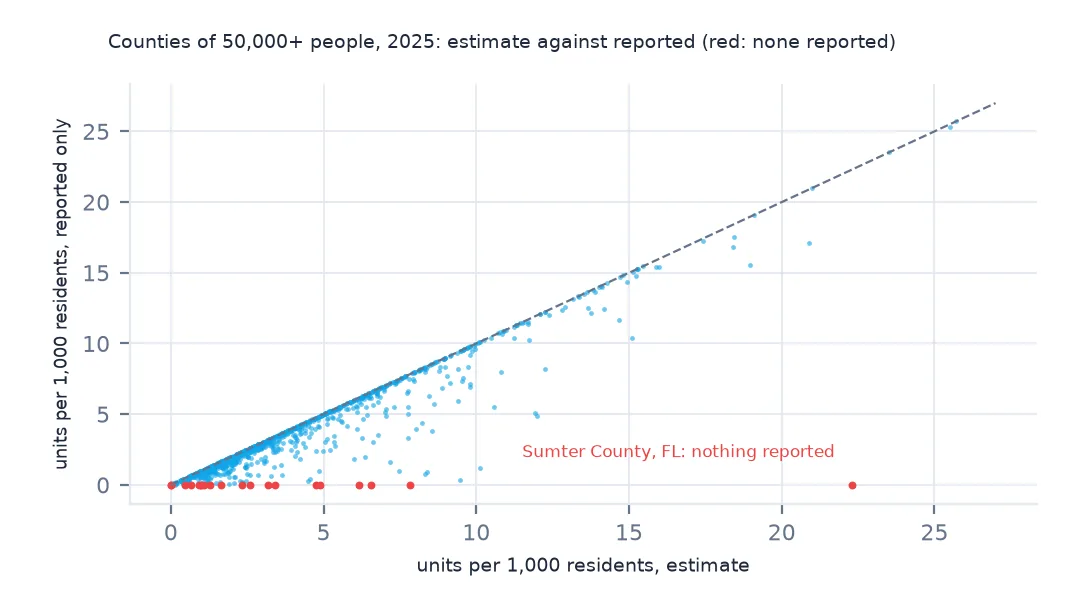
For counties of 50,000 or more, ranking by permits per resident with or without the imputed units gives a rank correlation of 0.919, but 448 of 1,013 counties move 50 places or more. Sumter County, Florida, permitted 3,516 units in the estimates and reported none; the Catoosa and Lowndes county rows in the same list reported none either. Use the estimates for totals and maps, they are the Bureau's best figure, and check reported before saying anything about a single county.
Internal links
- Read the permit files — the 24 numeric columns
- This year's permits month by month — why December's total differs from the annual one
- US housing permits since 1990 — the series this share runs alongside
- Units, buildings and value — the other three measures