
How to Chart US Housing Permits Since 1990 in Python
On this page
Problem statement
How much housing does the US build now compared with the boom of the mid-2000s, and has it recovered from the crash? The Census Bureau's county permit files go back to 1990, one file a year, and stacked together they give a 36-year series by county and by size of building. This page builds that series, measures the 2005 peak and the 2009 trough, separates houses from apartments, and finds the states and counties that have and have not returned to their boom-year building.
Quick answer
Read the 36 annual files with permits(), stack them with a year column and sum:
years = pd.concat([permits(f"co{y}a.txt").assign(year=y) for y in range(1990, 2026)], ignore_index=True)
total = years.groupby("year").units.sum()
print(f"peak {total.idxmax()}: {total.max():,}; trough {total.idxmin()}: {total.min():,}; 2025: {total[2025]:,}")
peak 2005: 2,155,316; trough 2009: 582,963; 2025: 1,431,616
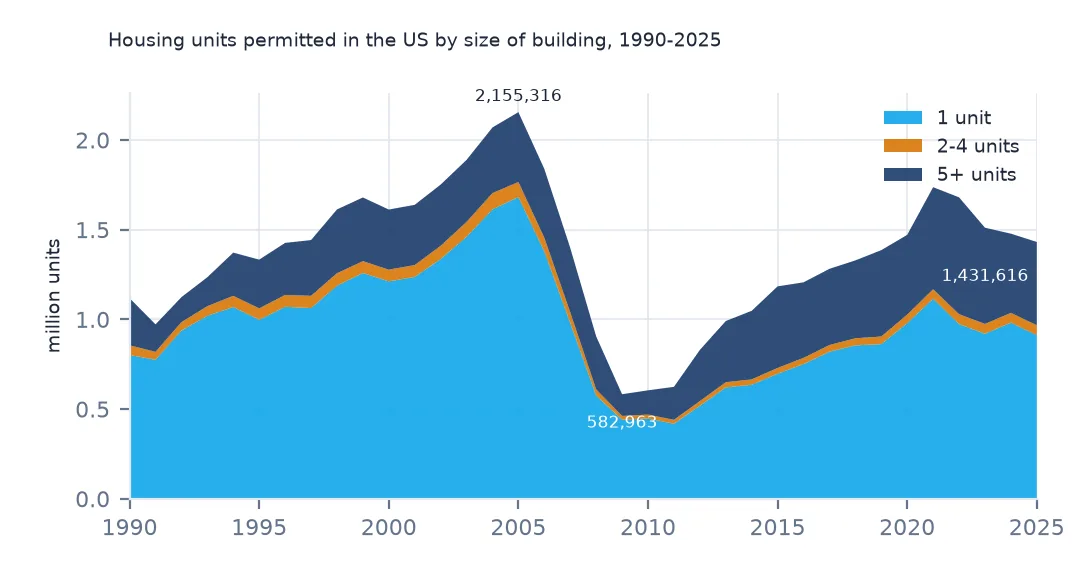
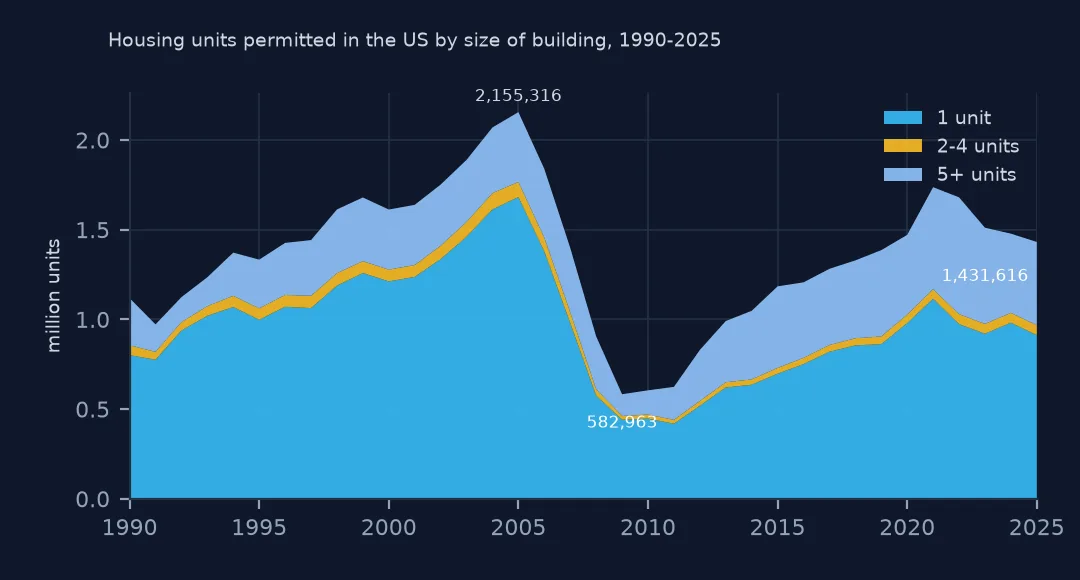
Permits peaked at 2,155,316 units in 2005 and fell to 582,963 in 2009, a quarter of the peak. The 1,431,616 units of 2025 are about two thirds of 2005.
Stacking the 36 files
1. Units by size of building, every year
kinds = {"1 unit": "est1_units", "2-4 units": ["est2_units", "est34_units"], "5+ units": "est5_units"}
ts = pd.DataFrame({k: years[v if isinstance(v, list) else [v]].sum(axis=1).groupby(years.year).sum() for k, v in kinds.items()})
ts["5+ share"] = (ts["5+ units"] / ts.sum(axis=1)).round(3)
print(ts.loc[[1990, 1995, 2000, 2005, 2009, 2015, 2020, 2022, 2025]].to_string())
1 unit 2-4 units 5+ units 5+ share
year
1990 801071 54576 262904 0.235
1995 997829 63764 271549 0.204
2000 1212124 65177 335057 0.208
2005 1681986 83996 389334 0.181
2009 441148 20690 121125 0.208
2015 697372 32121 454678 0.384
2020 979360 47242 444539 0.302
2022 973851 55215 651302 0.388
2025 911903 55741 463972 0.324
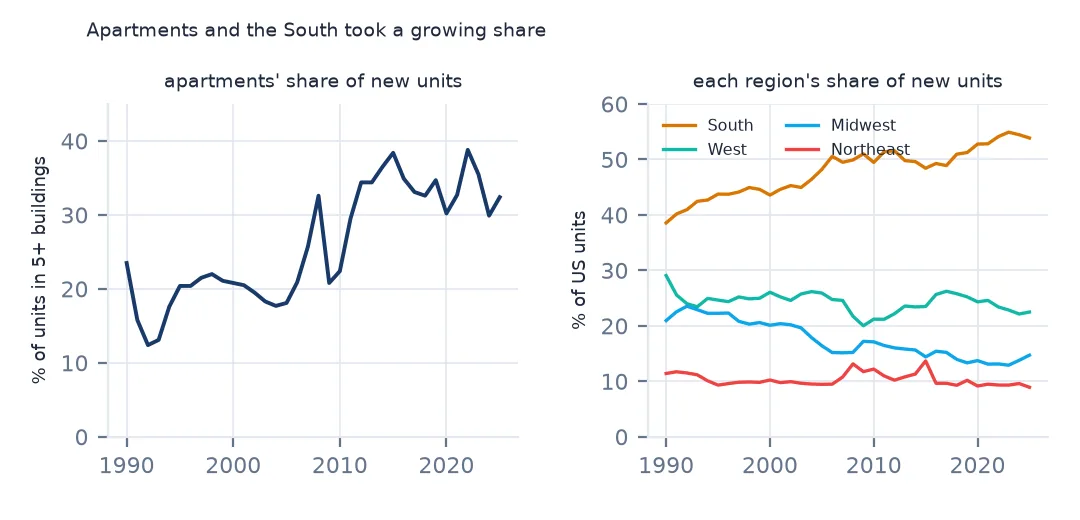
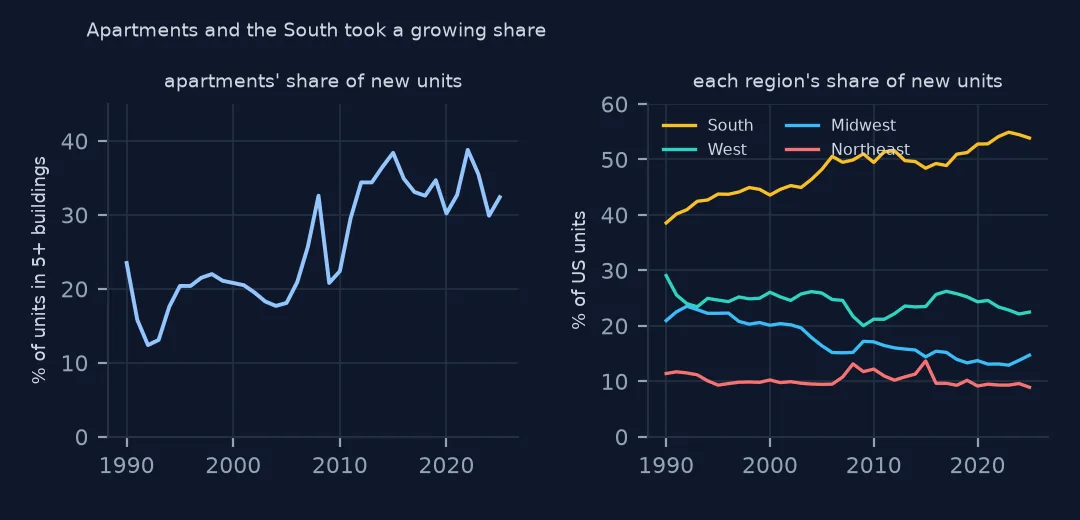
The recovery is almost all apartments. Single-family permits reached 1,681,986 in 2005 and were 911,903 in 2025; buildings of five or more units went from 389,334 to 463,972, and their share of all units from 18.1% to 32.4%, after a high of 38.8% in 2022.
2. The bust, measured
fall = 1 - ts.loc[2009] / ts.loc[2005]
back = ts.loc[2025] / ts.loc[2005]
print(f"2005 to 2009, fall: single {fall['1 unit']:.1%}, 5+ {fall['5+ units']:.1%}")
print(f"2025 as a share of 2005: single {back['1 unit']:.1%}, 5+ {back['5+ units']:.1%}")
2005 to 2009, fall: single 73.8%, 5+ 68.9%
2025 as a share of 2005: single 54.2%, 5+ 119.2%
Both kinds collapsed by about the same amount between 2005 and 2009: single-family by 73.8%, five-plus by 68.9%. But single-family building in 2025 is 54.2% of its 2005 level, while five-plus building is 119.2%, above the peak.
3. Where the building moved
REG = {1: "Northeast", 2: "Midwest", 3: "South", 4: "West"}
reg = years.groupby(["year", "region"]).units.sum().unstack().rename(columns=REG)
share = reg.div(reg.sum(axis=1), axis=0)
print(share.loc[[1990, 2005, 2025]].round(3).to_string())
region Northeast Midwest South West
year
1990 0.114 0.210 0.386 0.291
2005 0.095 0.164 0.482 0.259
2025 0.089 0.147 0.539 0.225
The South's share of all units rose from 38.6% in 1990 to 48.2% in 2005 and 53.9% in 2025. Every other region lost share, the West most since 2005, from 25.9% to 22.5%. region is the Census region code in the file (1 Northeast, 2 Midwest, 3 South, 4 West).
States that recovered and states that did not
The data used on this page
The US Census Bureau's Building Permits Survey county files (annual 1990–2025 and year-to-date 2025–2026), its Northeast place files for 2020–2025, the Vintage 2025 county population estimates and the 2024 cartographic boundary counties, all public domain. They were downloaded on 16 October 2026 and saved on this site in one archive, because Census revises recent months as late reports arrive.
from pathlib import Path
import zipfile

import geopandas as gpd
import numpy as np
import pandas as pd
import requests

Path("data").mkdir(exist_ok=True)
# US Census Bureau Building Permits Survey: annual county files co1990a.txt-co2025a.txt, year-to-date county files
# co2501y.txt-co2512y.txt and co2601y.txt-co2608y.txt, Northeast place files ne2020a.txt-ne2025a.txt; the Vintage 2025
# county population estimates; 2024 cartographic boundary counties. Downloaded 16 October 2026, saved here unchanged.
# Live: https://www2.census.gov/econ/bps/County/co2025a.txt (and the same folder for the others),
# https://www2.census.gov/econ/bps/Place/Northeast%20Region/ne2025a.txt,
# https://www2.census.gov/programs-surveys/popest/datasets/2020-2025/counties/totals/co-est2025-alldata.csv,
# https://www2.census.gov/geo/tiger/GENZ2024/shp/cb_2024_us_county_20m.zip
ARCHIVE = "census-building-permits-2026-10-16.zip"
if not Path(f"data/{ARCHIVE}").exists():
    Path(f"data/{ARCHIVE}").write_bytes(requests.get(f"https://data.spatialworkflow.io/{ARCHIVE}", timeout=600).content)
Z = zipfile.ZipFile(f"data/{ARCHIVE}")

SIZES = ["1", "2", "34", "5"]  # buildings with 1 unit, 2 units, 3-4 units, 5 or more units
COLS = (["survey", "state", "county", "region", "division", "name"]
        + [f"{k}{s}_{m}" for k in ("est", "rep") for s in SIZES for m in ("bldgs", "units", "value")])


def permits(name):
    """One county file: two header rows and a blank line, then a row per county. est = estimate with
    imputation for places that did not report, rep = reported only."""
    d = pd.read_csv(Z.open(name), skiprows=3, header=None, names=COLS, skipinitialspace=True,
                    dtype={"survey": str, "state": str, "county": str, "name": str})
    d["survey"], d["name"] = d.survey.str.strip(), d.name.str.strip()
    d["state"], d["county"] = d.state.str.strip().str.zfill(2), d.county.str.strip().str.zfill(3)
    return d.assign(GEOID=d.state + d.county,
                    units=d[[f"est{s}_units" for s in SIZES]].sum(axis=1),
                    reported=d[[f"rep{s}_units" for s in SIZES]].sum(axis=1),
                    value=d[[f"est{s}_value" for s in SIZES]].sum(axis=1))


pop = pd.read_csv(Z.open("co-est2025-alldata.csv"), encoding="latin-1", dtype={"STATE": str, "COUNTY": str})
pop = pop[pop.SUMLEV == 50].assign(GEOID=lambda p: p.STATE + p.COUNTY)
Path("data/cb_2024_us_county_20m.zip").write_bytes(Z.read("cb_2024_us_county_20m.zip"))
counties = gpd.read_file("data/cb_2024_us_county_20m.zip")
counties = counties[~counties.STUSPS.isin(["AK", "HI", "PR"])].to_crs(5070)
y25 = permits("co2025a.txt")
print(f"2025 county file: {len(y25):,} rows, {y25.units.sum():,} units permitted; {len(pop):,} counties in the estimates")
2025 county file: 3,029 rows, 1,431,616 units permitted; 3,144 counties in the estimates
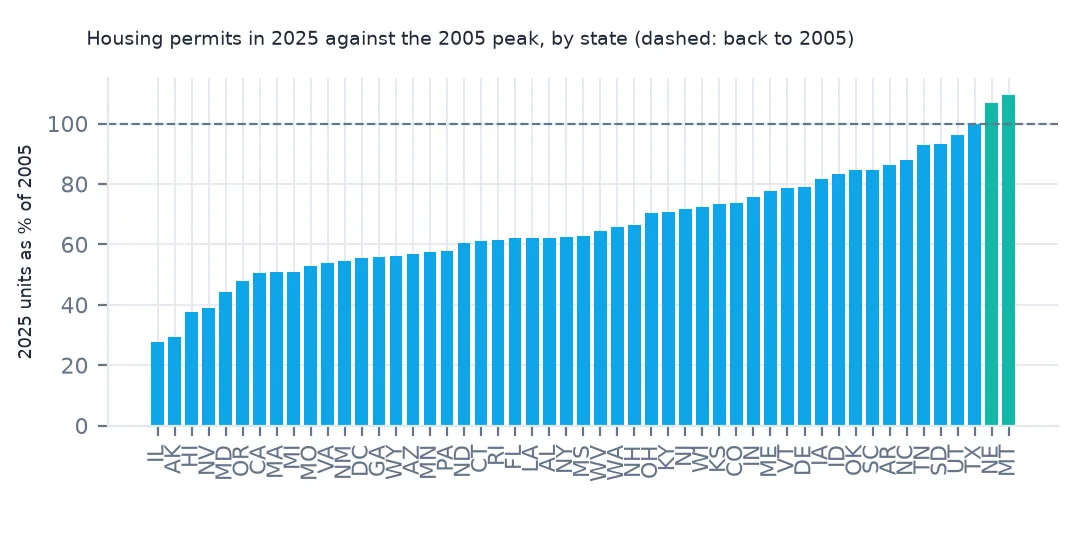
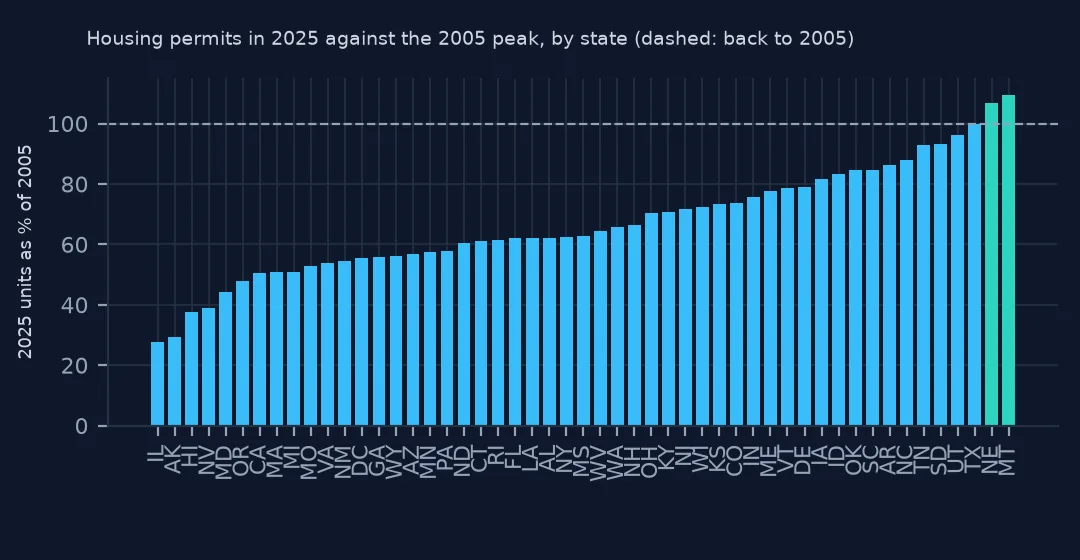
Example 1: 2025 against the 2005 peak, by state
names = pop.drop_duplicates("STATE").set_index("STATE").STNAME
st = years[years.year.isin([2005, 2025])].groupby(["state", "year"]).units.sum().unstack()
st["ratio"] = st[2025] / st[2005]
st.index = st.index.map(names)
st = st.dropna().sort_values("ratio")
print("lowest:", ", ".join(f"{k} {v:.2f}" for k, v in st.ratio.head(5).items()))
print("highest:", ", ".join(f"{k} {v:.2f}" for k, v in st.ratio.tail(5).items()))
lowest: Illinois 0.28, Alaska 0.29, Hawaii 0.38, Nevada 0.39, Maryland 0.44
highest: South Dakota 0.93, Utah 0.96, Texas 1.00, Nebraska 1.07, Montana 1.09
Montana, Nebraska and Texas permitted as much in 2025 as in 2005 or more (ratios of 1.00 and above), and Utah and South Dakota nearly so. Illinois and Alaska built under 30% of their 2005 numbers, Nevada and Hawaii under two fifths.
Example 2: the counties behind the peak
c = years[years.year.isin([2005, 2025])].pivot_table(index="GEOID", columns="year", values="units", aggfunc="sum")
c = c.join(years[years.year == 2025].set_index("GEOID").name)
print(c.nlargest(5, 2005)[["name", 2005, 2025]].to_string())
print(f"counties that permitted more in 2025 than in 2005: {(c[2025] > c[2005]).sum():,} of {c[[2005, 2025]].notna().all(axis=1).sum():,}")
name 2005 2025
GEOID
04013 Maricopa County 50823.0 31651.0
48201 Harris County 41506.0 30909.0
32003 Clark County 39237.0 14466.0
06065 Riverside County 34373.0 9697.0
12071 Lee County 29330.0 13547.0
counties that permitted more in 2025 than in 2005: 758 of 2,988
The counties that led the boom have not returned to it: Clark County, Nevada (Las Vegas) permitted 39,237 units in 2005 and 14,466 in 2025, Riverside County, California 34,373 and 9,697. Only 758 of 2,988 counties with rows in both years permitted more in 2025.
Internal links
- Read the permit files — the reader used here
- This year's permits month by month — the series after 2025
- The apartment share of new housing — the 5+ share by county
- Reported against imputed units — why 2003 behaves differently
FAQ
How many housing units were permitted in the US in 2025?
1,431,616 units in the Census Bureau's 2025 county file: 911,903 single-family and 463,972 in buildings of five or more units. That is about two thirds of the 2005 peak of 2,155,316.