
How to Measure the Apartment Share of New Housing by County
On this page
Problem statement
Is new housing in a county mostly houses or mostly apartments? The Census Bureau's permit files split every county's units by the size of the building, and the column for buildings of five or more units is the usual measure of apartment construction. One year of it is lumpy, because a single apartment block can be most of a small county's year, so this page pools 2021–2025, sets a floor on how many units a county needs, and then ranks, relates the share to density and maps it.
Quick answer
Sum five annual files by county and divide the units in five-plus buildings by all units:
five = pd.concat([permits(f"co{y}a.txt") for y in range(2021, 2026)])
c = five.groupby("GEOID")[["units", "est5_units", "est1_units"]].sum()
c["share5"] = c.est5_units / c.units
print(f"US 2021-2025: {c.est5_units.sum() / c.units.sum():.1%} of units in buildings of 5+; counties with 500+ units: {(c.units >= 500).sum():,}, median share {c[c.units >= 500].share5.median():.1%}")
US 2021-2025: 34.0% of units in buildings of 5+; counties with 500+ units: 1,272, median share 15.8%
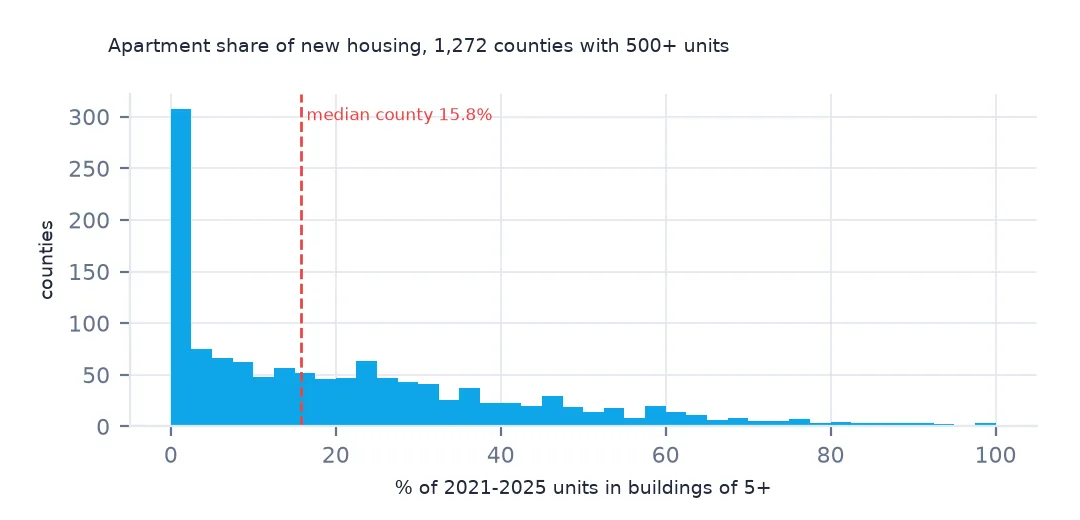
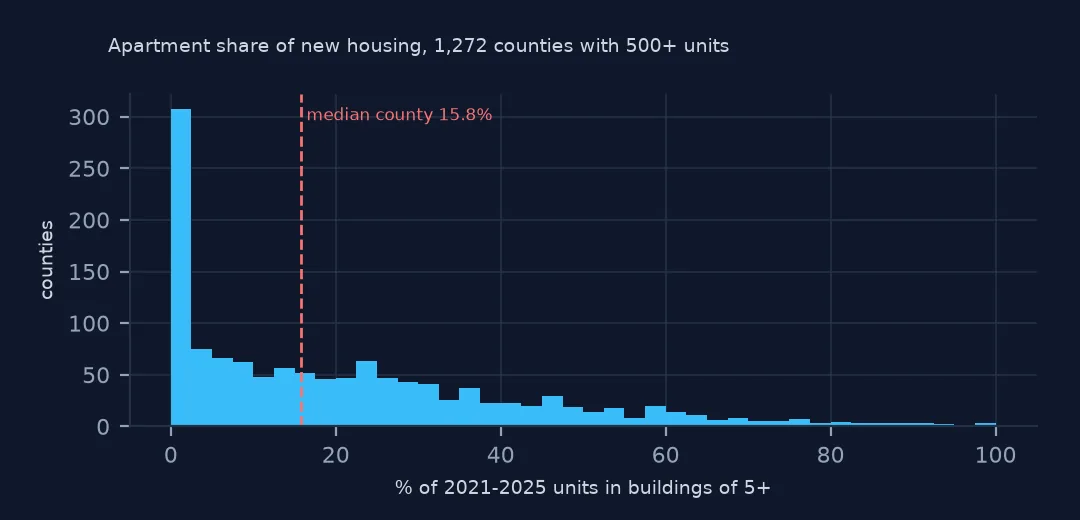
Over 2021–2025, 34.0% of all units permitted in the US were in buildings of five or more. The typical county is far lower: among the 1,272 counties that permitted 500 or more units, the median share is 15.8%. Apartments are concentrated in a few large counties.
Pooling years and setting a floor
1. One year is lumpy
one = permits("co2025a.txt").set_index("GEOID")
one = one[one.units >= 100]
print(f"counties with 100-499 units in 2025: share 0% in {(one[one.units < 500].est5_units == 0).mean():.1%}, 50%+ in {(one[one.units < 500].est5_units / one[one.units < 500].units >= .5).mean():.1%}")
print(one[(one.units < 300) & (one.est5_bldgs == 1)].nlargest(3, "est5_units")[["name", "units", "est5_units"]].to_string(index=False))
counties with 100-499 units in 2025: share 0% in 54.9%, 50%+ in 8.1%
name units est5_units
Itasca County 249 132
Mower County 136 102
Clay County 297 86
In 2025 alone, 54.9% of counties with 100 to 499 units permitted no five-plus units at all, and 8.1% had a share of 50% or more. In Mower County, Minnesota, a single building of 102 units was most of the year's 136. Pooling five years and requiring 500 units is what keeps one project from colouring a county.
2. Counties where most new homes are apartments
c = c.join(five.drop_duplicates("GEOID").set_index("GEOID")[["name", "state"]])
print(f"counties with 5,000+ units: {(c.units >= 5000).sum()}")
print(c[c.units >= 5000].nlargest(8, "share5")[["name", "state", "units", "share5"]].round(3).to_string())
counties with 5,000+ units: 345
name state units share5
GEOID
36061 New York County 36 17983 0.999
36005 Bronx County 36 30773 0.988
36047 Kings County 36 52476 0.980
06075 San Francisco County 06 7883 0.955
36081 Queens County 36 27844 0.937
11001 Washington DC 11 18793 0.916
25025 Suffolk County 25 14742 0.909
24510 Baltimore (Independent City) 24 6873 0.880
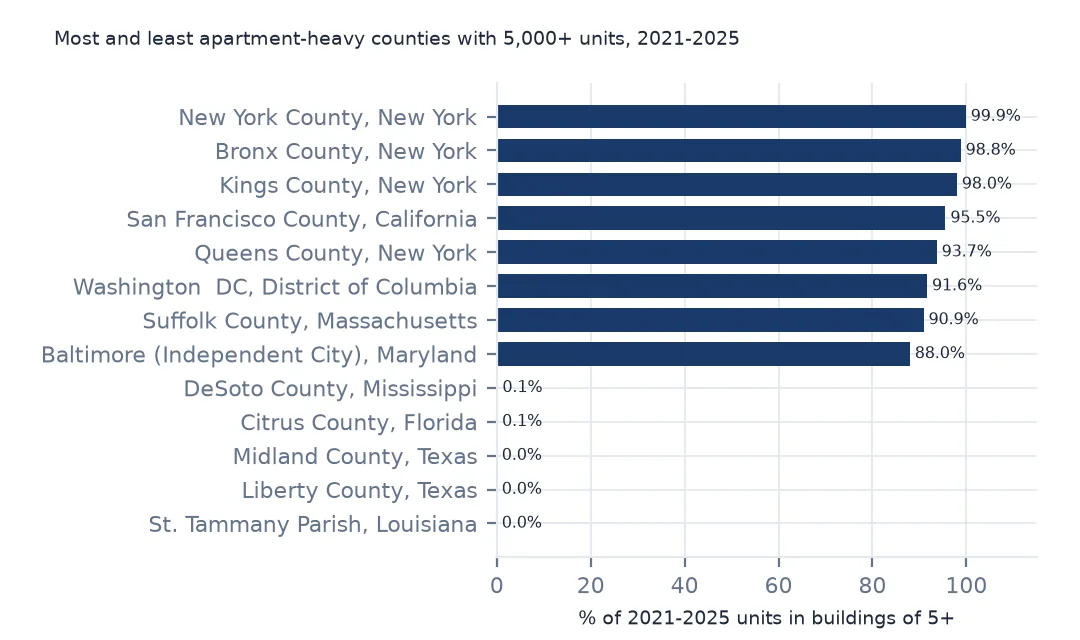
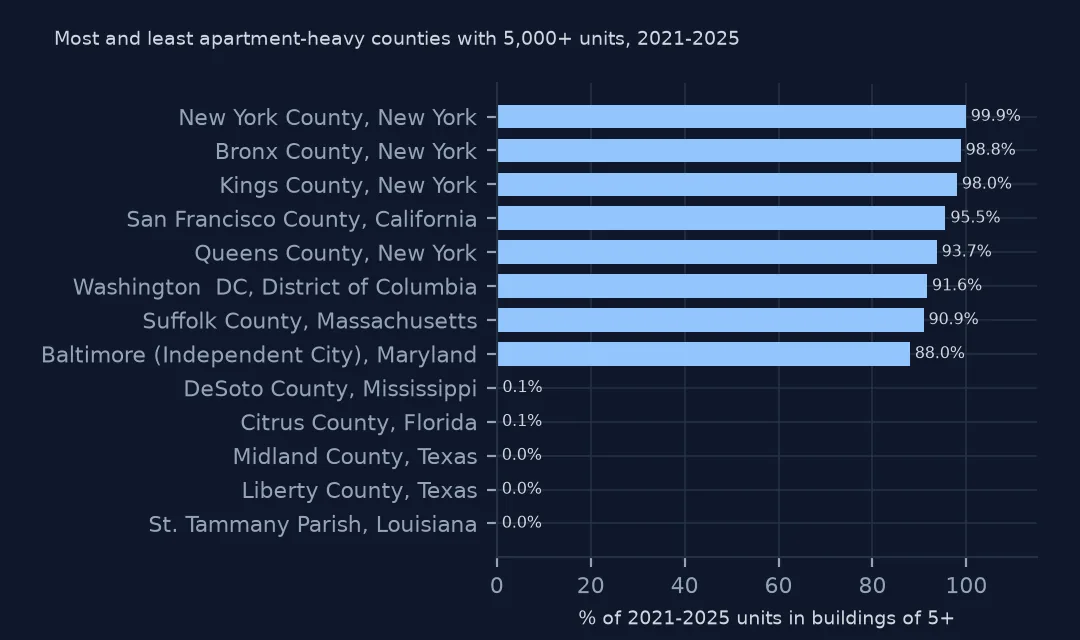
New York's boroughs lead: 99.9% of the units permitted in Manhattan (New York County) and 98.0% in Brooklyn (Kings County) were in five-plus buildings, then San Francisco at 95.5%. state is the two-digit code (36 New York, 06 California, 11 District of Columbia).
3. And where almost none are
print(c[c.units >= 5000].nsmallest(6, "share5")[["name", "state", "units", "share5"]].round(3).to_string()) name state units share5
GEOID
22103 St. Tammany Parish 22 6440 0.000
35000 New Mexico Balance of State 35 11753 0.000
48291 Liberty County 48 6420 0.000
48329 Midland County 48 5077 0.000
12017 Citrus County 12 10358 0.001
28033 DeSoto County 28 6140 0.001
Among counties that permitted 5,000 or more units, St. Tammany Parish in Louisiana and Liberty and Midland counties in Texas permitted none in five-plus buildings. New Mexico's "Balance of State" row also appears with 11,753 units and no apartments: it is not a county, and it belongs out of any county ranking.
Density, metros and the map
The data used on this page
The US Census Bureau's Building Permits Survey county files (annual 1990–2025 and year-to-date 2025–2026), its Northeast place files for 2020–2025, the Vintage 2025 county population estimates and the 2024 cartographic boundary counties, all public domain. They were downloaded on 16 October 2026 and saved on this site in one archive, because Census revises recent months as late reports arrive.
from pathlib import Path
import zipfile

import geopandas as gpd
import numpy as np
import pandas as pd
import requests

Path("data").mkdir(exist_ok=True)
# US Census Bureau Building Permits Survey: annual county files co1990a.txt-co2025a.txt, year-to-date county files
# co2501y.txt-co2512y.txt and co2601y.txt-co2608y.txt, Northeast place files ne2020a.txt-ne2025a.txt; the Vintage 2025
# county population estimates; 2024 cartographic boundary counties. Downloaded 16 October 2026, saved here unchanged.
# Live: https://www2.census.gov/econ/bps/County/co2025a.txt (and the same folder for the others),
# https://www2.census.gov/econ/bps/Place/Northeast%20Region/ne2025a.txt,
# https://www2.census.gov/programs-surveys/popest/datasets/2020-2025/counties/totals/co-est2025-alldata.csv,
# https://www2.census.gov/geo/tiger/GENZ2024/shp/cb_2024_us_county_20m.zip
ARCHIVE = "census-building-permits-2026-10-16.zip"
if not Path(f"data/{ARCHIVE}").exists():
    Path(f"data/{ARCHIVE}").write_bytes(requests.get(f"https://data.spatialworkflow.io/{ARCHIVE}", timeout=600).content)
Z = zipfile.ZipFile(f"data/{ARCHIVE}")

SIZES = ["1", "2", "34", "5"]  # buildings with 1 unit, 2 units, 3-4 units, 5 or more units
COLS = (["survey", "state", "county", "region", "division", "name"]
        + [f"{k}{s}_{m}" for k in ("est", "rep") for s in SIZES for m in ("bldgs", "units", "value")])


def permits(name):
    """One county file: two header rows and a blank line, then a row per county. est = estimate with
    imputation for places that did not report, rep = reported only."""
    d = pd.read_csv(Z.open(name), skiprows=3, header=None, names=COLS, skipinitialspace=True,
                    dtype={"survey": str, "state": str, "county": str, "name": str})
    d["survey"], d["name"] = d.survey.str.strip(), d.name.str.strip()
    d["state"], d["county"] = d.state.str.strip().str.zfill(2), d.county.str.strip().str.zfill(3)
    return d.assign(GEOID=d.state + d.county,
                    units=d[[f"est{s}_units" for s in SIZES]].sum(axis=1),
                    reported=d[[f"rep{s}_units" for s in SIZES]].sum(axis=1),
                    value=d[[f"est{s}_value" for s in SIZES]].sum(axis=1))


pop = pd.read_csv(Z.open("co-est2025-alldata.csv"), encoding="latin-1", dtype={"STATE": str, "COUNTY": str})
pop = pop[pop.SUMLEV == 50].assign(GEOID=lambda p: p.STATE + p.COUNTY)
Path("data/cb_2024_us_county_20m.zip").write_bytes(Z.read("cb_2024_us_county_20m.zip"))
counties = gpd.read_file("data/cb_2024_us_county_20m.zip")
counties = counties[~counties.STUSPS.isin(["AK", "HI", "PR"])].to_crs(5070)
y25 = permits("co2025a.txt")
print(f"2025 county file: {len(y25):,} rows, {y25.units.sum():,} units permitted; {len(pop):,} counties in the estimates")
2025 county file: 3,029 rows, 1,431,616 units permitted; 3,144 counties in the estimates
Example 1: share against population density
area = counties.set_index("GEOID").ALAND / 1e6
c = c.join(pop.set_index("GEOID").POPESTIMATE2025).join(area)
c["density"] = c.POPESTIMATE2025 / c.ALAND
d = c[c.units >= 500].copy()
d["dclass"] = pd.cut(d.density, [0, 50, 250, 1000, 1e6], labels=["<50/km²", "50-250", "250-1,000", "1,000+"])
print(d.groupby("dclass", observed=True).apply(lambda g: pd.Series({"counties": len(g), "share5": g.est5_units.sum() / g.units.sum()}), include_groups=False).round(3).to_string())
counties share5
dclass
<50/km² 567.0 0.182
50-250 490.0 0.241
250-1,000 157.0 0.430
1,000+ 43.0 0.644
The share rises steadily with density: 18.2% in counties under 50 people per km², 24.1% at 50 to 250, 43.0% at 250 to 1,000 and 64.4% in the 43 counties above 1,000. ALAND from the boundary file is in square metres.
Example 2: the map
m = counties.merge(c[c.units >= 500][["share5"]].reset_index(), on="GEOID", how="left")
m["cls"] = pd.cut(m.share5, [0, .05, .15, .3, .5, 1.01], right=False)
print(m.cls.value_counts(sort=False).to_string())
ax = m.plot(column="cls", cmap="PuBu", legend=True, missing_kwds={"color": "lightgrey"}, figsize=(10, 6))
ax.set_axis_off()
cls
[0.0, 0.05) 377
[0.05, 0.15) 231
[0.15, 0.3) 297
[0.3, 0.5) 216
[0.5, 1.01) 136
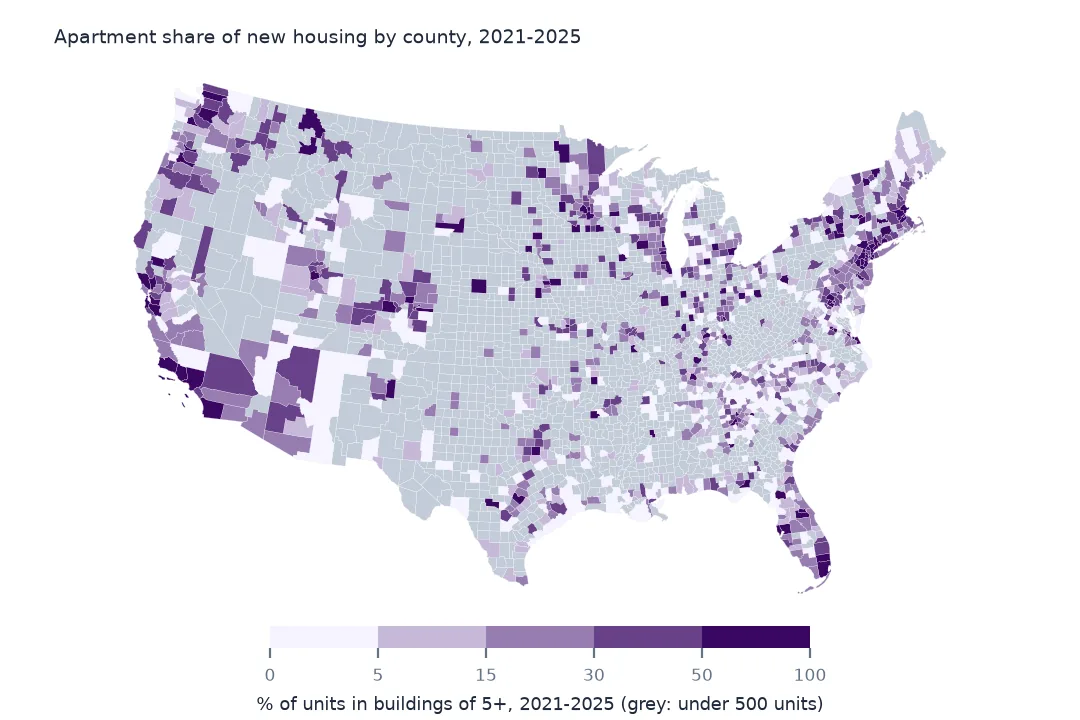
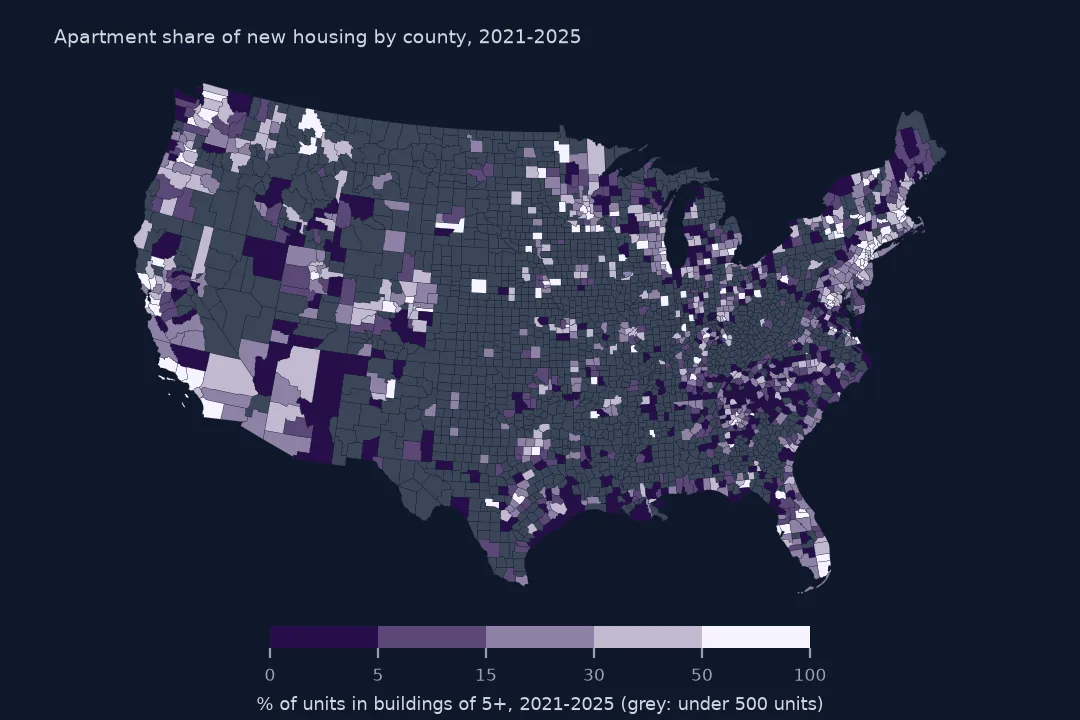
Of the counties with 500 or more units, 377 had a five-plus share under 5% and 136 a share of 50% or more. The apartment counties are the big metros; the grey counties permitted fewer than 500 units in five years.
Internal links
- Units, buildings and value — what a 5+ building counts
- Housing permits per 1,000 residents — how much is built, not what kind
- US housing permits since 1990 — the national 5+ share over time
- Read the permit files — the reader used here