
Units, Buildings and Value in Building Permit Data Explained
On this page
Problem statement
Each size class in a Census Bureau permit file has three numbers: buildings, units and value. They answer different questions. Buildings count structures, units count homes, and value is the construction cost declared on the permit, not a sale price and not including land. Mixing them up gives wrong answers quickly: a county that permitted 5 apartment buildings may have permitted 1,000 homes, and a value per unit says more about what a jurisdiction records than about what homes sell for. This page sets the three side by side with the 2025 file and follows value per unit back to 1990.
Quick answer
Sum each measure over the four size classes:
b, u, v = (sum(y25[f"est{s}_{m}"].sum() for s in SIZES) for m in ("bldgs", "units", "value"))
print(f"2025: {b:,} buildings, {u:,} units, ${v / 1e9:,.1f} billion; {u / b:.2f} units per building, ${v / u:,.0f} per unit")
2025: 951,960 buildings, 1,431,616 units, $379.1 billion; 1.50 units per building, $264,771 per unit
In 2025, 951,960 buildings held 1,431,616 units, with a declared value of $379.1 billion: 1.50 units per building and $264,771 per unit on average. Both averages blend houses with apartments, so they describe neither.
Three counts per size of building
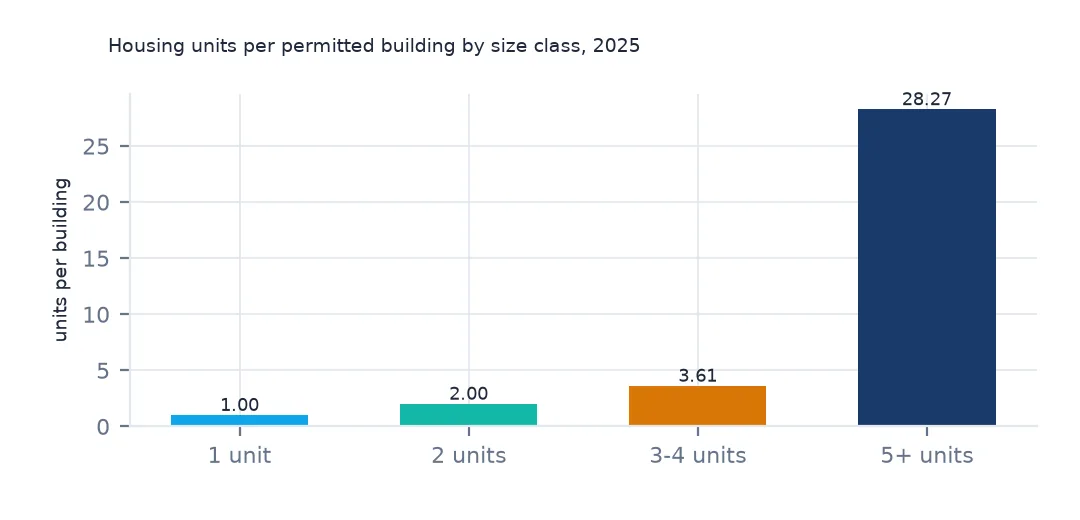
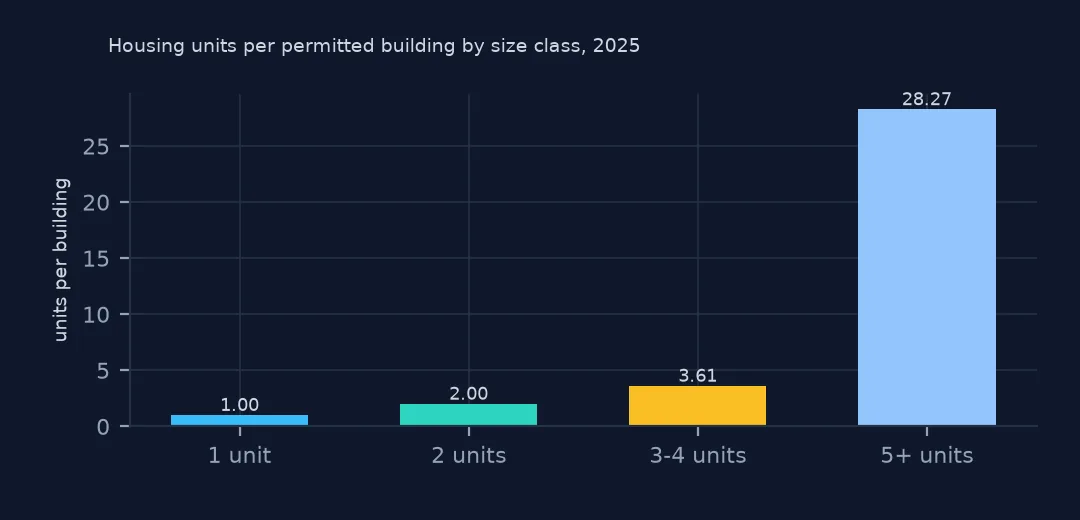
1. Units per building
for s, lab in [("1", "1 unit"), ("2", "2 units"), ("34", "3-4 units"), ("5", "5+ units")]:
    print(f"{lab:9} {y25[f'est{s}_bldgs'].sum():>8,} buildings {y25[f'est{s}_units'].sum():>9,} units  {y25[f'est{s}_units'].sum() / y25[f'est{s}_bldgs'].sum():.2f} per building")
1 unit 911,903 buildings 911,903 units 1.00 per building
2 units 18,375 buildings 36,748 units 2.00 per building
3-4 units 5,268 buildings 18,993 units 3.61 per building
5+ units 16,414 buildings 463,972 units 28.27 per building
For one- and two-unit buildings the ratio is exact; for 3–4 units it is 3.61, and for five-plus buildings 28.27 units per building on average. A count of buildings understates apartment construction by a factor of nearly thirty.
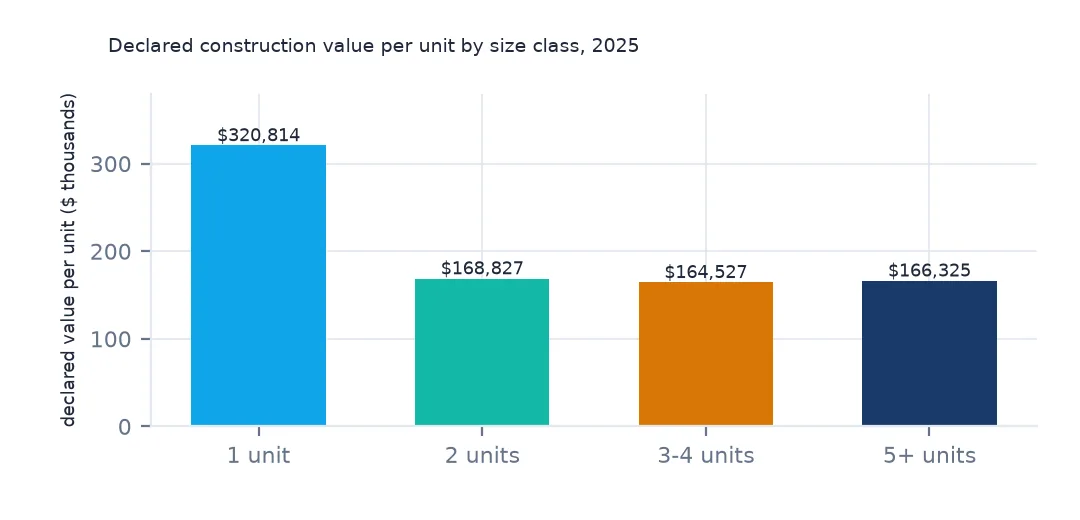
2. Value per unit
for s, lab in [("1", "1 unit"), ("2", "2 units"), ("34", "3-4 units"), ("5", "5+ units")]:
    print(f"{lab:9} ${y25[f'est{s}_value'].sum() / y25[f'est{s}_units'].sum():>9,.0f} per unit")
1 unit $ 320,814 per unit
2 units $ 168,827 per unit
3-4 units $ 164,527 per unit
5+ units $ 166,325 per unit
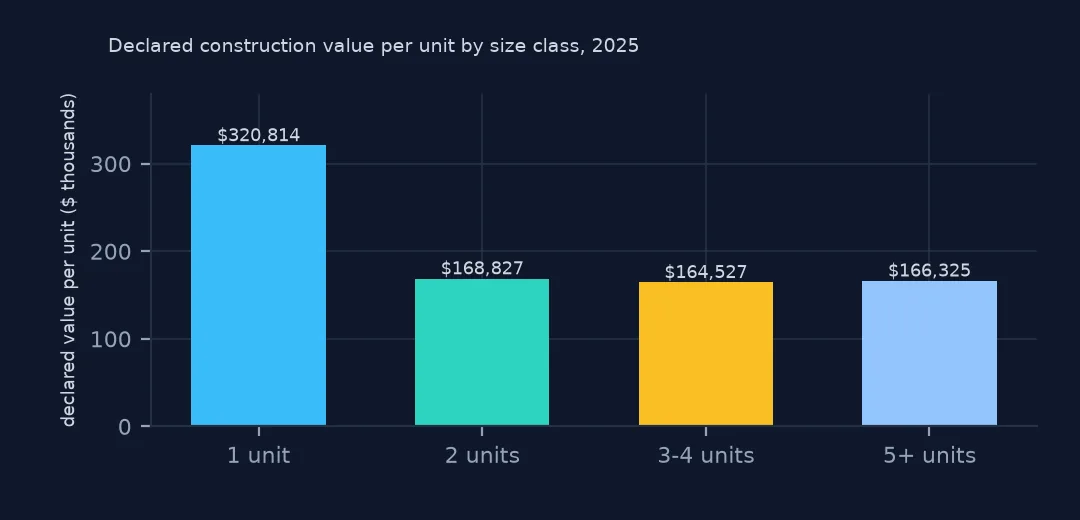
A single-family house was declared at $320,814 per unit in 2025, about twice the $164,527 to $168,827 per unit of the multi-unit classes. Value is the construction cost declared on the permit, without the land, so it is not a house price.
3. The largest apartment buildings
c = y25[y25.est5_bldgs > 0].assign(per_bldg=lambda d: d.est5_units / d.est5_bldgs)
print(c[c.est5_bldgs >= 5].nlargest(6, "per_bldg")[["name", "state", "est5_bldgs", "est5_units", "per_bldg"]].round(1).to_string(index=False))
name state est5_bldgs est5_units per_bldg
Arlington County 51 5 1085 217.0
San Francisco County 06 9 1394 154.9
East Baton Rouge Parish 22 8 1205 150.6
Prince William County 51 5 614 122.8
Broomfield County 08 8 880 110.0
DeKalb County 13 5 510 102.0
Arlington County, Virginia, permitted 1,085 units in five apartment buildings in 2025, 217 per building; San Francisco 154.9. These are counties where the five-plus category means towers, not garden apartments.
Value over time and by state
The data used on this page
The US Census Bureau's Building Permits Survey county files (annual 1990–2025 and year-to-date 2025–2026), its Northeast place files for 2020–2025, the Vintage 2025 county population estimates and the 2024 cartographic boundary counties, all public domain. They were downloaded on 16 October 2026 and saved on this site in one archive, because Census revises recent months as late reports arrive.
from pathlib import Path
import zipfile

import geopandas as gpd
import numpy as np
import pandas as pd
import requests

Path("data").mkdir(exist_ok=True)
# US Census Bureau Building Permits Survey: annual county files co1990a.txt-co2025a.txt, year-to-date county files
# co2501y.txt-co2512y.txt and co2601y.txt-co2608y.txt, Northeast place files ne2020a.txt-ne2025a.txt; the Vintage 2025
# county population estimates; 2024 cartographic boundary counties. Downloaded 16 October 2026, saved here unchanged.
# Live: https://www2.census.gov/econ/bps/County/co2025a.txt (and the same folder for the others),
# https://www2.census.gov/econ/bps/Place/Northeast%20Region/ne2025a.txt,
# https://www2.census.gov/programs-surveys/popest/datasets/2020-2025/counties/totals/co-est2025-alldata.csv,
# https://www2.census.gov/geo/tiger/GENZ2024/shp/cb_2024_us_county_20m.zip
ARCHIVE = "census-building-permits-2026-10-16.zip"
if not Path(f"data/{ARCHIVE}").exists():
    Path(f"data/{ARCHIVE}").write_bytes(requests.get(f"https://data.spatialworkflow.io/{ARCHIVE}", timeout=600).content)
Z = zipfile.ZipFile(f"data/{ARCHIVE}")

SIZES = ["1", "2", "34", "5"]  # buildings with 1 unit, 2 units, 3-4 units, 5 or more units
COLS = (["survey", "state", "county", "region", "division", "name"]
        + [f"{k}{s}_{m}" for k in ("est", "rep") for s in SIZES for m in ("bldgs", "units", "value")])


def permits(name):
    """One county file: two header rows and a blank line, then a row per county. est = estimate with
    imputation for places that did not report, rep = reported only."""
    d = pd.read_csv(Z.open(name), skiprows=3, header=None, names=COLS, skipinitialspace=True,
                    dtype={"survey": str, "state": str, "county": str, "name": str})
    d["survey"], d["name"] = d.survey.str.strip(), d.name.str.strip()
    d["state"], d["county"] = d.state.str.strip().str.zfill(2), d.county.str.strip().str.zfill(3)
    return d.assign(GEOID=d.state + d.county,
                    units=d[[f"est{s}_units" for s in SIZES]].sum(axis=1),
                    reported=d[[f"rep{s}_units" for s in SIZES]].sum(axis=1),
                    value=d[[f"est{s}_value" for s in SIZES]].sum(axis=1))


pop = pd.read_csv(Z.open("co-est2025-alldata.csv"), encoding="latin-1", dtype={"STATE": str, "COUNTY": str})
pop = pop[pop.SUMLEV == 50].assign(GEOID=lambda p: p.STATE + p.COUNTY)
Path("data/cb_2024_us_county_20m.zip").write_bytes(Z.read("cb_2024_us_county_20m.zip"))
counties = gpd.read_file("data/cb_2024_us_county_20m.zip")
counties = counties[~counties.STUSPS.isin(["AK", "HI", "PR"])].to_crs(5070)
y25 = permits("co2025a.txt")
print(f"2025 county file: {len(y25):,} rows, {y25.units.sum():,} units permitted; {len(pop):,} counties in the estimates")
2025 county file: 3,029 rows, 1,431,616 units permitted; 3,144 counties in the estimates
Example 1: value per single-family unit since 1990
years = pd.concat([permits(f"co{y}a.txt").assign(year=y) for y in range(1990, 2026)], ignore_index=True)
t = years.groupby("year")[["est1_units", "est1_value"]].sum()
t["per_unit"] = t.est1_value / t.est1_units
print(t.per_unit.loc[[1990, 2000, 2005, 2010, 2020, 2025]].map("${:,.0f}".format).to_string())
print(f"1990 to 2025: x{t.per_unit[2025] / t.per_unit[1990]:.2f}")
year
1990 $90,879
2000 $133,153
2005 $169,117
2010 $194,773
2020 $248,554
2025 $320,814
1990 to 2025: x3.53
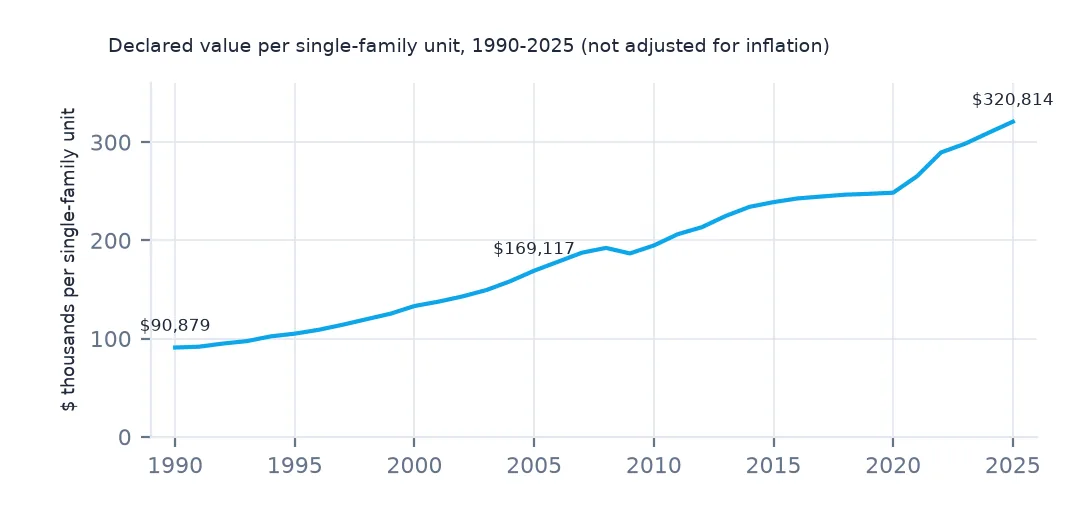
Declared value per single-family unit rose from $90,879 in 1990 to $320,814 in 2025, 3.53 times. Part of that is construction prices and part is larger houses; the permit file cannot separate the two.
Example 2: by state
names = pop.drop_duplicates("STATE").set_index("STATE").STNAME
s = y25.groupby("state")[["est1_units", "est1_value"]].sum()
s.index = s.index.map(names)
s = s[s.est1_units >= 1000]
print(f"states with 1,000+ single-family units: {len(s)}")
s["per_unit"] = s.est1_value / s.est1_units
s = s.sort_values("per_unit")
print("lowest:", ", ".join(f"{k} ${v:,.0f}" for k, v in s.per_unit.head(3).items()))
print("highest:", ", ".join(f"{k} ${v:,.0f}" for k, v in s.per_unit.tail(3).items()))
states with 1,000+ single-family units: 48
lowest: Delaware $135,025, Mississippi $209,768, West Virginia $225,415
highest: Colorado $439,694, Connecticut $457,061, Massachusetts $499,620
Massachusetts declared the most per single-family unit among states with 1,000 or more of them, $499,620, then Connecticut and Colorado. Delaware declared the least by a wide margin, $135,025, against $209,768 for Mississippi, the next lowest.
Example 3: one state's values, county by county
de = years[(years.state == "10") & years.year.isin([2020, 2023, 2024, 2025])]
print(de.assign(per_unit=de.est1_value / de.est1_units).pivot(index="name", columns="year", values="per_unit").round(-3).to_string())
year 2020 2023 2024 2025
name
Kent County 141000.0 163000.0 148000.0 156000.0
New Castle County 101000.0 128000.0 129000.0 114000.0
Sussex County 141000.0 149000.0 147000.0 136000.0
All three Delaware counties declare low values, from $114,000 to $156,000 a house in 2025, and they did so in 2020, 2023 and 2024 too. A gap that steady is how values are recorded there, not one bad record, and it is a reason to compare value per unit within a state over time rather than across states.
Internal links
- Read the permit files — the files these columns come from
- The apartment share of new housing — units in 5+ buildings by county
- Reported against imputed units — the second set of columns
- House price averages skewed by outliers — means of money that mislead