
Fixing a Permit Series That Loses Two Years When County Codes Change
On this page
Problem statement
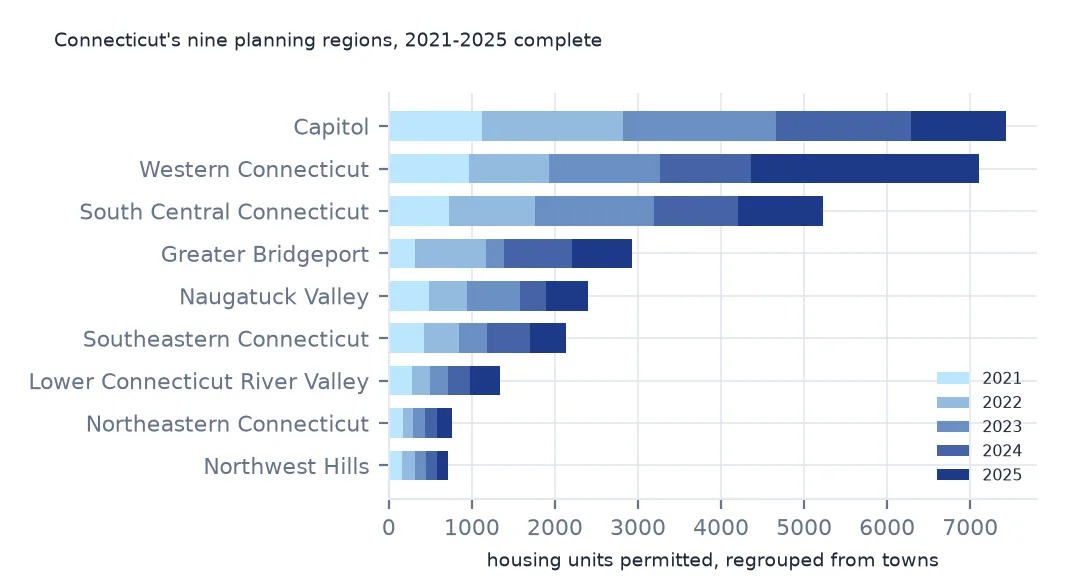
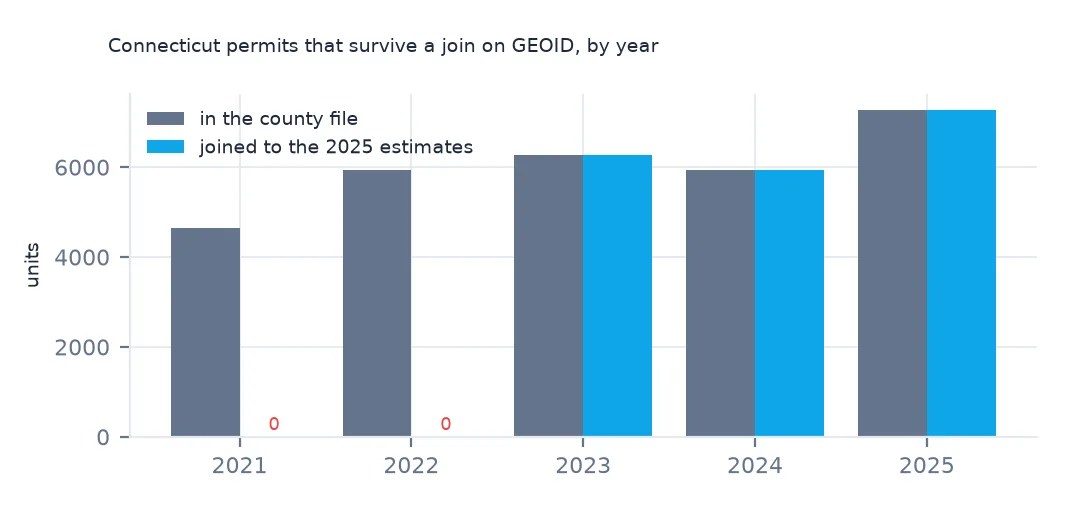
Connecticut's county permit files hold 30,048 housing units for 2021–2025, yet a join on GEOID to the nine planning regions finds 19,471 of them, 64.8%, and raises nothing. The 2021 and 2022 files still use the eight old county codes, 001 to 015; from 2023 the rows are regions 110 to 190. The same files list every town, though, under a six-digit ID that does not change, and each town sits wholly inside one region. So the two missing years can be rebuilt exactly, town by town, and the rebuilt totals compared with the county file for each year.
Quick answer
Read the Connecticut towns from the Northeast place files, take each town's region from the 2023 file, and add the earlier years up by region:
town = pd.concat([places(f"ne{y}a.txt") for y in range(2021, 2026)])
region_of = places("ne2023a.txt").set_index("id").county
town["region"] = town.id.map(region_of)
fixed = town.groupby(["region", "year"]).units.sum().unstack()
print(fixed.to_string())
year 2021 2022 2023 2024 2025
region
110 1124 1699 1843 1618 1146
120 314 856 214 818 729
130 285 211 215 269 358
140 490 446 638 317 513
150 165 130 140 146 185
160 163 155 124 141 133
170 722 1041 1427 1014 1020
180 426 425 335 509 440
190 962 963 1336 1094 2749
Every year from 2021 to 2025 now has a figure for each of the nine regions. Region 190, Western Connecticut, permitted 2,749 units in 2025.
Towns carry the new codes back
1. The symptom
ct = {y: permits(f"co{y}a.txt").query("state == '09'") for y in range(2021, 2026)}
for y, d in ct.items():
    print(y, len(d), "rows:", ", ".join(d.county))
est = pop[pop.STATE == "09"]
print("estimates:", ", ".join(est.COUNTY))
2021 8 rows: 001, 003, 005, 007, 009, 011, 013, 015
2022 8 rows: 001, 003, 005, 007, 009, 011, 013, 015
2023 9 rows: 110, 120, 130, 140, 150, 160, 170, 180, 190
2024 9 rows: 110, 120, 130, 140, 150, 160, 170, 180, 190
2025 9 rows: 110, 120, 130, 140, 150, 160, 170, 180, 190
estimates: 110, 120, 130, 140, 150, 160, 170, 180, 190
The 2021 and 2022 county files have rows 001 to 015, the eight old counties; 2023 to 2025 have 110 to 190, the regions. The estimates have only the regions.
2. What a plain join loses
built = pd.concat(ct.values()).groupby("GEOID").units.sum()
j = est.set_index("GEOID").join(built)
print(f"units 2021-2025 in the county files: {built.sum():,}; joined to the nine regions: {j.units.sum():,.0f} ({j.units.sum() / built.sum():.1%})")
units 2021-2025 in the county files: 30,048; joined to the nine regions: 19,471 (64.8%)
The county files hold 30,048 Connecticut units over 2021–2025, but a join on GEOID to the nine regions finds 19,471 of them, 64.8%. Nothing fails: the 2021 and 2022 rows simply have no partner.
3. Check the towns add up
for y in (2021, 2022, 2023, 2024, 2025):
    print(y, f"towns {town[town.year == y].units.sum():,}", f"county file {ct[y].units.sum():,}",
          f"unmapped towns {town[(town.year == y) & town.region.isna()].shape[0]}")
print(town[town.region.isna()][["year", "id", "name", "units"]].to_string(index=False))
2021 towns 4,651 county file 4,651 unmapped towns 1
2022 towns 5,926 county file 5,926 unmapped towns 0
2023 towns 6,272 county file 6,272 unmapped towns 0
2024 towns 5,926 county file 5,926 unmapped towns 0
2025 towns 7,273 county file 7,273 unmapped towns 0
year id name units
2021 601000 Stonington borough 0
The towns add up to the county file's state total in every year, 4,651 units in 2021 and 7,273 in 2025. One town, Stonington borough, appears in 2021 but not in the 2023 file, so it gets no region; it permitted nothing that year, so nothing is lost. Check this in your own years before trusting the regrouping.
Per resident, on the new map
The data used on this page
The Census Bureau's Building Permits Survey county and Northeast place files for 2021–2025, with the Vintage 2025 estimates and 2024 boundaries, from the archive of 16 October 2026 that the permit file guide describes.
from pathlib import Path
import zipfile

import geopandas as gpd
import numpy as np
import pandas as pd
import requests

Path("data").mkdir(exist_ok=True)
# US Census Bureau Building Permits Survey: annual county files co1990a.txt-co2025a.txt, year-to-date county files
# co2501y.txt-co2512y.txt and co2601y.txt-co2608y.txt, Northeast place files ne2020a.txt-ne2025a.txt; the Vintage 2025
# county population estimates; 2024 cartographic boundary counties. Downloaded 16 October 2026, saved here unchanged.
# Live: https://www2.census.gov/econ/bps/County/co2025a.txt (and the same folder for the others),
# https://www2.census.gov/econ/bps/Place/Northeast%20Region/ne2025a.txt,
# https://www2.census.gov/programs-surveys/popest/datasets/2020-2025/counties/totals/co-est2025-alldata.csv,
# https://www2.census.gov/geo/tiger/GENZ2024/shp/cb_2024_us_county_20m.zip
ARCHIVE = "census-building-permits-2026-10-16.zip"
if not Path(f"data/{ARCHIVE}").exists():
    Path(f"data/{ARCHIVE}").write_bytes(requests.get(f"https://data.spatialworkflow.io/{ARCHIVE}", timeout=600).content)
Z = zipfile.ZipFile(f"data/{ARCHIVE}")

SIZES = ["1", "2", "34", "5"]  # buildings with 1 unit, 2 units, 3-4 units, 5 or more units
COLS = (["survey", "state", "county", "region", "division", "name"]
        + [f"{k}{s}_{m}" for k in ("est", "rep") for s in SIZES for m in ("bldgs", "units", "value")])


def permits(name):
    """One county file: two header rows and a blank line, then a row per county. est = estimate with
    imputation for places that did not report, rep = reported only."""
    d = pd.read_csv(Z.open(name), skiprows=3, header=None, names=COLS, skipinitialspace=True,
                    dtype={"survey": str, "state": str, "county": str, "name": str})
    d["survey"], d["name"] = d.survey.str.strip(), d.name.str.strip()
    d["state"], d["county"] = d.state.str.strip().str.zfill(2), d.county.str.strip().str.zfill(3)
    return d.assign(GEOID=d.state + d.county,
                    units=d[[f"est{s}_units" for s in SIZES]].sum(axis=1),
                    reported=d[[f"rep{s}_units" for s in SIZES]].sum(axis=1),
                    value=d[[f"est{s}_value" for s in SIZES]].sum(axis=1))


PCOLS = (["survey", "state", "id", "county", "census_place", "fips_place", "fips_mcd", "pop", "csa", "cbsa", "footnote",
          "central", "zip", "region_code", "division", "months", "name"]
         + [f"{k}{s}_{m}" for k in ("est", "rep") for s in SIZES for m in ("bldgs", "units", "value")])


def places(name):
    """Connecticut's towns from one Northeast place file."""
    d = pd.read_csv(Z.open(name), skiprows=3, header=None, names=PCOLS, skipinitialspace=True, dtype=str)
    d = d[d.state.str.strip() == "09"].copy()
    d["id"], d["county"], d["name"] = d.id.str.strip(), d.county.str.strip(), d.name.str.strip()
    d["units"] = d[[f"est{s}_units" for s in SIZES]].astype(int).sum(axis=1)
    d["year"] = int(d.survey.iloc[0].strip())
    d["pop"] = pd.to_numeric(d["pop"], errors="coerce")
    return d[["year", "id", "county", "name", "pop", "units"]]


pop = pd.read_csv(Z.open("co-est2025-alldata.csv"), encoding="latin-1", dtype={"STATE": str, "COUNTY": str})
pop = pop[pop.SUMLEV == 50].assign(GEOID=lambda p: p.STATE + p.COUNTY)
Path("data/cb_2024_us_county_20m.zip").write_bytes(Z.read("cb_2024_us_county_20m.zip"))
counties = gpd.read_file("data/cb_2024_us_county_20m.zip")
counties = counties[~counties.STUSPS.isin(["AK", "HI", "PR"])].to_crs(5070)
y25 = permits("co2025a.txt")
print(f"2025 county file: {len(y25):,} rows, {y25.units.sum():,} units permitted; {len(pop):,} counties in the estimates")
2025 county file: 3,029 rows, 1,431,616 units permitted; 3,144 counties in the estimates
The place files have their own layout, seventeen identifying columns before the same 24 counts, so the setup above also defines places(), which reads Connecticut's towns from one of them:
print(f"Connecticut rows in ne2022a.txt: {len(places('ne2022a.txt'))}")
print(places("ne2022a.txt").head(3).to_string(index=False))
Connecticut rows in ne2022a.txt: 172
year id county name pop units
2022 001000 013 Andover town 3228 1
2022 005000 009 Ansonia 18525 8
2022 009000 015 Ashford town 4246 0
Example 1: permits per 1,000 residents by planning region
r = fixed.sum(axis=1).rename("units").to_frame()
r.index = ("09" + r.index).rename("GEOID")
r = r.join(est.set_index("GEOID")[["CTYNAME", "POPESTIMATE2025"]])
r["per_1000_yr"] = r.units / 5 / r.POPESTIMATE2025 * 1000
print(r.sort_values("per_1000_yr", ascending=False)[["CTYNAME", "units", "per_1000_yr"]].round(2).to_string())
CTYNAME units per_1000_yr
GEOID
09190 Western Connecticut Planning Region 7104 2.22
09170 South Central Connecticut Planning Region 5224 1.81
09120 Greater Bridgeport Planning Region 2931 1.74
09150 Northeastern Connecticut Planning Region 766 1.56
09130 Lower Connecticut River Valley Planning Region 1338 1.51
09180 Southeastern Connecticut Planning Region 2135 1.50
09110 Capitol Planning Region 7430 1.49
09160 Northwest Hills Planning Region 716 1.25
09140 Naugatuck Valley Planning Region 2404 1.04
With all five years on the new geography, Western Connecticut permitted the most per resident, 2.22 units per 1,000 a year, and Naugatuck Valley the least, 1.04.
Example 2: on the map
m = counties[counties.STATEFP == "09"].merge(r[["per_1000_yr"]].reset_index(), on="GEOID")
print(f"regions drawn: {len(m)}")
ax = m.plot(column="per_1000_yr", cmap="YlGnBu", legend=True, edgecolor="white", figsize=(8, 5))
ax.set_axis_off()
regions drawn: 9
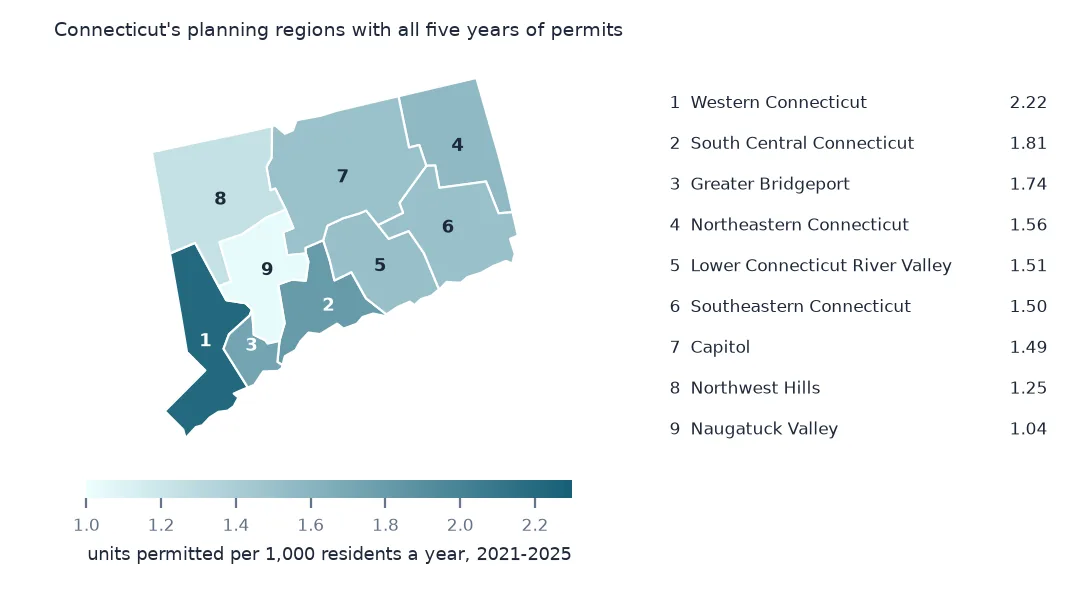
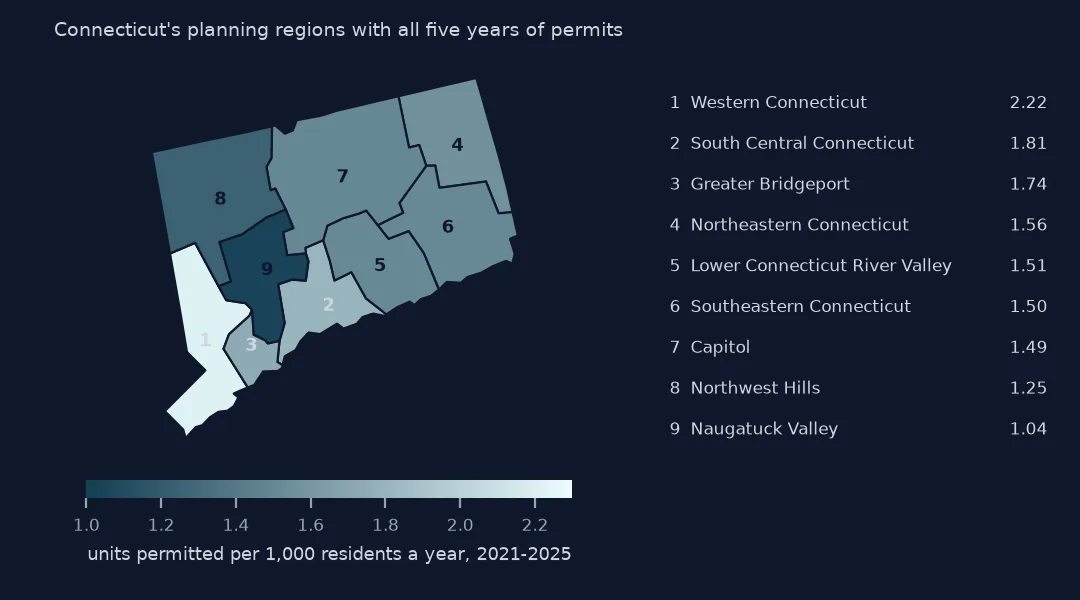
All nine regions join the 2024 boundaries, which draw them, so Connecticut can sit on a national county map with complete numbers.
Example 3: what apportioning by population would have given
t22 = town[town.year == 2022]
w = t22.groupby(["county", "region"])["pop"].sum()
w = w / w.groupby(level="county").transform("sum")
old = ct[2022].set_index("county").units
guess = (w * old.reindex(w.index.get_level_values("county")).to_numpy()).groupby(level="region").sum()
cmp_ = pd.DataFrame({"exact": fixed[2022], "apportioned": guess.round()}).astype(int)
cmp_["error"] = cmp_.apportioned - cmp_.exact
print(cmp_.to_string())
print(f"mean absolute error {cmp_.error.abs().mean():.0f} units, {cmp_.error.abs().sum() / cmp_.exact.sum():.1%} of the year's total")
exact apportioned error
region
110 1699 1636 -63
120 856 621 -235
130 211 208 -3
140 446 697 251
150 130 107 -23
160 155 145 -10
170 1041 893 -148
180 425 452 27
190 963 1167 204
mean absolute error 107 units, 16.3% of the year's total
Splitting each old county's 2022 total between regions by town population is the usual fix when only county figures exist, and here it can be checked. It puts 697 units in Naugatuck Valley (region 140) instead of 446, and 621 in Greater Bridgeport (120) instead of 856: building does not follow where people already live. Across the nine regions it misplaces 16.3% of the year's units, so where town figures exist, regroup them instead.
Internal links
- Housing permits per 1,000 residents — the national map Connecticut belongs on
- Permits against population growth — a comparison that needs both years on one geography
- Why Connecticut is missing from a county map — the planning regions, and converting data that has no town detail
- Census boundary changes — why two census years do not line up
- Read the permit files — the county reader used here