
How to Compare Housing Permits With Population Growth by County
On this page
Problem statement
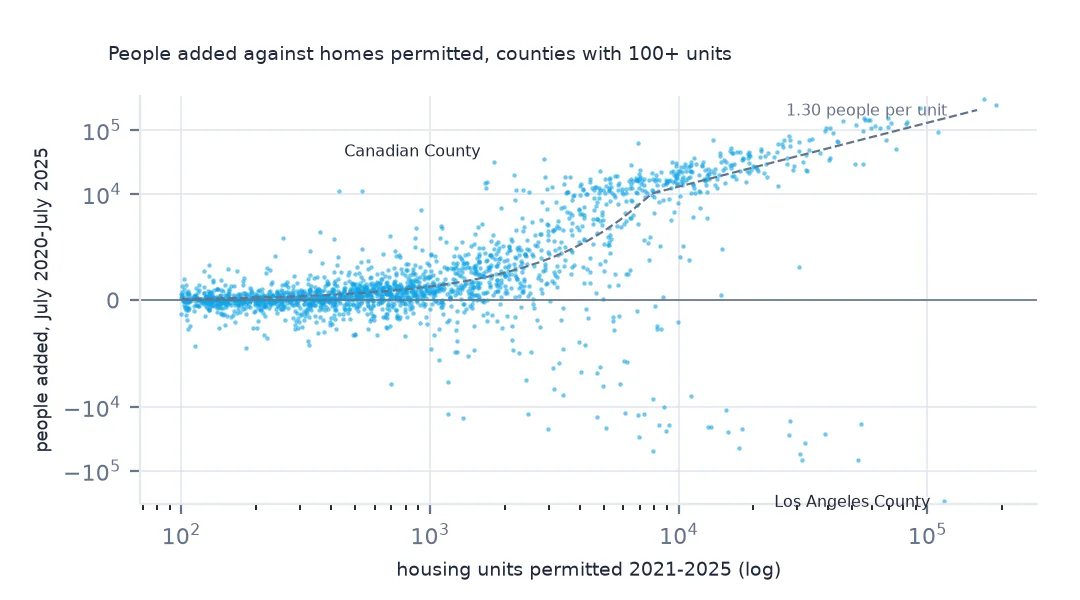
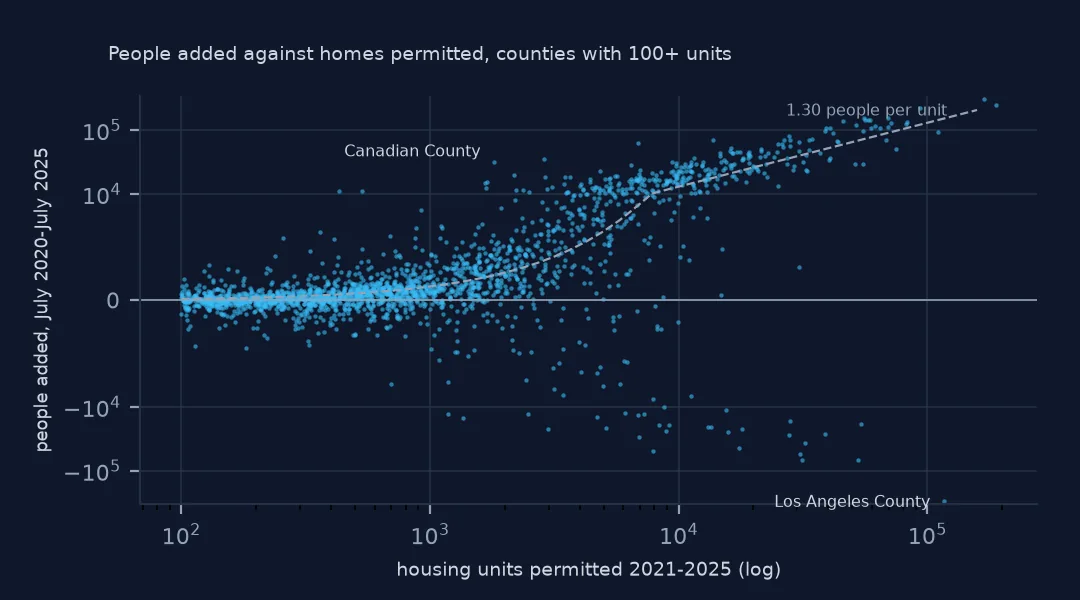
Is a county building enough homes for the people moving in? Two Census Bureau products answer half each: the population estimates say how many people a county gained, and the permit files how many homes it authorised. Put side by side, the ratio of people added to units permitted shows where building ran ahead of growth and where it fell behind. The years have to line up, Connecticut's geography has to match, and a county losing people while building is a real case, not an error. This page compares July 2020 to July 2025 with the permits of 2021–2025.
Quick answer
Sum the 2021–2025 permits by county, join them to the population change from July 2020 to July 2025, and divide:
built = pd.concat([permits(f"co{y}a.txt") for y in range(2021, 2026)]).groupby("GEOID").units.sum()
g = pop.set_index("GEOID")[["STNAME", "CTYNAME", "POPESTIMATE2020", "POPESTIMATE2025"]].join(built)
g = g[g.STNAME != "Connecticut"]
g["added"] = g.POPESTIMATE2025 - g.POPESTIMATE2020
print(f"July 2020 to July 2025: {g.added.sum():,} more people, {g.units.sum():,.0f} units permitted 2021-2025; {g.added.sum() / g.units.sum():.2f} people per unit")
July 2020 to July 2025: 10,097,900 more people, 7,794,045 units permitted 2021-2025; 1.30 people per unit
The US gained 10,097,900 people and permitted 7,794,045 units over those five years: 1.30 people per unit. The ratio is not a verdict by itself, because new units also replace demolished ones and house households that split; it is a yardstick for comparing counties with each other.
Matching the years and the counties
1. Which years go with which
print(pop[["ESTIMATESBASE2020", "POPESTIMATE2020", "POPESTIMATE2025"]].sum().to_string())
print(f"Connecticut rows: {(pop.STNAME == 'Connecticut').sum()} in the estimates, "
      f"{built.index.str.startswith('09').sum()} GEOIDs in the 2021-2025 permits")
ESTIMATESBASE2020 331516113
POPESTIMATE2020 331578104
POPESTIMATE2025 341784857
Connecticut rows: 9 in the estimates, 17 GEOIDs in the 2021-2025 permits
The estimates start at the April 2020 census base, then give 1 July of each year. July 2020 to July 2025 covers five years of change, so it pairs with five calendar years of permits; a permit in 2021 is a home finished in 2022 or later, which this lines up roughly, not exactly. Connecticut has 9 planning regions in the estimates but 17 different codes across its 2021–2025 permits, eight old counties and nine regions, so it is left out here.
2. People added per unit permitted
h = g[g.units >= 1000].copy()
h["per_unit"] = h.added / h.units
print(h.per_unit.describe()[["count", "25%", "50%", "75%"]].round(2).to_string())
print(h.nlargest(6, "per_unit")[["CTYNAME", "STNAME", "added", "units", "per_unit"]].round(2).to_string(index=False))
count 861.00
25% 0.69
50% 1.48
75% 2.18
CTYNAME STNAME added units per_unit
Canadian County Oklahoma 31754 1813.0 17.51
Parker County Texas 35208 2877.0 12.24
Rockland County New York 19968 2177.0 9.17
Hampshire County Massachusetts 15468 1700.0 9.10
Kaufman County Texas 62070 6876.0 9.03
Wise County Texas 14847 1667.0 8.91
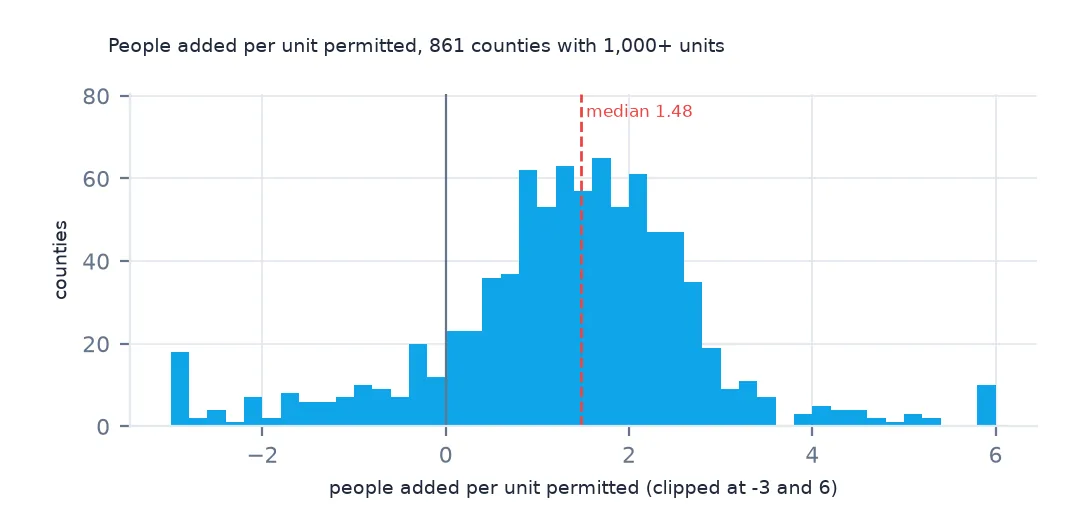
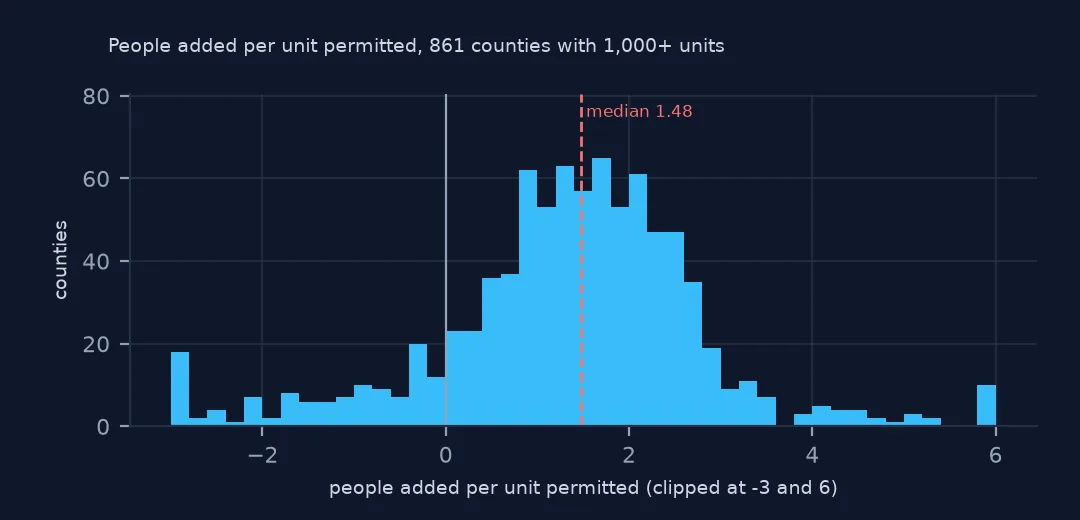
Among the 861 counties that permitted 1,000 or more units, the median county added 1.48 people per unit, and a quarter added under 0.69. At the other end, Canadian County, Oklahoma, outside Oklahoma City, added 31,754 people on 1,813 units, 17.51 per unit, and Parker and Kaufman counties near Dallas–Fort Worth around 9 to 12.
3. Building while shrinking
shrink = g[(g.added < 0) & (g.units >= 1000)].sort_values("units", ascending=False)
print(f"counties that lost people but permitted 1,000+ units: {len(shrink)}")
print(shrink.head(6)[["CTYNAME", "STNAME", "added", "units"]].to_string(index=False))
counties that lost people but permitted 1,000+ units: 119
CTYNAME STNAME added units
Los Angeles County California -301576 116564.0
San Diego County California -18862 54142.0
Kings County New York -68296 52476.0
Philadelphia County Pennsylvania -26456 38671.0
Orange County California -36660 32250.0
Cook County Illinois -69026 31444.0
119 counties lost people while permitting 1,000 or more units. Los Angeles County lost 301,576 residents and permitted 116,564 units; Brooklyn, Philadelphia and Cook County did the same on a smaller scale. Building in a shrinking county is not a mistake in either file: households get smaller and older units are demolished, so a county can need new homes while its population falls.
States and a map of the gap
The data used on this page
The US Census Bureau's Building Permits Survey county files (annual 1990–2025 and year-to-date 2025–2026), its Northeast place files for 2020–2025, the Vintage 2025 county population estimates and the 2024 cartographic boundary counties, all public domain. They were downloaded on 16 October 2026 and saved on this site in one archive, because Census revises recent months as late reports arrive.
from pathlib import Path
import zipfile

import geopandas as gpd
import numpy as np
import pandas as pd
import requests

Path("data").mkdir(exist_ok=True)
# US Census Bureau Building Permits Survey: annual county files co1990a.txt-co2025a.txt, year-to-date county files
# co2501y.txt-co2512y.txt and co2601y.txt-co2608y.txt, Northeast place files ne2020a.txt-ne2025a.txt; the Vintage 2025
# county population estimates; 2024 cartographic boundary counties. Downloaded 16 October 2026, saved here unchanged.
# Live: https://www2.census.gov/econ/bps/County/co2025a.txt (and the same folder for the others),
# https://www2.census.gov/econ/bps/Place/Northeast%20Region/ne2025a.txt,
# https://www2.census.gov/programs-surveys/popest/datasets/2020-2025/counties/totals/co-est2025-alldata.csv,
# https://www2.census.gov/geo/tiger/GENZ2024/shp/cb_2024_us_county_20m.zip
ARCHIVE = "census-building-permits-2026-10-16.zip"
if not Path(f"data/{ARCHIVE}").exists():
    Path(f"data/{ARCHIVE}").write_bytes(requests.get(f"https://data.spatialworkflow.io/{ARCHIVE}", timeout=600).content)
Z = zipfile.ZipFile(f"data/{ARCHIVE}")

SIZES = ["1", "2", "34", "5"]  # buildings with 1 unit, 2 units, 3-4 units, 5 or more units
COLS = (["survey", "state", "county", "region", "division", "name"]
        + [f"{k}{s}_{m}" for k in ("est", "rep") for s in SIZES for m in ("bldgs", "units", "value")])


def permits(name):
    """One county file: two header rows and a blank line, then a row per county. est = estimate with
    imputation for places that did not report, rep = reported only."""
    d = pd.read_csv(Z.open(name), skiprows=3, header=None, names=COLS, skipinitialspace=True,
                    dtype={"survey": str, "state": str, "county": str, "name": str})
    d["survey"], d["name"] = d.survey.str.strip(), d.name.str.strip()
    d["state"], d["county"] = d.state.str.strip().str.zfill(2), d.county.str.strip().str.zfill(3)
    return d.assign(GEOID=d.state + d.county,
                    units=d[[f"est{s}_units" for s in SIZES]].sum(axis=1),
                    reported=d[[f"rep{s}_units" for s in SIZES]].sum(axis=1),
                    value=d[[f"est{s}_value" for s in SIZES]].sum(axis=1))


pop = pd.read_csv(Z.open("co-est2025-alldata.csv"), encoding="latin-1", dtype={"STATE": str, "COUNTY": str})
pop = pop[pop.SUMLEV == 50].assign(GEOID=lambda p: p.STATE + p.COUNTY)
Path("data/cb_2024_us_county_20m.zip").write_bytes(Z.read("cb_2024_us_county_20m.zip"))
counties = gpd.read_file("data/cb_2024_us_county_20m.zip")
counties = counties[~counties.STUSPS.isin(["AK", "HI", "PR"])].to_crs(5070)
y25 = permits("co2025a.txt")
print(f"2025 county file: {len(y25):,} rows, {y25.units.sum():,} units permitted; {len(pop):,} counties in the estimates")
2025 county file: 3,029 rows, 1,431,616 units permitted; 3,144 counties in the estimates
Example 1: by state
s = g.groupby("STNAME")[["added", "units"]].sum()
s["per_unit"] = s.added / s.units
s = s[s.added > 0].sort_values("per_unit")
print("fewest people per unit:", ", ".join(f"{k} {v:.2f}" for k, v in s.per_unit.head(4).items()))
print("most people per unit:", ", ".join(f"{k} {v:.2f}" for k, v in s.per_unit.tail(4).items()))
fewest people per unit: Vermont 0.14, New Mexico 0.25, Oregon 0.34, Pennsylvania 0.42
most people per unit: Texas 2.06, Massachusetts 2.20, Oklahoma 2.22, Rhode Island 2.43
Rhode Island added 2.43 people per unit permitted, Oklahoma 2.22, Massachusetts 2.20 and Texas 2.06. Vermont added 0.14, New Mexico 0.25 and Oregon 0.34. States that lost population are left off the ranking.
Example 2: map
g["per_unit"] = g.added / g.units
m = counties.merge(g[g.units >= 500][["per_unit"]].reset_index(), on="GEOID", how="left")
m["cls"] = pd.cut(m.per_unit, [-1e9, 0, 1, 2, 3, 5, 1e9], right=False)
print(f"counties with 500+ units: {m.per_unit.notna().sum():,}")
print(m.cls.value_counts(sort=False).to_string())
ax = m.plot(column="cls", cmap="RdYlBu_r", legend=True, missing_kwds={"color": "lightgrey"}, figsize=(10, 6))
ax.set_axis_off()
counties with 500+ units: 1,250
cls
[-1000000000.0, 0.0) 203
[0.0, 1.0) 279
[1.0, 2.0) 397
[2.0, 3.0) 262
[3.0, 5.0) 75
[5.0, 1000000000.0) 34
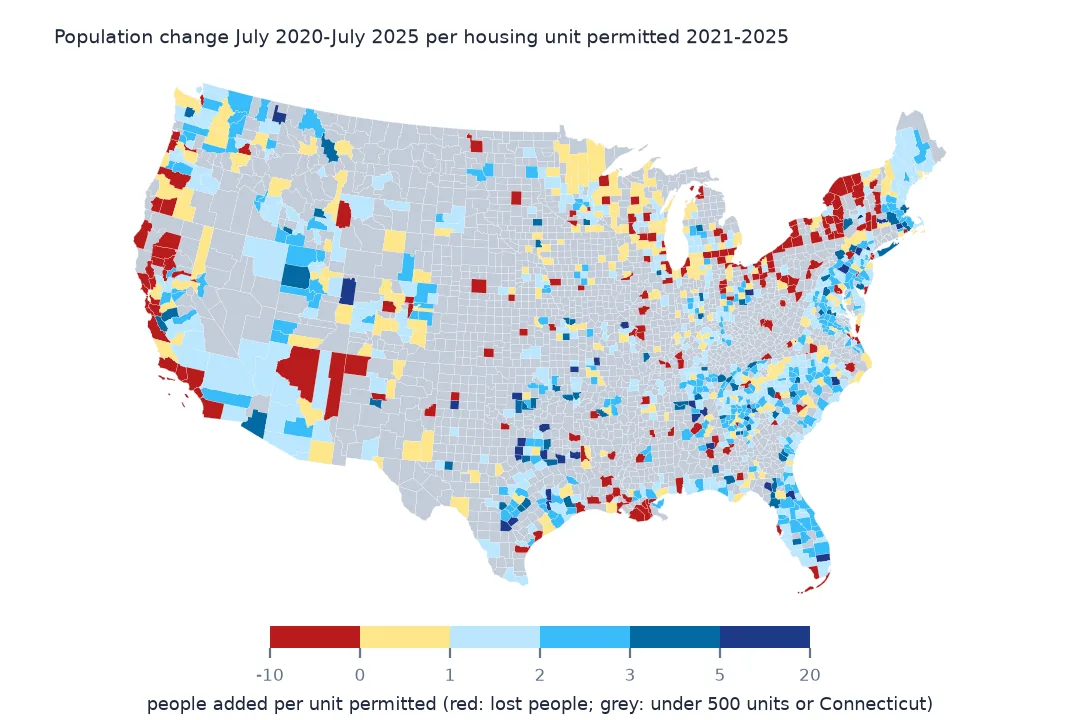
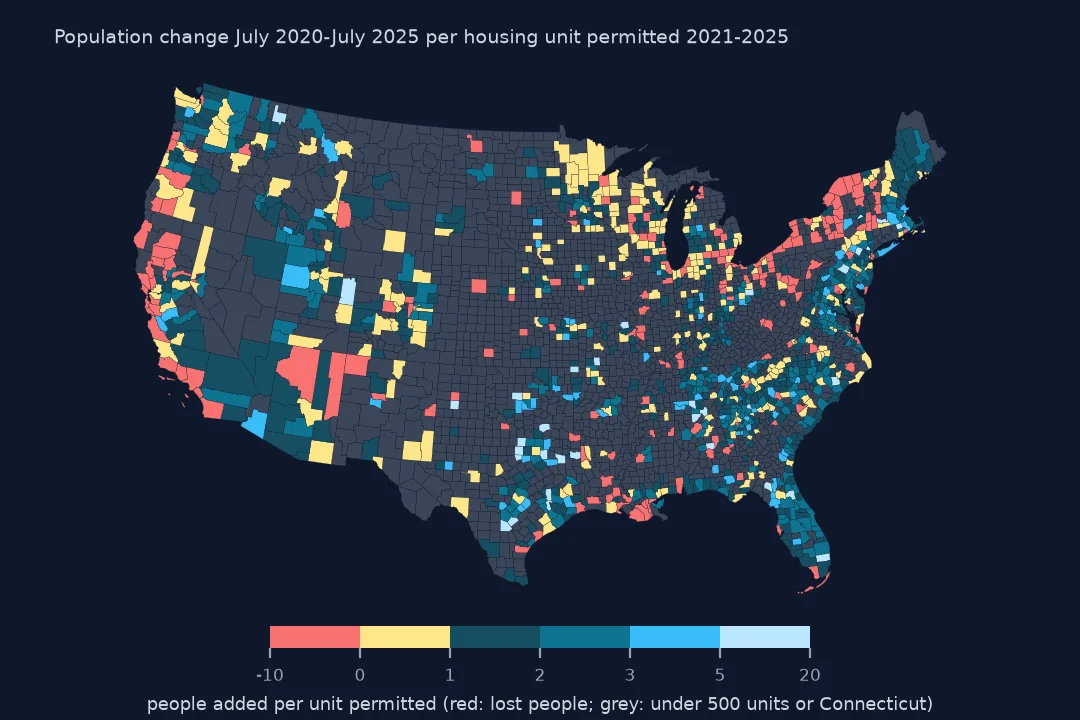
203 of the counties with 500 or more units lost people, and 34 added five or more people per unit. Most of the counties that lost people are in California, the Northeast and around the Great Lakes; the highest ratios include the outer counties of Dallas–Fort Worth and Oklahoma City listed above.
Internal links
- Housing permits per 1,000 residents — the rate without population change
- Connecticut's planning regions — why Connecticut is left out here, and how to put it back
- US housing permits since 1990 — the national series
- Census boundary changes — the general problem of comparing years