
How to Compare This Year's Housing Permits Month by Month
On this page
Problem statement
The Census Bureau's annual permit file for a year appears months after the year ends. For the current year there are monthly county files, coYYMMy.txt, but each is a year-to-date running total, not a month. Comparing this year with last means pairing the same months, differencing the running totals to get months, and remembering that December's running total is not the annual figure. This page does all three with the files to August 2026 and the same months of 2025.
Quick answer
Read the two August year-to-date files and compare:
ytd26, ytd25 = permits("co2608y.txt"), permits("co2508y.txt")
print(f"January-August 2026: {ytd26.units.sum():,} units; same months of 2025: {ytd25.units.sum():,} ({ytd26.units.sum() / ytd25.units.sum() - 1:+.1%})")
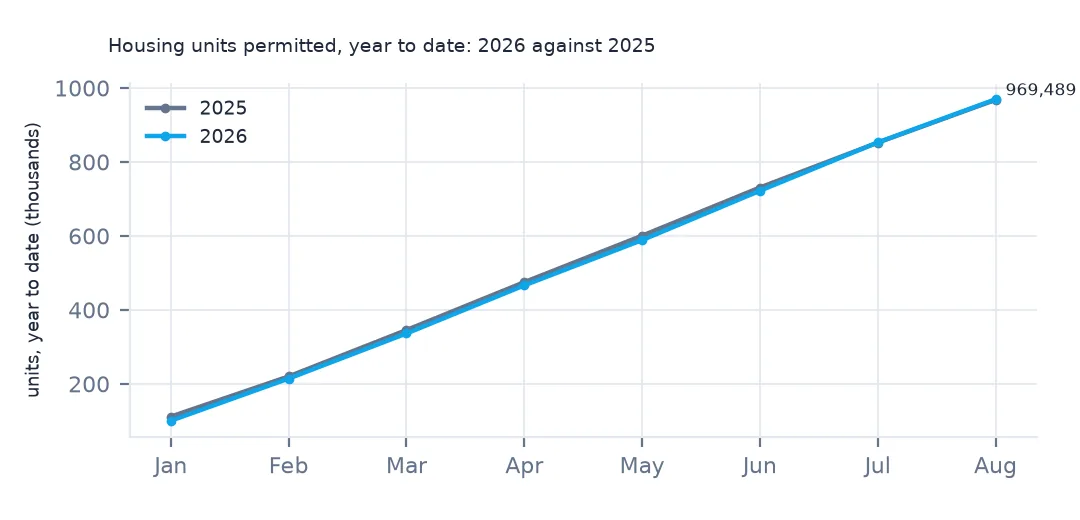
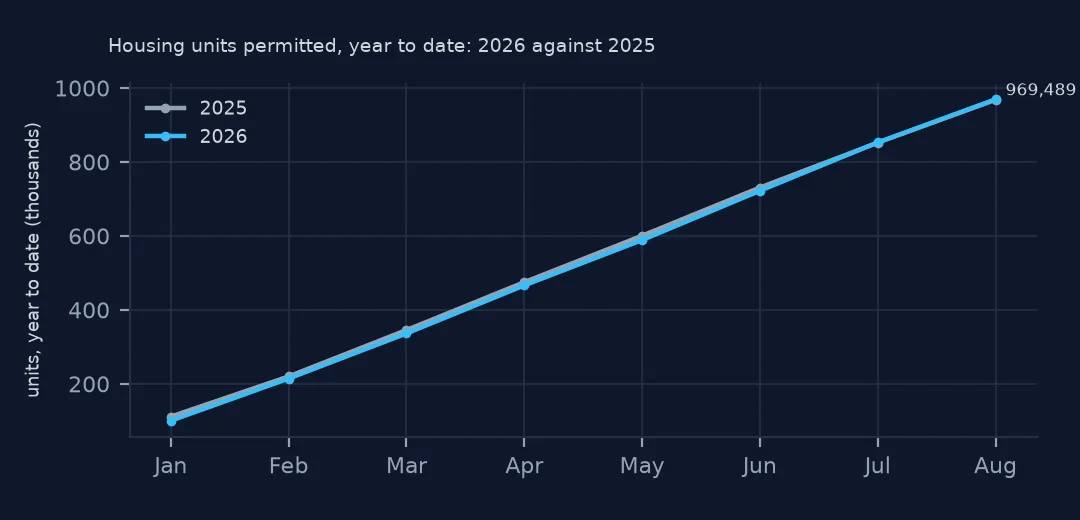
January-August 2026: 969,489 units; same months of 2025: 967,947 (+0.2%)
From January to August 2026, 969,489 units were permitted, 0.2% more than in the same months of 2025. Nationally, the year is flat.
From cumulative files to months
1. Each file is a running total
cum = pd.DataFrame({yr: [permits(f"co{yr % 100}{m:02d}y.txt").units.sum() for m in range(1, 9)] for yr in (2025, 2026)}, index=range(1, 9))
print(cum.to_string())
2025 2026
1 111511 100312
2 220086 214298
3 345555 336204
4 474973 466238
5 600635 588727
6 730909 722040
7 852234 852819
8 967947 969489
Each file adds a month to the one before: 111,511 units to January 2025, 220,086 to February, and so on. Summing the eight files would count January eight times.
2. Differences give the months
month = cum.diff().fillna(cum.iloc[0]).astype(int)
month["change"] = (month[2026] / month[2025] - 1).map("{:+.1%}".format)
print(month.to_string())
2025 2026 change
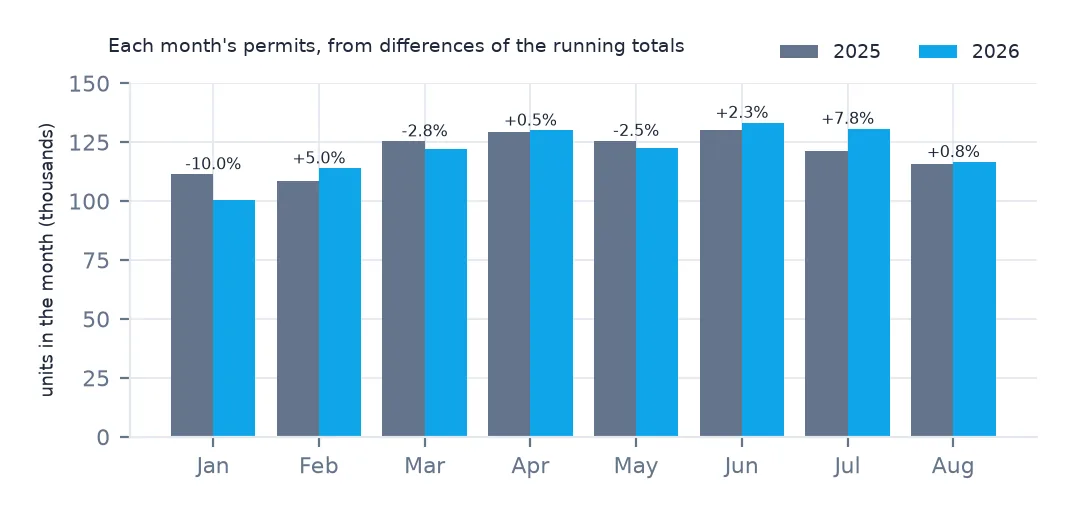
1 111511 100312 -10.0%
2 108575 113986 +5.0%
3 125469 121906 -2.8%
4 129418 130034 +0.5%
5 125662 122489 -2.5%
6 130274 133313 +2.3%
7 121325 130779 +7.8%
8 115713 116670 +0.8%
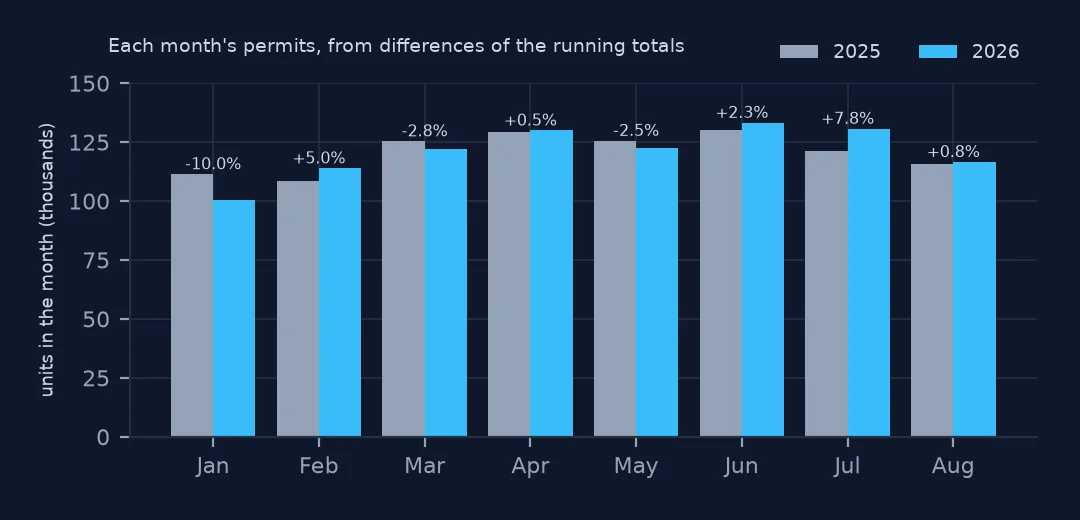
Differencing gives the months. January 2026 was 10.0% below January 2025, July 7.8% above; the rest are within a few percent either way. Single months move with weather and with when big projects file, so compare totals over several months before calling a trend.
3. By size of building
for s, lab in [("1", "1 unit"), ("5", "5+ units")]:
    a, b = ytd26[f"est{s}_units"].sum(), ytd25[f"est{s}_units"].sum()
    print(f"{lab}: {b:,} -> {a:,} ({a / b - 1:+.1%})")
1 unit: 637,251 -> 621,420 (-2.5%)
5+ units: 294,205 -> 313,772 (+6.7%)
Under the flat total, the mix shifted: single-family units fell 2.5% to 621,420, and units in buildings of five or more rose 6.7% to 313,772.
States, and December against the annual file
The data used on this page
The US Census Bureau's Building Permits Survey county files (annual 1990–2025 and year-to-date 2025–2026), its Northeast place files for 2020–2025, the Vintage 2025 county population estimates and the 2024 cartographic boundary counties, all public domain. They were downloaded on 16 October 2026 and saved on this site in one archive, because Census revises recent months as late reports arrive.
from pathlib import Path
import zipfile

import geopandas as gpd
import numpy as np
import pandas as pd
import requests

Path("data").mkdir(exist_ok=True)
# US Census Bureau Building Permits Survey: annual county files co1990a.txt-co2025a.txt, year-to-date county files
# co2501y.txt-co2512y.txt and co2601y.txt-co2608y.txt, Northeast place files ne2020a.txt-ne2025a.txt; the Vintage 2025
# county population estimates; 2024 cartographic boundary counties. Downloaded 16 October 2026, saved here unchanged.
# Live: https://www2.census.gov/econ/bps/County/co2025a.txt (and the same folder for the others),
# https://www2.census.gov/econ/bps/Place/Northeast%20Region/ne2025a.txt,
# https://www2.census.gov/programs-surveys/popest/datasets/2020-2025/counties/totals/co-est2025-alldata.csv,
# https://www2.census.gov/geo/tiger/GENZ2024/shp/cb_2024_us_county_20m.zip
ARCHIVE = "census-building-permits-2026-10-16.zip"
if not Path(f"data/{ARCHIVE}").exists():
    Path(f"data/{ARCHIVE}").write_bytes(requests.get(f"https://data.spatialworkflow.io/{ARCHIVE}", timeout=600).content)
Z = zipfile.ZipFile(f"data/{ARCHIVE}")

SIZES = ["1", "2", "34", "5"]  # buildings with 1 unit, 2 units, 3-4 units, 5 or more units
COLS = (["survey", "state", "county", "region", "division", "name"]
        + [f"{k}{s}_{m}" for k in ("est", "rep") for s in SIZES for m in ("bldgs", "units", "value")])


def permits(name):
    """One county file: two header rows and a blank line, then a row per county. est = estimate with
    imputation for places that did not report, rep = reported only."""
    d = pd.read_csv(Z.open(name), skiprows=3, header=None, names=COLS, skipinitialspace=True,
                    dtype={"survey": str, "state": str, "county": str, "name": str})
    d["survey"], d["name"] = d.survey.str.strip(), d.name.str.strip()
    d["state"], d["county"] = d.state.str.strip().str.zfill(2), d.county.str.strip().str.zfill(3)
    return d.assign(GEOID=d.state + d.county,
                    units=d[[f"est{s}_units" for s in SIZES]].sum(axis=1),
                    reported=d[[f"rep{s}_units" for s in SIZES]].sum(axis=1),
                    value=d[[f"est{s}_value" for s in SIZES]].sum(axis=1))


pop = pd.read_csv(Z.open("co-est2025-alldata.csv"), encoding="latin-1", dtype={"STATE": str, "COUNTY": str})
pop = pop[pop.SUMLEV == 50].assign(GEOID=lambda p: p.STATE + p.COUNTY)
Path("data/cb_2024_us_county_20m.zip").write_bytes(Z.read("cb_2024_us_county_20m.zip"))
counties = gpd.read_file("data/cb_2024_us_county_20m.zip")
counties = counties[~counties.STUSPS.isin(["AK", "HI", "PR"])].to_crs(5070)
y25 = permits("co2025a.txt")
print(f"2025 county file: {len(y25):,} rows, {y25.units.sum():,} units permitted; {len(pop):,} counties in the estimates")
2025 county file: 3,029 rows, 1,431,616 units permitted; 3,144 counties in the estimates
Example 1: by state
names = pop.drop_duplicates("STATE").set_index("STATE").STNAME
st = pd.DataFrame({"2025": ytd25.groupby("state").units.sum(), "2026": ytd26.groupby("state").units.sum()})
st.index = st.index.map(names)
st["change"] = st["2026"] / st["2025"] - 1
big = st[st["2025"] >= 10_000].sort_values("change")
print(f"states with 10,000+ units in January-August 2025: {len(big)}")
print("down most:", ", ".join(f"{k} {v:+.1%}" for k, v in big.change.head(4).items()))
print("up most:", ", ".join(f"{k} {v:+.1%}" for k, v in big.change.tail(4).items()))
states with 10,000+ units in January-August 2025: 29
down most: Nevada -29.0%, Louisiana -12.0%, Arizona -11.3%, Florida -11.2%
up most: Virginia +17.3%, Washington +19.8%, Alabama +22.4%, New York +47.5%
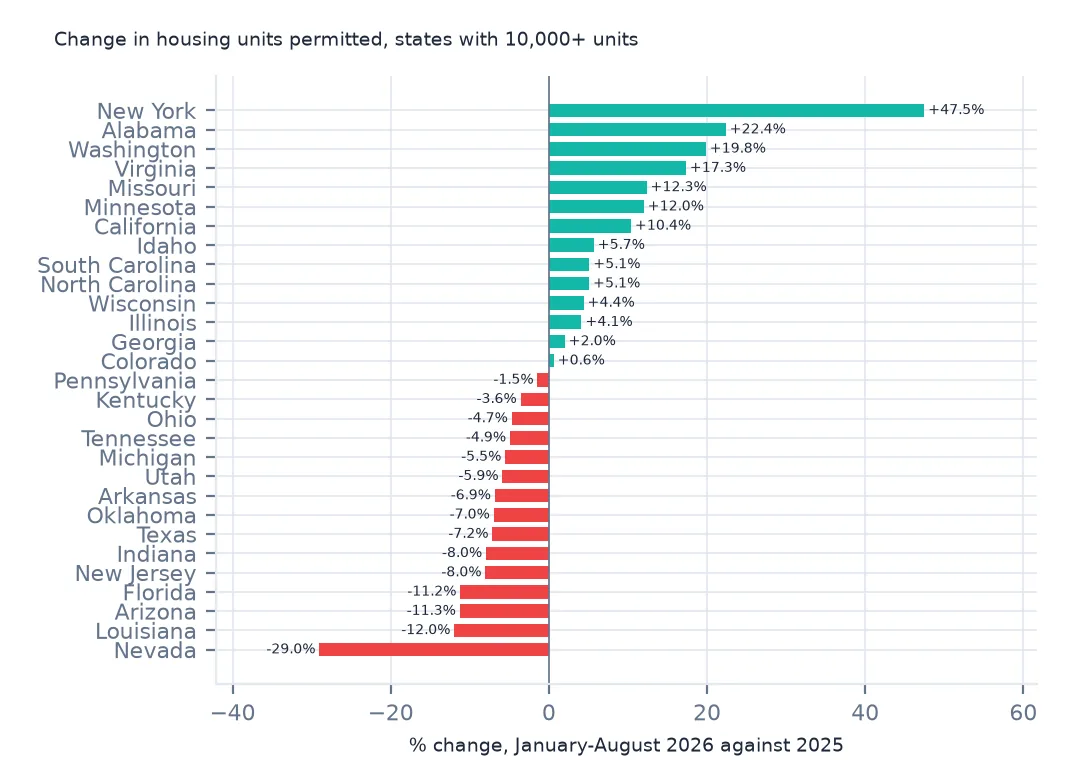
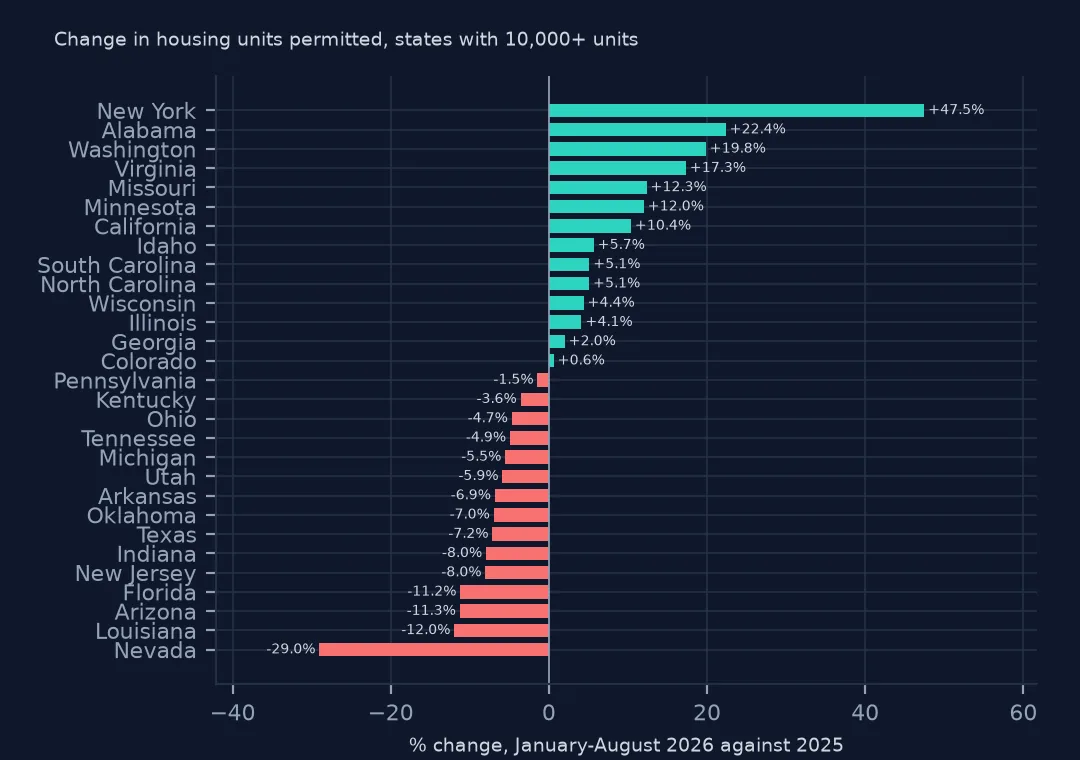
Among states with 10,000 or more units in the first eight months of 2025, New York rose 47.5% and Alabama 22.4%, while Nevada fell 29.0% and Arizona and Florida about 11%.
Example 2: December's running total is not the annual figure
dec, annual = permits("co2512y.txt"), permits("co2025a.txt")
print(f"Dec 2025 year-to-date: {dec.units.sum():,} units in {len(dec):,} rows; annual 2025 file: {annual.units.sum():,} in {len(annual):,} rows")
print(f"reported units: {dec.reported.sum():,} against {annual.reported.sum():,}")
Dec 2025 year-to-date: 1,426,723 units in 3,020 rows; annual 2025 file: 1,431,616 in 3,029 rows
reported units: 1,233,245 against 1,298,881
The December 2025 year-to-date file totals 1,426,723 units in 3,020 rows; the annual 2025 file 1,431,616 in 3,029. The annual file includes places that report only once a year, and its reported units are 1,298,881 against 1,233,245. For full years use the annual file, and for the current year compare year-to-date with year-to-date.
Internal links
- US housing permits since 1990 — the annual series these months extend
- Reported against imputed units — what the estimate adds
- Read the permit files — file names and the reader