
The Common Core of Data Explained: What NCES Records for Every Public School
On this page
Problem statement
Every number in an American public school dataset, from a news map of school sizes to a district's ranking, traces back to the Common Core of Data (CCD), the census of public schools that NCES compiles each year from the state education agencies. It is administrative data, not a survey: each state sends a record for every school it runs, with the counts it keeps. That makes it complete, close to 100,000 schools, and it makes it uneven, because each state decides what a school is and which counts it reports. This page shows what the CCD records for 2024-25 and where the states differ.
Quick answer
Count what the 2024-25 collection holds, after removing the codes that stand for missing values:
print(f"schools: {len(sch):,}; students: {sch.TOTAL.sum():,.0f}; teachers (FTE): {sch.FTE.sum():,.0f}")
print(f"districts: {sch.LEAID.nunique():,}; states and territories: {sch.LSTATE.nunique()}")
schools: 100,237; students: 49,343,524; teachers (FTE): 3,177,662
districts: 18,406; states and territories: 56
The 100,237 operating schools enrol 49,343,524 students and employ 3,177,662 full-time-equivalent teachers, in 18,406 districts. Enrolment is each school's membership, a count of the students enrolled on or about 1 October, so it is a snapshot early in the school year, not an average over it.
A school is what a state reports
1. A school is a record a state sends
print(sch.SCHOOL_TYPE_TEXT.value_counts().to_string())
print(f"operating schools with no students: {(sch.TOTAL == 0).sum()}; with no number: {sch.TOTAL.isna().sum()}")
SCHOOL_TYPE_TEXT
Regular School 91375
Alternative Education School 5378
Special Education School 1872
Career and Technical School 1612
operating schools with no students: 2674; with no number: 992
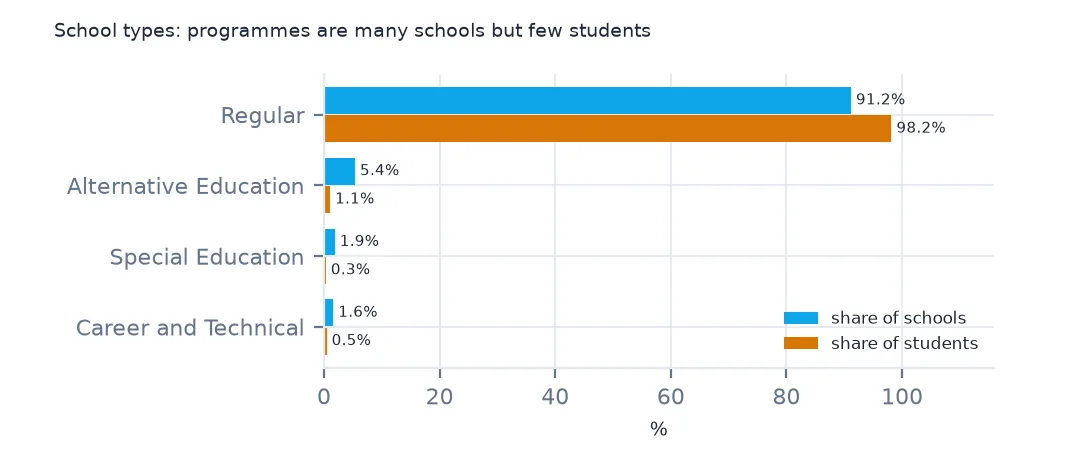
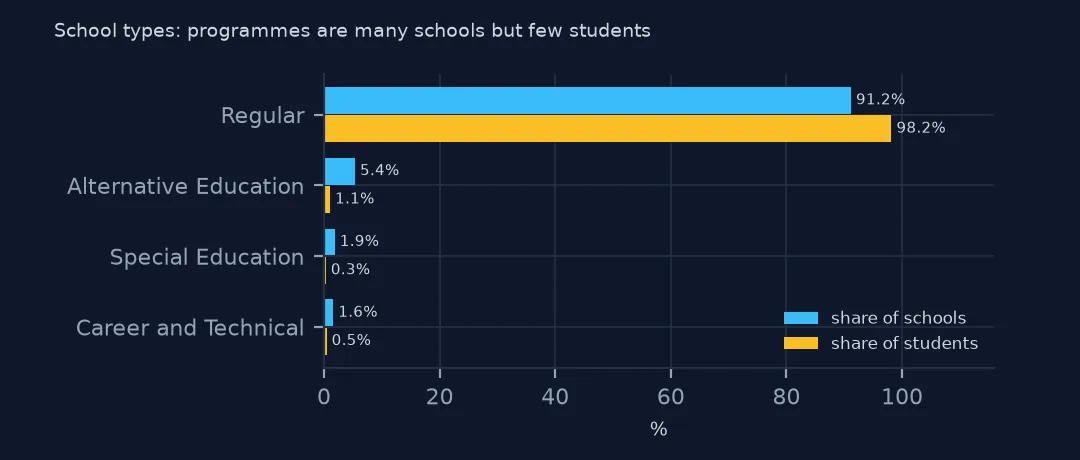
Most schools are regular schools, 91,375, but 5,378 are alternative education schools, 1,872 special education schools and 1,612 career and technical schools. Many of these are programmes rather than buildings with their own pupils: 2,674 operating schools report no students at all, because their students are counted at the school they are enrolled in, and 992 have no number. A count of "schools" therefore depends on which types you keep.
2. States choose what to report
rep = sch.groupby("LSTATE").agg(frl=("TOTFRL", lambda s: s.notna().mean()), dc=("DIRECTCERT", lambda s: s.notna().mean()))
print(f"states reporting free and reduced-price lunch for most schools: {(rep.frl > 0.5).sum()}; direct certification only: {((rep.frl <= 0.5) & (rep.dc > 0.5)).sum()}")
print(rep[(rep.frl <= 0.5)].round(2).to_string())
states reporting free and reduced-price lunch for most schools: 45; direct certification only: 7
frl dc
LSTATE
AS 0.00 0.00
AZ 0.02 0.64
DC 0.00 1.00
DE 0.00 0.96
GU 0.00 0.91
MA 0.00 0.99
OH 0.44 0.40
PA 0.00 0.00
SC 0.00 0.00
TN 0.00 0.96
WV 0.00 0.95
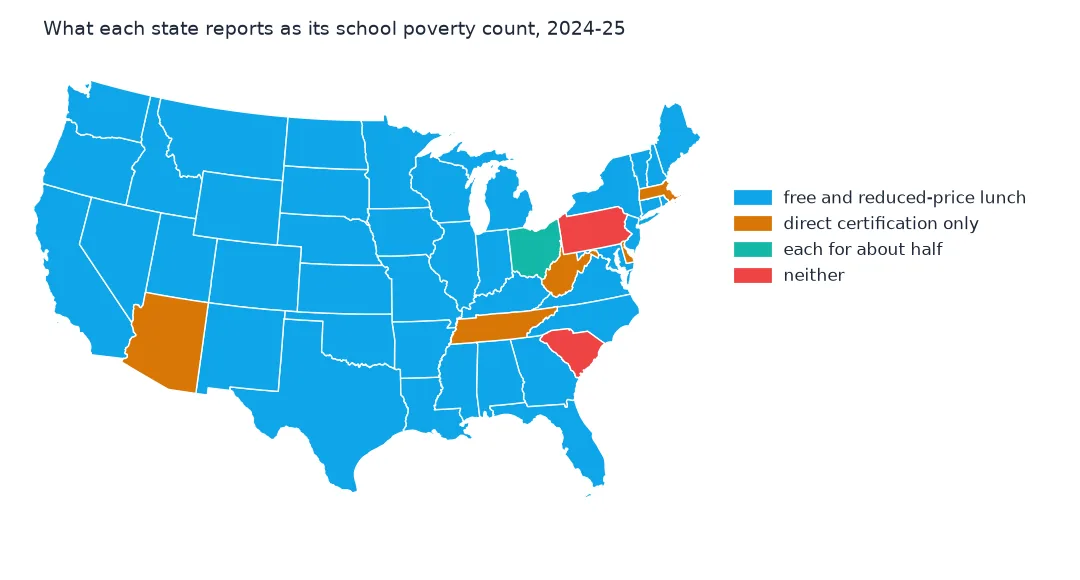
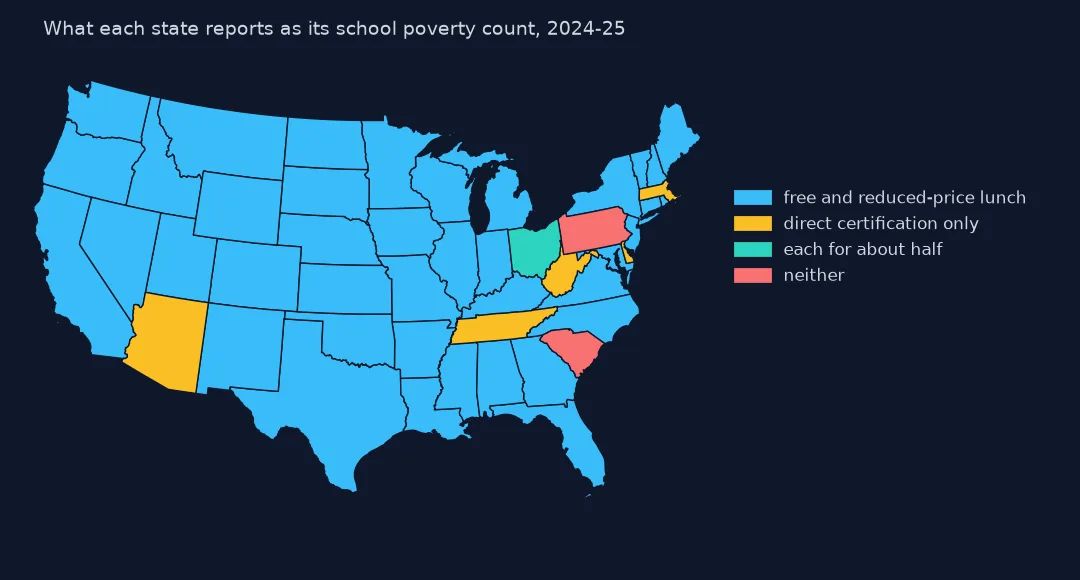
Free and reduced-price lunch eligibility, the most used poverty measure in school data, is reported by 45 states and territories for most of their schools. Seven, including Massachusetts, Tennessee, Delaware, West Virginia and DC, report only direct certification, the count of students enrolled in benefit programmes, and Pennsylvania, South Carolina and American Samoa report neither for 2024-25. Ohio reports each for about half its schools. A national map of free-lunch shares has holes where those states are.
3. Charter is a state's law, not a school type
print(sch.CHARTER_TEXT.value_counts().to_string())
n_share = sch.groupby("LSTATE").CHARTER_TEXT.apply(lambda s: (s == "N").mean())
print("N for every school:", sorted(n_share[n_share > 0.99].index), "| N for a few:", n_share[(n_share > 0) & (n_share <= 0.99)].round(3).to_dict())
CHARTER_TEXT
No 88477
Yes 8068
N 3692
N for every school: ['MP', 'MT', 'ND', 'NE', 'SD', 'VI', 'VT'] | N for a few: {'AZ': 0.02, 'CA': 0.0, 'FL': 0.0, 'IA': 0.001, 'ID': 0.003, 'KS': 0.001, 'LA': 0.001, 'ME': 0.005, 'MI': 0.001, 'MN': 0.002, 'MS': 0.008, 'NC': 0.001, 'NH': 0.002, 'NM': 0.045, 'NV': 0.003, 'OK': 0.002, 'OR': 0.001, 'UT': 0.002, 'WA': 0.003, 'WI': 0.001, 'WY': 0.003}
The charter column has three values. 8,068 schools are charters and 88,477 are not, and 3,692 are "N", not applicable. Every school in Montana, Nebraska, North Dakota, South Dakota and Vermont is N, along with the Northern Mariana Islands and the Virgin Islands, and in other states a handful, such as Bureau of Indian Education schools and interstate districts. Treat N as "no charter schools here", not as missing.
How big a school is
The data used on this page
NCES's Public School Characteristics layer from the Education Demographic and Geographic Estimates (EDGE) program: the 2024-25 Common Core of Data on EDGE's school points, every record of its ArcGIS service, downloaded on 28 October 2026 and saved on this site, because the "Current" layer is replaced each school year. Public domain. Counts are headcounts reported by state education agencies; teachers are full-time equivalents.
from pathlib import Path
import zipfile

import geopandas as gpd
import numpy as np
import pandas as pd
import requests

Path("data").mkdir(exist_ok=True)
# NCES EDGE "Public School Characteristics" for 2024-25 (the Common Core of Data on EDGE's school points), EDGE's school
# neighborhood poverty estimates for 2021-22, and the Census Bureau's 2024 counties and states. Saved 28 October 2026:
# the "Current" layers are replaced every school year.
# Live: https://services1.arcgis.com/Ua5sjt3LWTPigjyD/arcgis/rest/services/School_Characteristics_Current/FeatureServer/1
ARCHIVE = "nces-schools-2026-10-28.zip"
if not Path(f"data/{ARCHIVE}").exists():
    Path(f"data/{ARCHIVE}").write_bytes(requests.get(f"https://data.spatialworkflow.io/{ARCHIVE}", timeout=600).content)
Z = zipfile.ZipFile(f"data/{ARCHIVE}")
sch = pd.read_csv(Z.open("school-characteristics-2024-25.csv"), dtype={"NCESSCH": str, "LEAID": str, "CNTY": str, "LZIP": str, "LSTREET2": str})
for f in ["cb_2024_us_county_20m.zip", "cb_2024_us_state_20m.zip"]:
    Path(f"data/{f}").write_bytes(Z.read(f))
print(f"NCES public schools 2024-25: {len(sch):,} records")
sch["LSTATE"] = sch.LSTATE.str.strip()                                    # stored padded to three characters
NUM = ["TOTAL", "FTE", "STUTERATIO", "TOTFRL", "FRELCH", "REDLCH", "DIRECTCERT", "AM", "AS_", "BL", "HP", "HI", "TR", "WH"]
sch[NUM] = sch[NUM].where(sch[NUM] >= 0)                                  # -1 missing, -2 not applicable, -9 below quality standards
sch = sch[sch.SY_STATUS_TEXT.isin(["Open", "New", "Reopened", "Added", "Changed Boundary/Agency"])]
print(f"operating schools: {len(sch):,}; students: {sch.TOTAL.sum():,.0f}")
NCES public schools 2024-25: 101,110 records
operating schools: 100,237; students: 49,343,524
Example 1: how big a school is
print(sch.TOTAL.describe(percentiles=[0.1, 0.5, 0.9]).round(0).to_string())
print(sch.groupby("SCHOOL_TYPE_TEXT").TOTAL.median().to_string())
count 99245.0
mean 497.0
std 479.0
min 0.0
10% 74.0
50% 408.0
90% 933.0
max 29320.0
SCHOOL_TYPE_TEXT
Alternative Education School 36.0
Career and Technical School 0.0
Regular School 433.0
Special Education School 46.0
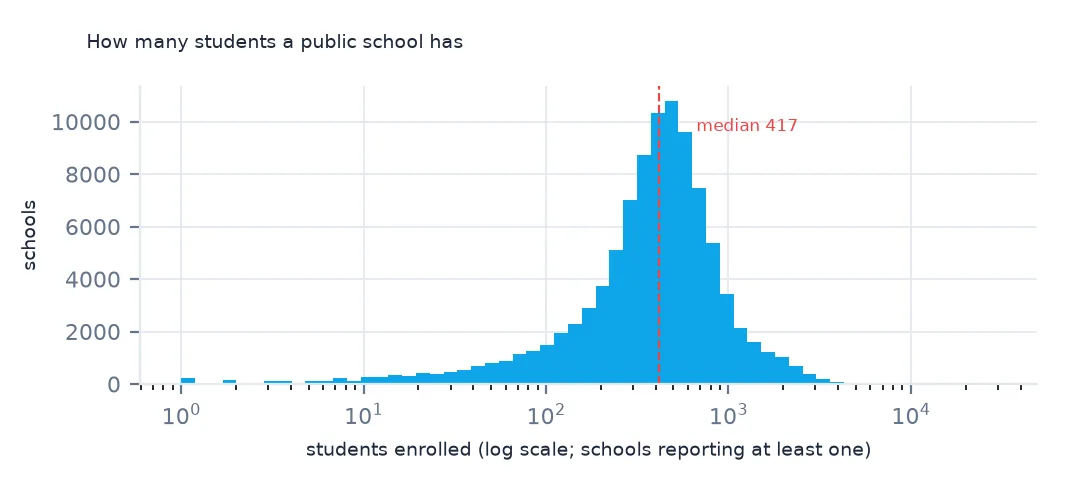
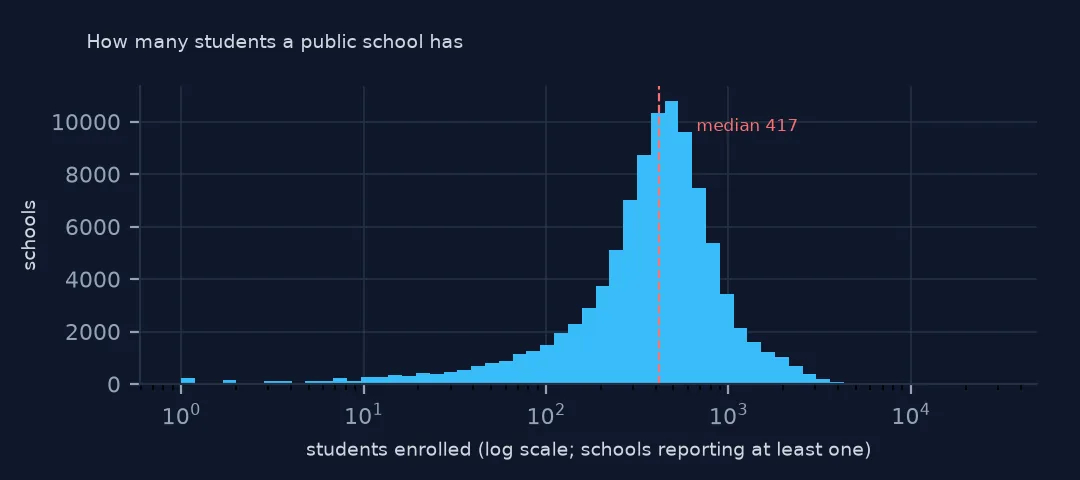
Among schools that report students, the median has 408 and the middle 80% run from 74 to 933. The largest record, 29,320, is a full-time online charter school in Pennsylvania. By type, a regular school's median is 433 students, an alternative school's 36 and a special education school's 46, while the median career and technical school reports none: its students are counted at their home high school.
Getting the school data without code
- Look first: NCES's Search for Public Schools shows one school's CCD record: address, grades, enrolment by grade and race, teachers, free-lunch counts and its locale.
- Tables without code: the Elementary/Secondary Information System (ElSi) builds a table of any CCD columns for schools, districts or states and any years, and downloads it as a spreadsheet.
- The full files: the CCD data files page has each year's directory, membership, staff and school lunch files as zipped CSV with their documentation. The membership file is long, one row per school, grade, race and sex, and runs to millions of rows.
- On a map: NCES's EDGE school locations are point files for each school year, as shapefiles and spreadsheets, and EDGE publishes the characteristics used here as an ArcGIS layer that QGIS and ArcGIS can open directly.
- The codes: in every file, -1 or M means missing, -2 or N not applicable, and -9 a value that did not meet NCES's quality standards. Filter them before summing.
- The copy these pages use: downloaded on 28 October 2026 and saved at data.spatialworkflow.io.
- Credit: National Center for Education Statistics, Common Core of Data, with the school year. It is public domain.
Internal links
- Reading the data — ids, statuses and points
- Free and reduced-price lunch — the count half the states report differently
- Charter schools by state — where the charter flag matters
- Locale codes explained — the twelve city-to-rural classes