
How to Map Public Schools and Students per School by County
On this page
Problem statement
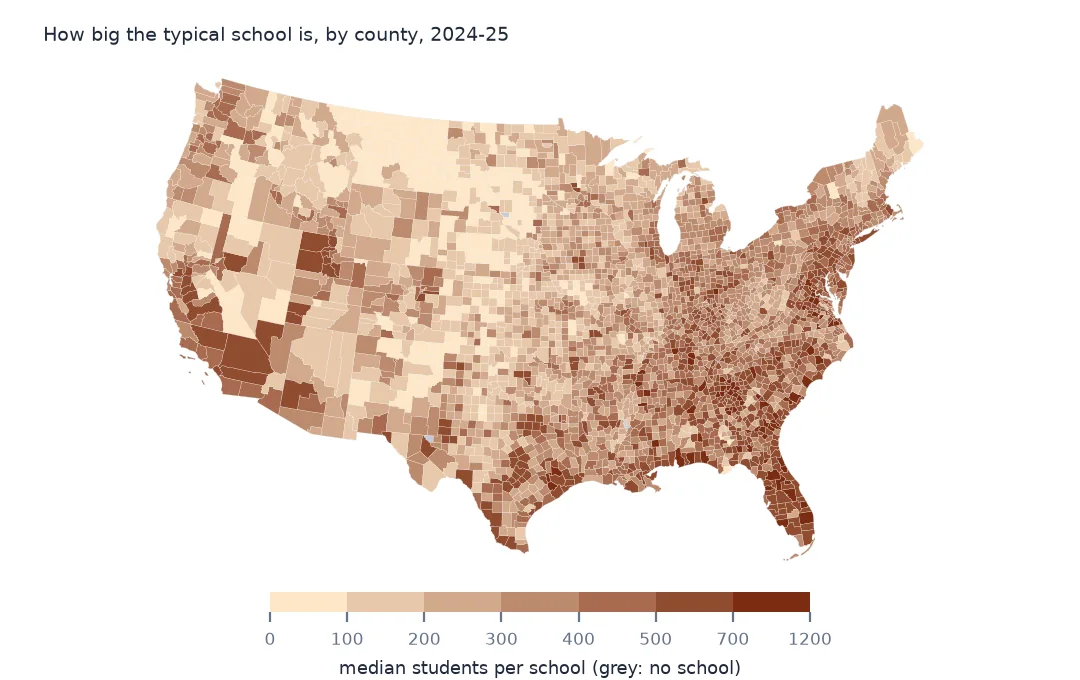
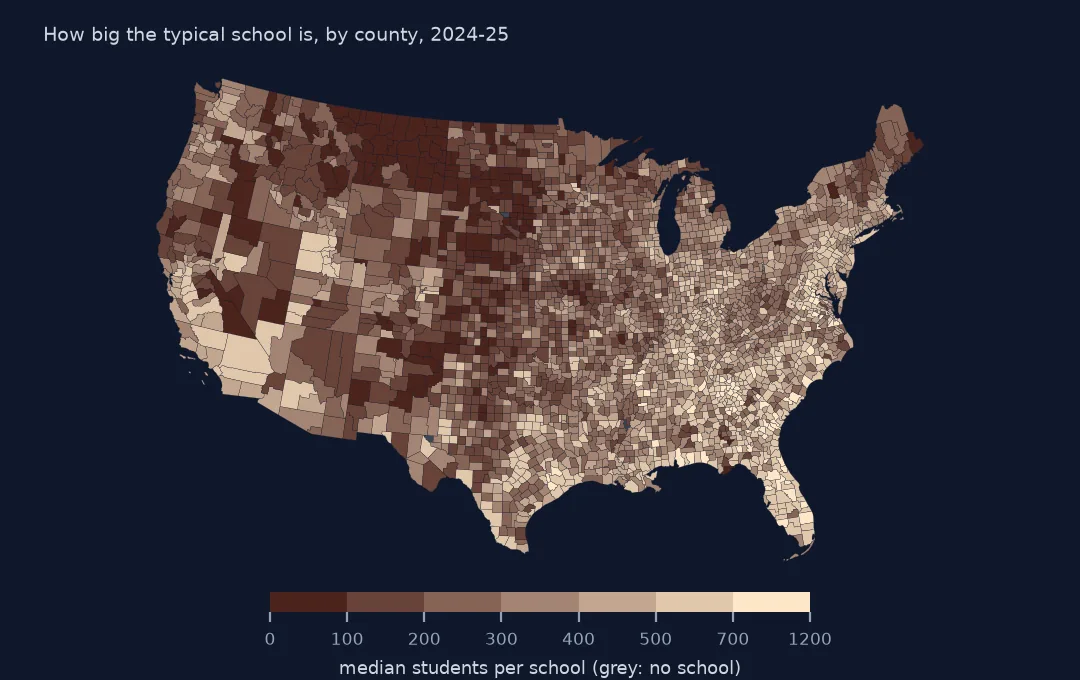
A county map of schools is the first thing most people draw from NCES's school data, and the obvious version, a count of schools per county, mostly shows where people live. The more telling measure is how big the schools are: across the country the median school in a county ranges from a handful of students to more than a thousand, and that says more about rural America and suburban growth than any count. Each school record carries its county's FIPS code, so the join needs no geometry, but the code and the point don't always agree. This page counts schools and students per county, checks the code against the point, and maps the median school size.
Quick answer
Group the operating schools by their CNTY code and join the result to the county boundaries:
counties = gpd.read_file("data/cb_2024_us_county_20m.zip")
per = sch.groupby("CNTY").agg(schools=("NCESSCH", "size"), students=("TOTAL", "sum"))
per["median_size"] = sch[sch.TOTAL > 0].groupby("CNTY").TOTAL.median()          # schools that report students
c = counties.merge(per, left_on="GEOID", right_index=True, how="left")
print(f"counties with a school: {c.schools.notna().sum():,} of {len(c):,}")
print(c.nlargest(5, "schools")[["NAMELSAD", "STUSPS", "schools", "students"]].to_string(index=False))
counties with a school: 3,218 of 3,222
NAMELSAD STUSPS schools students
Los Angeles County CA 2197.0 1262149.0
Cook County IL 1389.0 696942.0
Maricopa County AZ 1281.0 725139.0
Harris County TX 1167.0 885618.0
San Diego County CA 758.0 466146.0
3,218 of the 3,222 counties and county equivalents have at least one school. Los Angeles County leads with 2,197 schools and 1,262,149 students, then Cook County, Illinois, with 1,389. Harris County, Texas, is fourth by schools, with 1,167, but second of the five by students, 885,618, because its schools are larger than Chicago's.
Counts, sizes and the county code
1. Check the county code against the point
g = gpd.GeoDataFrame(sch, geometry=gpd.points_from_xy(sch.LONCOD, sch.LATCOD), crs=4269)
j = gpd.sjoin(g, counties[["GEOID", "geometry"]], how="left", predicate="within")
agree = (j.GEOID == j.CNTY)
print(f"point inside its CNTY county: {agree.mean():.2%}; outside every county: {j.GEOID.isna().sum()}; in another county: {(~agree & j.GEOID.notna()).sum()}")
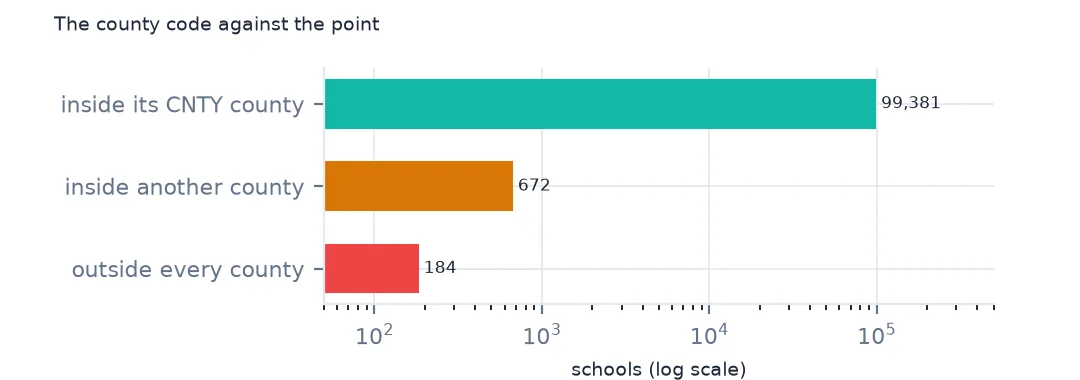
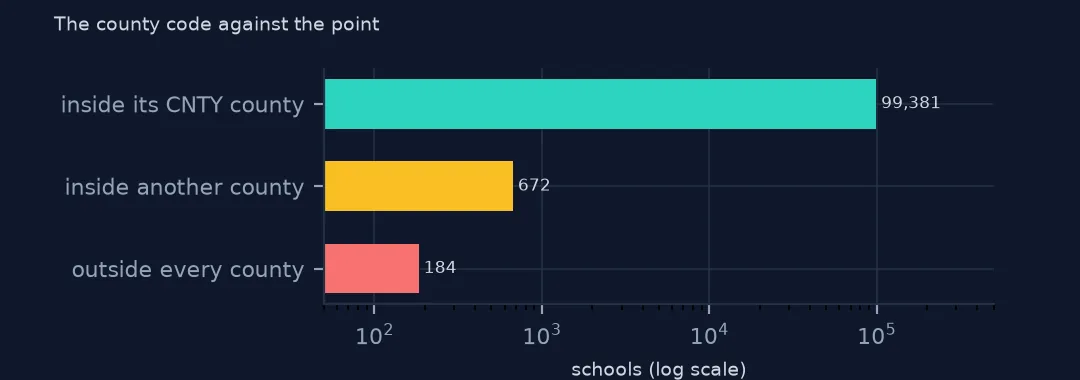
point inside its CNTY county: 99.15%; outside every county: 184; in another county: 672
99.15% of the points lie inside the county their CNTY code names. 184 lie outside every county, where the generalised 1:20 million outlines miss a strip of coast or a small island, and 672 in a neighbouring county. Those are schools near a county line, or schools whose point was placed at an address in the next county, such as a district office. Use CNTY for counts, since it is what the state reported, and the point only for maps.
2. Counties with no school
none = c[c.schools.isna()]
print(f"counties with no school record: {len(none)}")
print(none[["NAMELSAD", "STUSPS", "GEOID"]].to_string(index=False))
counties with no school record: 4
NAMELSAD STUSPS GEOID
Buffalo County SD 46017
Kalawao County HI 15005
Loving County TX 48301
Issaquena County MS 28055
Four counties have no school at all: Buffalo County in South Dakota, Kalawao County in Hawaii, the former leprosy settlement on Molokai, Loving County in Texas, the least populous county in the country, and Issaquena County in Mississippi. Their children attend schools in neighbouring counties, so a choropleth should show them as "no school", not as zero students per school.
3. Students per school
lower48 = c[~c.STUSPS.isin(["AK", "HI", "PR"])].copy()
print(lower48.median_size.describe(percentiles=[0.1, 0.5, 0.9]).round(0).to_string())
print(lower48.nsmallest(3, "median_size")[["NAMELSAD", "STUSPS", "schools", "median_size"]].to_string(index=False))
print(lower48.nlargest(3, "median_size")[["NAMELSAD", "STUSPS", "schools", "median_size"]].to_string(index=False))
print(f"schools reporting 0 students: {(sch.TOTAL == 0).sum():,}, most in {sch[sch.TOTAL == 0].LSTATE.value_counts().index[0]}")
count 3106.0
mean 336.0
std 170.0
min 3.0
10% 121.0
50% 325.0
90% 557.0
max 1144.0
NAMELSAD STUSPS schools median_size
Slope County ND 1.0 3.0
Alpine County CA 4.0 6.0
Beaverhead County MT 12.0 11.0
NAMELSAD STUSPS schools median_size
Forsyth County GA 42.0 1143.5
Gwinnett County GA 150.0 1076.5
Flagler County FL 13.0 1061.0
schools reporting 0 students: 2,674, most in IL
Measured on schools that report students, the median county's typical school has 325 students, and the middle 80% of counties run from 121 to 557. At the small end, Slope County, North Dakota, has one school of 3 students, Alpine County, California, a median of 6 and Beaverhead County, Montana, 11 across 12 schools. The largest typical schools are in the suburban counties of Atlanta, Forsyth at 1,143.5 and Gwinnett at 1,076.5, and Flagler County, Florida, at 1,061. 2,674 schools report 0 students, most of them in Illinois, which is why they are left out of the median.
Rural counties and small schools
The data used on this page
NCES's Public School Characteristics layer from the Education Demographic and Geographic Estimates (EDGE) program: the 2024-25 Common Core of Data on EDGE's school points, every record of its ArcGIS service, downloaded on 28 October 2026 and saved on this site, because the "Current" layer is replaced each school year. Public domain. Counts are headcounts reported by state education agencies; teachers are full-time equivalents. County boundaries are the Census Bureau's 2024 cartographic boundary file at 1:20 million, public domain.
from pathlib import Path
import zipfile

import geopandas as gpd
import numpy as np
import pandas as pd
import requests

Path("data").mkdir(exist_ok=True)
# NCES EDGE "Public School Characteristics" for 2024-25 (the Common Core of Data on EDGE's school points), EDGE's school
# neighborhood poverty estimates for 2021-22, and the Census Bureau's 2024 counties and states. Saved 28 October 2026:
# the "Current" layers are replaced every school year.
# Live: https://services1.arcgis.com/Ua5sjt3LWTPigjyD/arcgis/rest/services/School_Characteristics_Current/FeatureServer/1
ARCHIVE = "nces-schools-2026-10-28.zip"
if not Path(f"data/{ARCHIVE}").exists():
    Path(f"data/{ARCHIVE}").write_bytes(requests.get(f"https://data.spatialworkflow.io/{ARCHIVE}", timeout=600).content)
Z = zipfile.ZipFile(f"data/{ARCHIVE}")
sch = pd.read_csv(Z.open("school-characteristics-2024-25.csv"), dtype={"NCESSCH": str, "LEAID": str, "CNTY": str, "LZIP": str, "LSTREET2": str})
for f in ["cb_2024_us_county_20m.zip", "cb_2024_us_state_20m.zip"]:
    Path(f"data/{f}").write_bytes(Z.read(f))
print(f"NCES public schools 2024-25: {len(sch):,} records")
sch["LSTATE"] = sch.LSTATE.str.strip()                                    # stored padded to three characters
NUM = ["TOTAL", "FTE", "STUTERATIO", "TOTFRL", "FRELCH", "REDLCH", "DIRECTCERT", "AM", "AS_", "BL", "HP", "HI", "TR", "WH"]
sch[NUM] = sch[NUM].where(sch[NUM] >= 0)                                  # -1 missing, -2 not applicable, -9 below quality standards
sch = sch[sch.SY_STATUS_TEXT.isin(["Open", "New", "Reopened", "Added", "Changed Boundary/Agency"])]
print(f"operating schools: {len(sch):,}; students: {sch.TOTAL.sum():,.0f}")
NCES public schools 2024-25: 101,110 records
operating schools: 100,237; students: 49,343,524
Example 1: small schools and rural counties
sch["rural"] = sch.ULOCALE.str.startswith("4")
r = sch.groupby("CNTY").rural.mean().rename("rural_share")
lower48 = lower48.join(r, on="GEOID")
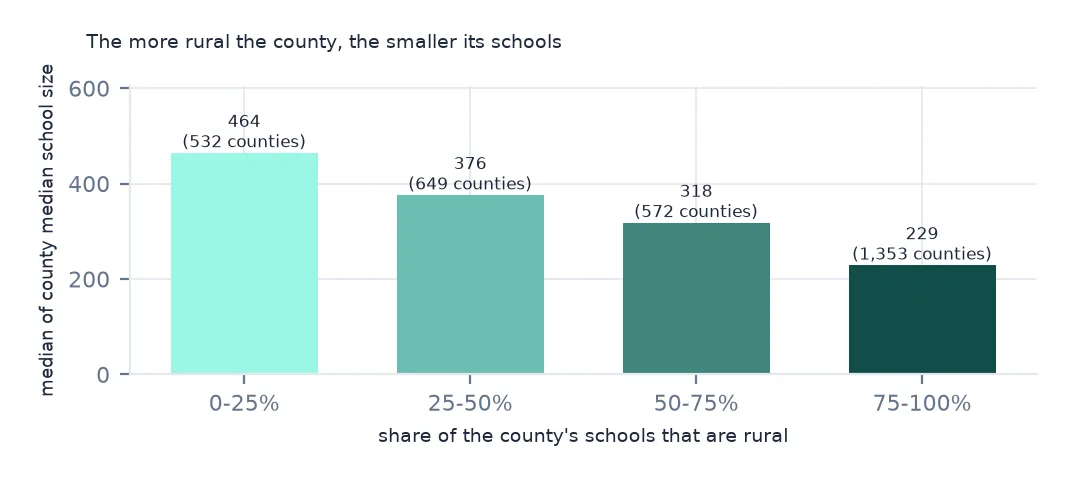
print(lower48.groupby(pd.cut(lower48.rural_share, [-0.01, 0.25, 0.5, 0.75, 1.0])).median_size.agg(["size", "median"]).round(0).to_string())
size median
rural_share
(-0.01, 0.25] 532 464.0
(0.25, 0.5] 649 376.0
(0.5, 0.75] 572 318.0
(0.75, 1.0] 1353 229.0
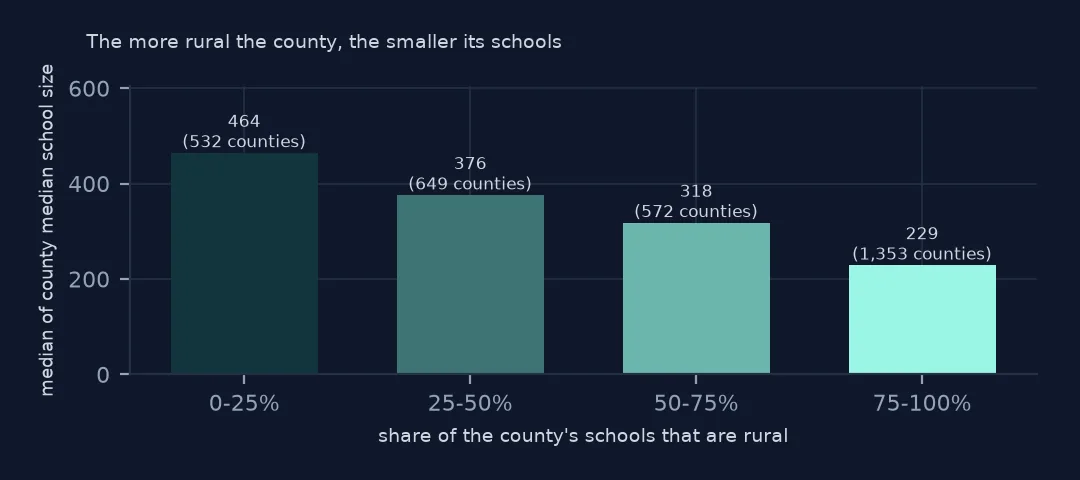
Counties where three quarters or more of schools are rural are the most common group, 1,353 of them, and their median school has 229 students. Where a quarter or fewer are rural, the median is 464. School size falls steadily with rurality: where children are spread thinly, a school of a thousand would put many of them an hour or more from home.
Internal links
- Reading the school data — the ids, statuses and points
- Locale codes explained — what rural means in this data
- Virtual schools on maps — the counties a virtual school inflates
- Student-teacher ratios — the other size measure