
How to Compare Student-Teacher Ratios Across States
On this page
Problem statement
Student-teacher ratios are quoted in every school ranking, and NCES's school file has a column for them, STUTERATIO. Averaging that column by state gives the wrong answer: a few schools with almost no recorded teachers have ratios in the thousands, a whole state reports no teachers at all, and an average of ratios weights a school of 30 the same as one of 3,000. The right state figure is total students over total full-time-equivalent teachers. This page computes it for every state, finds the records behind the extreme ratios, and compares locales and school levels.
Quick answer
Sum students and teachers by state over schools that report both, then divide:
ok = sch.TOTAL.notna() & sch.FTE.gt(0)
st = sch[ok].groupby("LSTATE")[["TOTAL", "FTE"]].sum()
st["ratio"] = st.TOTAL / st.FTE
print(st.ratio.sort_values().round(1).iloc[[0, 1, 2, -3, -2, -1]].to_string())
print(f"nation: {st.TOTAL.sum() / st.FTE.sum():.1f} students per teacher")
LSTATE
PR 9.7
VT 10.8
DC 10.9
NV 19.8
UT 21.6
CA 21.6
nation: 15.1 students per teacher
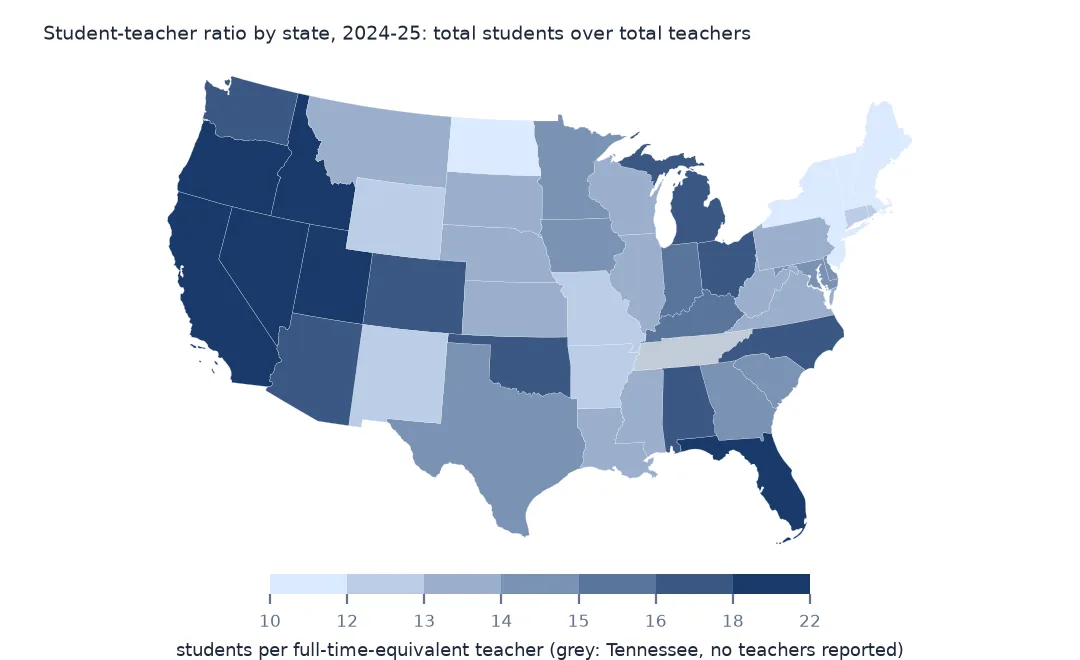
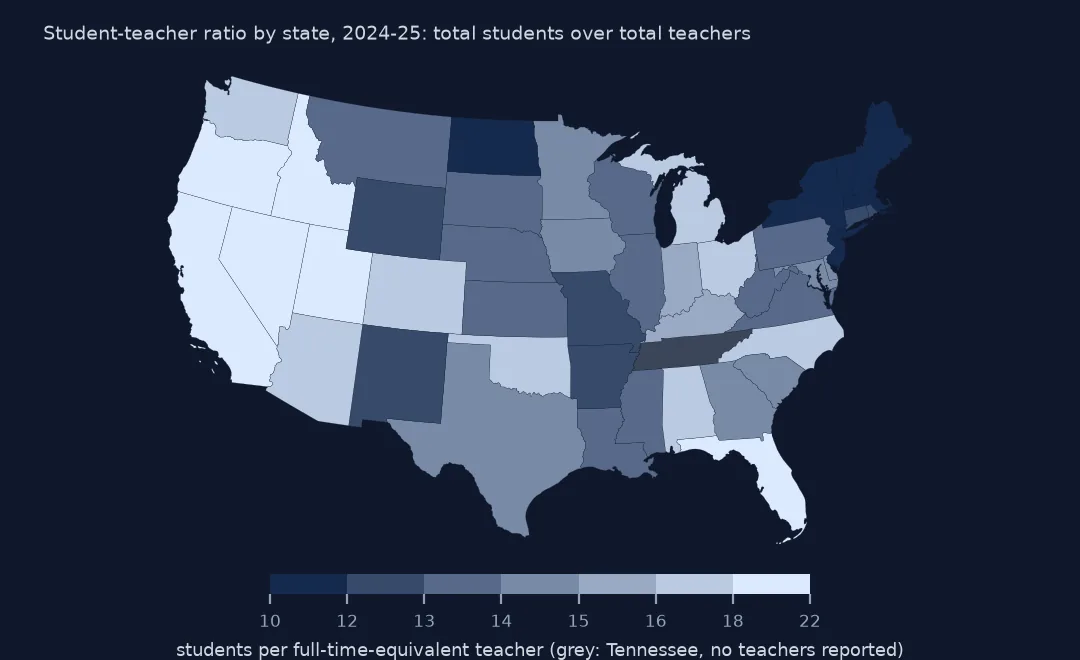
The national ratio is 15.1 students per full-time-equivalent teacher. Puerto Rico has the lowest, 9.7, then Vermont at 10.8 and DC at 10.9. Nevada, Utah and California have the highest, 19.8, 21.6 and 21.6, twice Vermont's. Tennessee is missing from the table: every one of its 1,913 schools reports teachers as -1, missing, so it has no ratio at all.
Ratios that mislead
1. The ratio column, and why not to average it
print(sch.STUTERATIO.describe(percentiles=[0.5, 0.99]).round(1).to_string())
print(f"mean of school ratios: {sch.STUTERATIO.mean():.1f}; median: {sch.STUTERATIO.median():.1f}; ratio of sums: {st.TOTAL.sum() / st.FTE.sum():.1f}")
count 93809.0
mean 16.4
std 186.4
min 0.0
50% 14.4
99% 36.9
max 56200.0
mean of school ratios: 16.4; median: 14.4; ratio of sums: 15.1
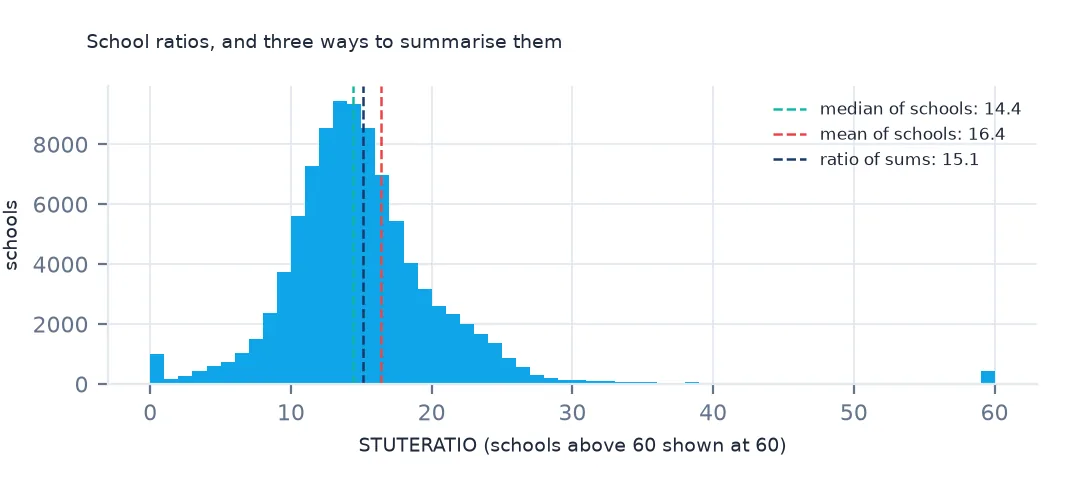
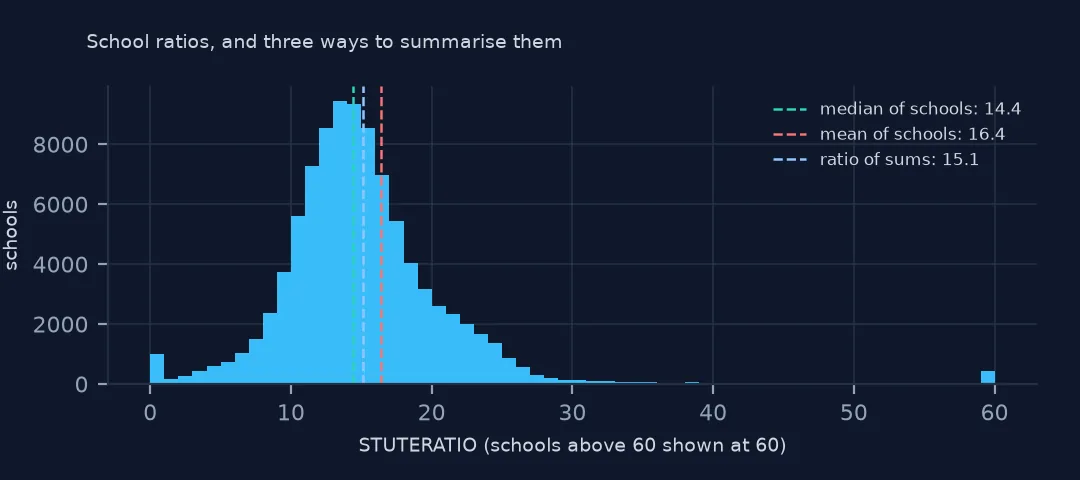
STUTERATIO exists for 93,809 schools. Its median is 14.4 and its mean 16.4, both different from the ratio of sums, 15.1, and its maximum is 56,200. The mean of school ratios is pulled up by the extremes and gives every school equal weight, while the ratio of sums weights each school by its students, which is what a state figure should do.
2. The schools behind the extremes
print(sch.nlargest(4, "STUTERATIO")[["SCH_NAME", "LSTATE", "VIRTUAL", "TOTAL", "FTE", "STUTERATIO"]].to_string(index=False))
print(f"schools with a ratio over 50: {(sch.STUTERATIO > 50).sum()}; of them full or mostly virtual: {sch[sch.STUTERATIO > 50].VIRTUAL.isin(['Full Virtual', 'Virtual with face to face options']).sum()}")
SCH_NAME LSTATE VIRTUAL TOTAL FTE STUTERATIO
Lake Country Classical Academy Inc WI Not Virtual 562.0 0.01 56200.0
AmiKiDs Caddo LA Not Virtual 60.0 0.01 6000.0
SCHUYLER HEADSTART NE Not Virtual 75.0 0.02 3750.0
Gateway to College at Springfield Technical Community Colleg MA Not Virtual 25.0 0.01 2500.0
schools with a ratio over 50: 542; of them full or mostly virtual: 144
The extremes are clerical. Lake Country Classical Academy in Wisconsin reports 562 students and 0.01 teachers, a ratio of 56,200; the others at the top have 0.01 or 0.02 FTE recorded. 542 schools have a ratio over 50, and 144 of those are fully or mostly virtual, where one teacher really may serve far more students; the rest are records like these. A state total barely notices them, an average of ratios does.
3. Schools without teachers on record
print(f"no FTE number: {sch.FTE.isna().sum():,}; FTE of 0: {(sch.FTE == 0).sum():,}; their students: {sch.loc[sch.FTE.isna() | (sch.FTE == 0), 'TOTAL'].sum():,.0f}")
print(sch[sch.FTE.isna()].LSTATE.value_counts().head(4).to_string())
no FTE number: 4,063; FTE of 0: 1,895; their students: 1,337,598
LSTATE
TN 1913
AZ 453
CA 347
MN 285
4,063 operating schools have no teacher number and 1,895 report zero teachers; together they hold 1,337,598 students who drop out of the ratio. Tennessee's 1,913 schools are almost half of the missing records, followed by Arizona, California and Minnesota. Leaving them out keeps the ratio honest for the schools that report, but a state with many missing schools is being described by a subset.
Locales and levels
The data used on this page
NCES's Public School Characteristics layer from the Education Demographic and Geographic Estimates (EDGE) program: the 2024-25 Common Core of Data on EDGE's school points, every record of its ArcGIS service, downloaded on 28 October 2026 and saved on this site, because the "Current" layer is replaced each school year. Public domain. Counts are headcounts reported by state education agencies; teachers are full-time equivalents.
from pathlib import Path
import zipfile

import geopandas as gpd
import numpy as np
import pandas as pd
import requests

Path("data").mkdir(exist_ok=True)
# NCES EDGE "Public School Characteristics" for 2024-25 (the Common Core of Data on EDGE's school points), EDGE's school
# neighborhood poverty estimates for 2021-22, and the Census Bureau's 2024 counties and states. Saved 28 October 2026:
# the "Current" layers are replaced every school year.
# Live: https://services1.arcgis.com/Ua5sjt3LWTPigjyD/arcgis/rest/services/School_Characteristics_Current/FeatureServer/1
ARCHIVE = "nces-schools-2026-10-28.zip"
if not Path(f"data/{ARCHIVE}").exists():
    Path(f"data/{ARCHIVE}").write_bytes(requests.get(f"https://data.spatialworkflow.io/{ARCHIVE}", timeout=600).content)
Z = zipfile.ZipFile(f"data/{ARCHIVE}")
sch = pd.read_csv(Z.open("school-characteristics-2024-25.csv"), dtype={"NCESSCH": str, "LEAID": str, "CNTY": str, "LZIP": str, "LSTREET2": str})
for f in ["cb_2024_us_county_20m.zip", "cb_2024_us_state_20m.zip"]:
    Path(f"data/{f}").write_bytes(Z.read(f))
print(f"NCES public schools 2024-25: {len(sch):,} records")
sch["LSTATE"] = sch.LSTATE.str.strip()                                    # stored padded to three characters
NUM = ["TOTAL", "FTE", "STUTERATIO", "TOTFRL", "FRELCH", "REDLCH", "DIRECTCERT", "AM", "AS_", "BL", "HP", "HI", "TR", "WH"]
sch[NUM] = sch[NUM].where(sch[NUM] >= 0)                                  # -1 missing, -2 not applicable, -9 below quality standards
sch = sch[sch.SY_STATUS_TEXT.isin(["Open", "New", "Reopened", "Added", "Changed Boundary/Agency"])]
print(f"operating schools: {len(sch):,}; students: {sch.TOTAL.sum():,.0f}")
NCES public schools 2024-25: 101,110 records
operating schools: 100,237; students: 49,343,524
Example 1: by locale
loc = sch[ok].assign(locale=sch.ULOCALE.str[3:].str.split(":").str[0]).groupby("locale")[["TOTAL", "FTE"]].sum()
print((loc.TOTAL / loc.FTE).round(1).to_string())
locale
City 15.6
Rural 14.1
Suburb 15.4
Town 14.9
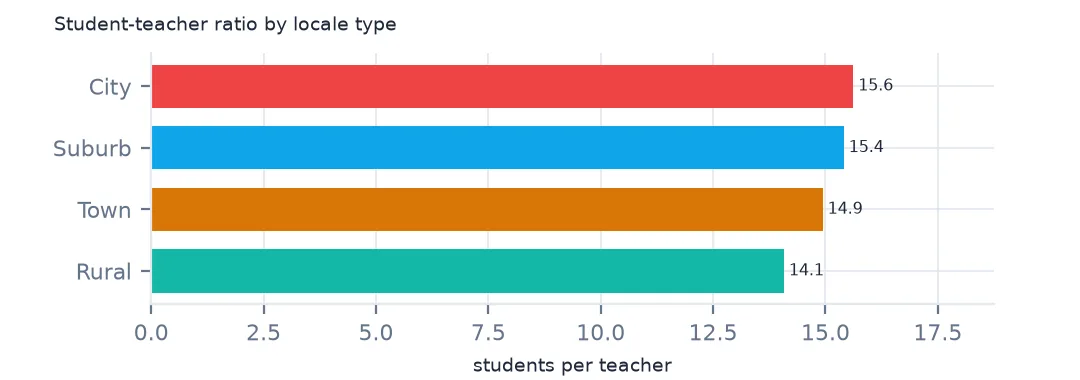
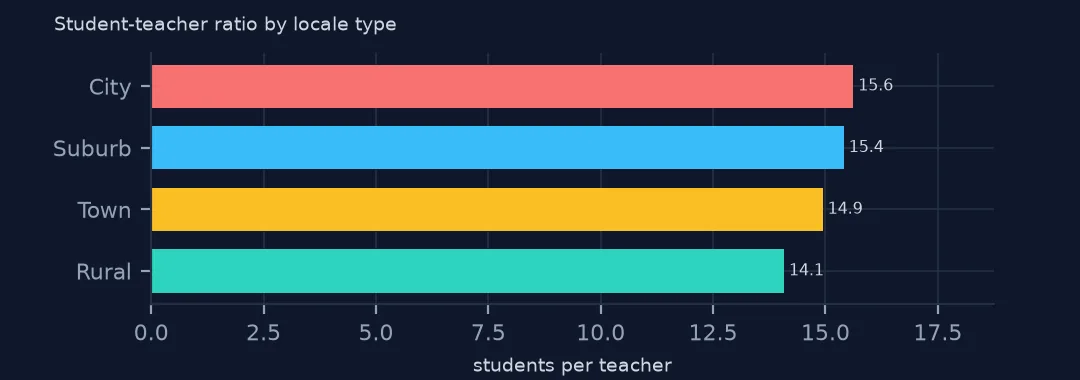
City schools have the most students per teacher, 15.6, and rural schools the fewest, 14.1, with suburbs at 15.4 and towns at 14.9. The difference is about one and a half students per teacher, small next to the gap between states: where a school is matters less than which state runs it.
Example 2: by school level
lv = sch[ok & sch.SCHOOL_LEVEL.isin(["Elementary", "Middle", "High"])].groupby("SCHOOL_LEVEL")[["TOTAL", "FTE"]].sum()
print((lv.TOTAL / lv.FTE).round(1).to_string())
SCHOOL_LEVEL
Elementary 14.9
High 15.7
Middle 14.9
By level the ratios are close: 14.9 in elementary and middle schools, 15.7 in high schools. The full-time-equivalent count includes specialists who teach small groups, so these are not class sizes, which are larger.
Internal links
- Codes of -1, -2 and -9 — why Tennessee's teachers are missing
- Virtual schools on maps — the schools with thousands of students per teacher
- Reading the school data — the columns
- Locale codes explained — city, suburb, town and rural