
Fixing NCES School Counts of -1, -2 and -9
On this page
Problem statement
NCES's school files never leave a count blank. Where there is no number they write -1 (missing), -2 (not applicable) or -9 (the value did not meet NCES's data quality standards), and in text columns the letters M and N. Read into pandas, those are ordinary numbers. They make a sum slightly too small, an average noticeably wrong and a ratio negative or infinite, and nothing raises an error. This page counts the codes in the 2024-25 school file, shows how far they move common statistics, and replaces them before any arithmetic.
Quick answer
Count the codes per column, then compare a sum with and without them:
NUM = ["TOTAL", "FTE", "STUTERATIO", "TOTFRL", "FRELCH", "REDLCH", "DIRECTCERT"]
neg = sch[NUM].lt(0)
print(neg.sum().to_string())
print(f"sum of TOTAL as read: {sch.TOTAL.sum():,}; after setting codes to NaN: {sch.TOTAL.where(sch.TOTAL >= 0).sum():,.0f}")
TOTAL 1865
FTE 4936
STUTERATIO 7301
TOTFRL 20697
FRELCH 26049
REDLCH 26049
DIRECTCERT 51066
sum of TOTAL as read: 49,339,565; after setting codes to NaN: 49,343,524
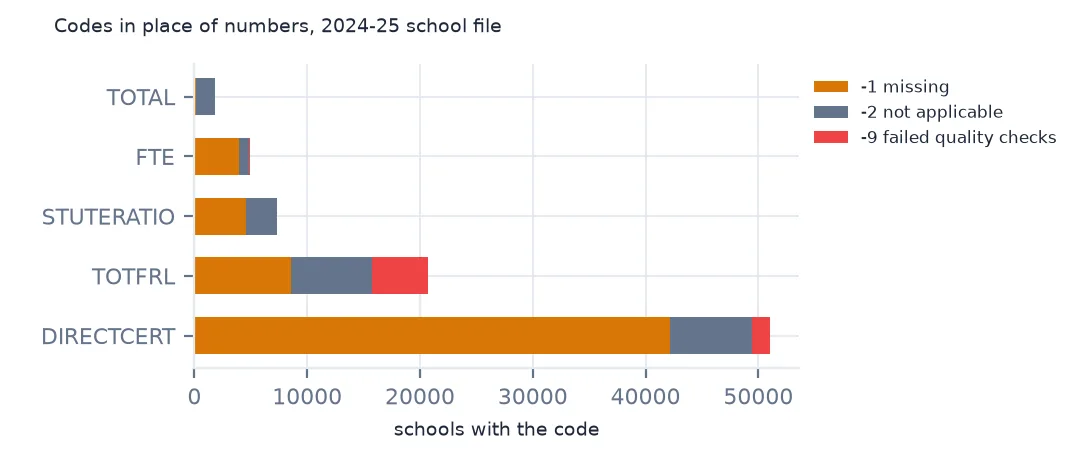
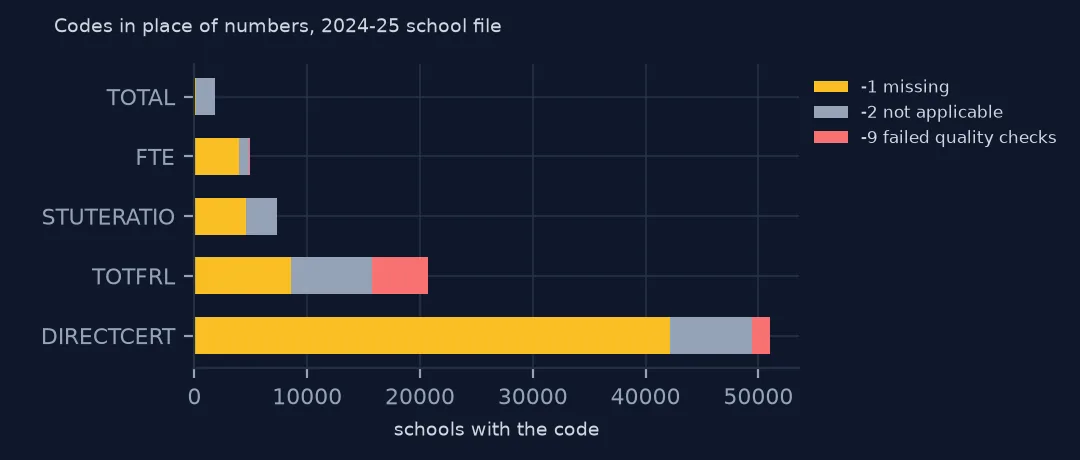
Every count column has codes. Enrolment has 1,865, teachers 4,936, the student-teacher ratio 7,301, the free and reduced-price lunch total 20,697 and direct certification 51,066, half of all records. The national enrolment sum moves only from 49,339,565 to 49,343,524 when the codes go, because they are small numbers. The sum is the statistic that suffers least.
What the codes are and what they do
1. What each code means
for c in ["TOTAL", "TOTFRL", "DIRECTCERT"]:
    print(c, sch[c].where(sch[c] < 0).value_counts().sort_index().to_dict())
print(sch.loc[sch.TOTAL == -2, "SY_STATUS_TEXT"].value_counts().head(3).to_dict(), sch.loc[sch.TOTAL == -2, "SCHOOL_LEVEL"].value_counts().head(3).to_dict())
TOTAL {-9.0: 54, -2.0: 1662, -1.0: 149}
TOTFRL {-9.0: 4953, -2.0: 7212, -1.0: 8532}
DIRECTCERT {-9.0: 1662, -2.0: 7212, -1.0: 42192}
{'Open': 779, 'Inactive': 501, 'Future': 372} {'Not Reported': 1240, 'Not Applicable': 280, 'High': 107}
In enrolment, -2 is by far the most common code, and it marks schools that cannot have students yet or any more: 501 inactive and 372 future schools, and 779 open ones, most with a level of "Not Reported" or "Not Applicable", which are programmes rather than schools. -1 is a number the state should have sent and didn't. -9 is a number NCES received and rejected. For direct certification, 42,192 schools have -1 because their state does not report it at all.
2. How far the codes move a statistic
raw = sch[sch.SY_STATUS_TEXT == "Open"]
fixed = raw[NUM].where(raw[NUM] >= 0)
for c in ["TOTAL", "FTE", "TOTFRL"]:
    print(f"{c}: mean as read {raw[c].mean():.1f}, mean without codes {fixed[c].mean():.1f}; zero-or-less as read {(raw[c] <= 0).mean():.1%}")
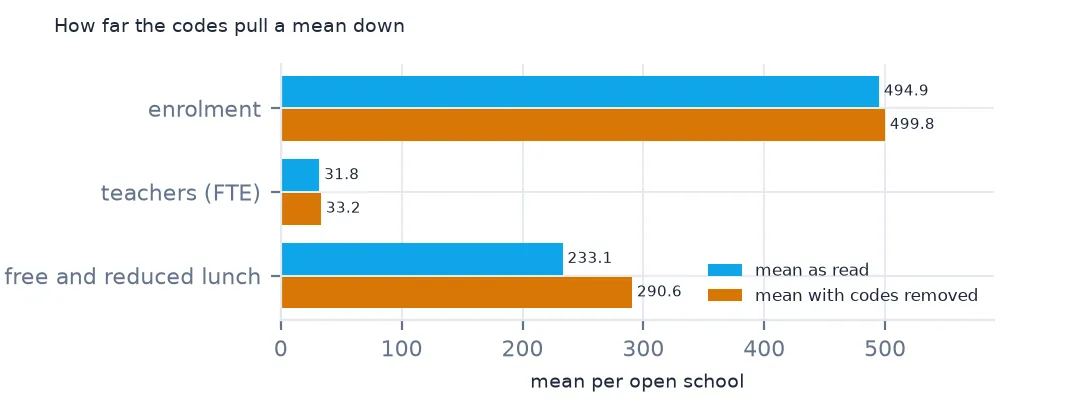
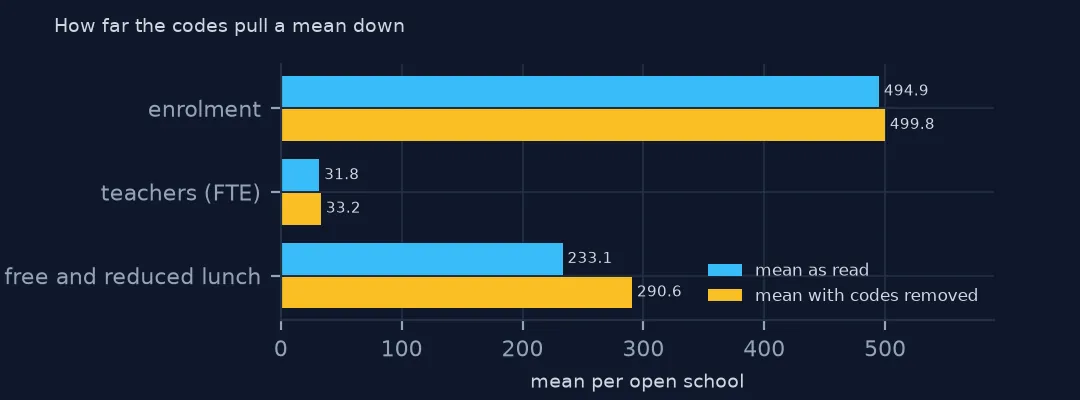
TOTAL: mean as read 494.9, mean without codes 499.8; zero-or-less as read 3.5%
FTE: mean as read 31.8, mean without codes 33.2; zero-or-less as read 5.7%
TOTFRL: mean as read 233.1, mean without codes 290.6; zero-or-less as read 19.6%
Among open schools, the codes pull the mean enrolment from 499.8 down to 494.9 and the mean free and reduced-price lunch count from 290.6 down to 233.1, a fifth too low. 19.6% of open schools have a lunch count of zero or less as read. Any filter of the form > 0 or <= 0 treats a code as a real value.
3. The letters in the text columns
for c in ["CHARTER_TEXT", "VIRTUAL"]:
    print(c, sch[c].value_counts().to_dict())
CHARTER_TEXT {'No': 89169, 'Yes': 8234, 'N': 3707}
VIRTUAL {'Not Virtual': 71039, 'Supplemental Virtual': 17235, 'M': 10222, 'Full Virtual': 1223, 'N': 873, 'Virtual with face to face options': 518}
Text columns use letters for the same thing. In CHARTER_TEXT, N is not applicable, for schools in states with no charter schools. In VIRTUAL, M is missing, for 10,222 schools, and N not applicable. These need mapping to a real category or to missing, depending on the question, and must never be read as "No".
A ratio that goes wrong quietly
The data used on this page
NCES's Public School Characteristics layer from the Education Demographic and Geographic Estimates (EDGE) program: the 2024-25 Common Core of Data on EDGE's school points, every record of its ArcGIS service, downloaded on 28 October 2026 and saved on this site, because the "Current" layer is replaced each school year. Public domain. Counts are headcounts reported by state education agencies; teachers are full-time equivalents.
from pathlib import Path
import zipfile

import geopandas as gpd
import numpy as np
import pandas as pd
import requests

Path("data").mkdir(exist_ok=True)
# NCES EDGE "Public School Characteristics" for 2024-25 (the Common Core of Data on EDGE's school points), EDGE's school
# neighborhood poverty estimates for 2021-22, and the Census Bureau's 2024 counties and states. Saved 28 October 2026:
# the "Current" layers are replaced every school year.
# Live: https://services1.arcgis.com/Ua5sjt3LWTPigjyD/arcgis/rest/services/School_Characteristics_Current/FeatureServer/1
ARCHIVE = "nces-schools-2026-10-28.zip"
if not Path(f"data/{ARCHIVE}").exists():
    Path(f"data/{ARCHIVE}").write_bytes(requests.get(f"https://data.spatialworkflow.io/{ARCHIVE}", timeout=600).content)
Z = zipfile.ZipFile(f"data/{ARCHIVE}")
sch = pd.read_csv(Z.open("school-characteristics-2024-25.csv"), dtype={"NCESSCH": str, "LEAID": str, "CNTY": str, "LZIP": str, "LSTREET2": str})
for f in ["cb_2024_us_county_20m.zip", "cb_2024_us_state_20m.zip"]:
    Path(f"data/{f}").write_bytes(Z.read(f))
print(f"NCES public schools 2024-25: {len(sch):,} records")
NCES public schools 2024-25: 101,110 records
Example 1: a share that silently goes wrong
bad = (raw.TOTFRL / raw.TOTAL)
good = (fixed.TOTFRL / fixed.TOTAL)
print(f"FRL share, codes kept: median {bad.median():.3f}, negative values {(bad < 0).sum():,}, infinite {np.isinf(bad).sum()}")
print(f"FRL share, codes removed: median {good.median():.3f}, schools with a value {good.notna().sum():,}")
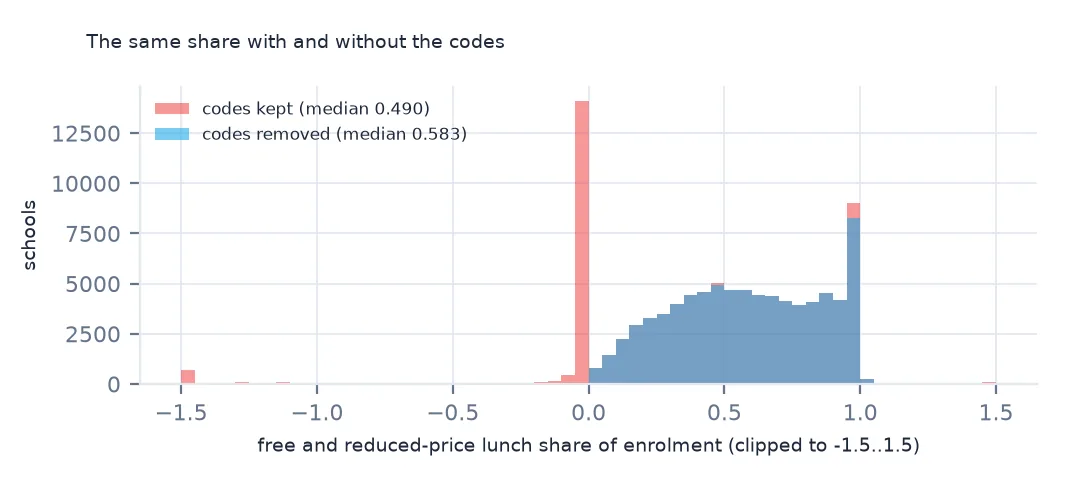
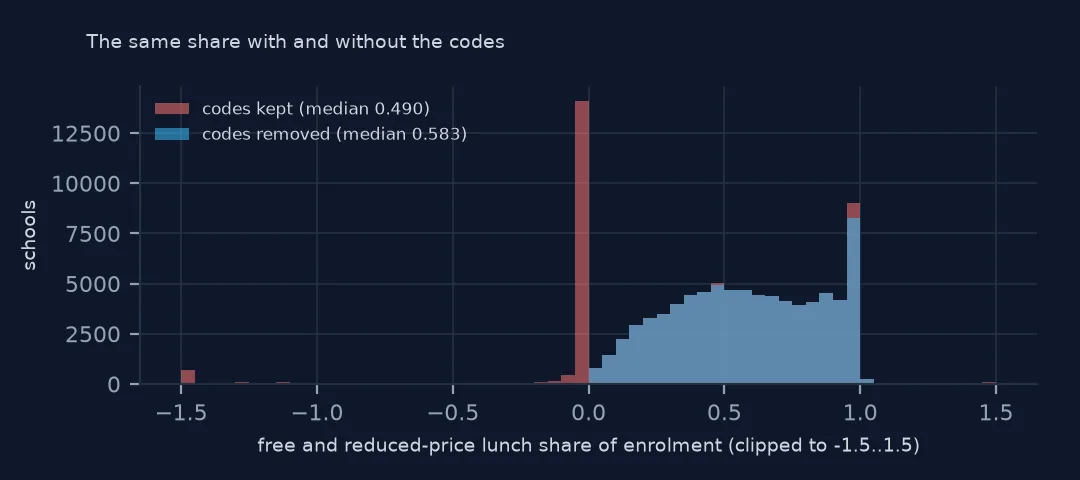
FRL share, codes kept: median 0.490, negative values 18,544, infinite 2525
FRL share, codes removed: median 0.583, schools with a value 79,793
The free-lunch share with the codes left in has a median of 0.490, 18,544 negative values and 2,525 infinite ones, from codes in the denominator. With the codes removed, the median is 0.583 and 79,793 schools have a value. The broken version is not obviously broken: its median looks plausible. Replace the codes with NaN in the setup of every analysis, as the other school pages do with sch[NUM].where(sch[NUM] >= 0).
Internal links
- Reading the school data — the setup this fix belongs in
- Free and reduced-price lunch — the column with the most codes
- Student-teacher ratios — a ratio that needs the fix
- Census API sentinel values — the same problem in Census Bureau tables