
How to Map Free and Reduced-Price Lunch Eligibility by School
On this page
Problem statement
The share of students eligible for free or reduced-price lunch is the most used measure of poverty in American school data, because it exists for nearly every school and no income survey reaches that far down. In NCES's school file it is TOTFRL, with FRELCH and REDLCH for the two parts. But the count is missing for whole states, can exceed the school's enrolment, and in many places is no longer collected the way its name suggests. This page computes the share for each school, shows which states are missing and why, compares it with direct certification, and maps it by county where it exists.
Quick answer
Divide the eligible count by enrolment for schools with students, after removing the negative codes:
sch["frl_share"] = sch.TOTFRL / sch.TOTAL
r = sch[sch.TOTAL > 0]
print(f"schools with an FRL count: {r.TOTFRL.notna().sum():,} of {len(r):,}; students eligible: {r.TOTFRL.sum() / r.loc[r.TOTFRL.notna(), 'TOTAL'].sum():.1%}")
print(r.frl_share.describe(percentiles=[0.1, 0.5, 0.9]).round(3).to_string())
schools with an FRL count: 80,354 of 96,571; students eligible: 56.0%
count 80354.000
mean 0.584
std 0.273
min 0.001
10% 0.209
50% 0.583
90% 0.958
max 13.289
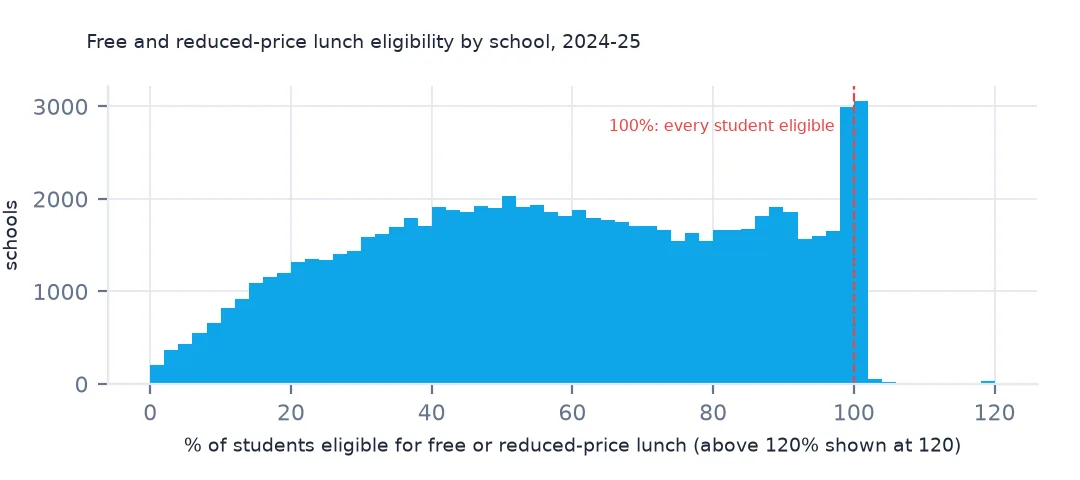
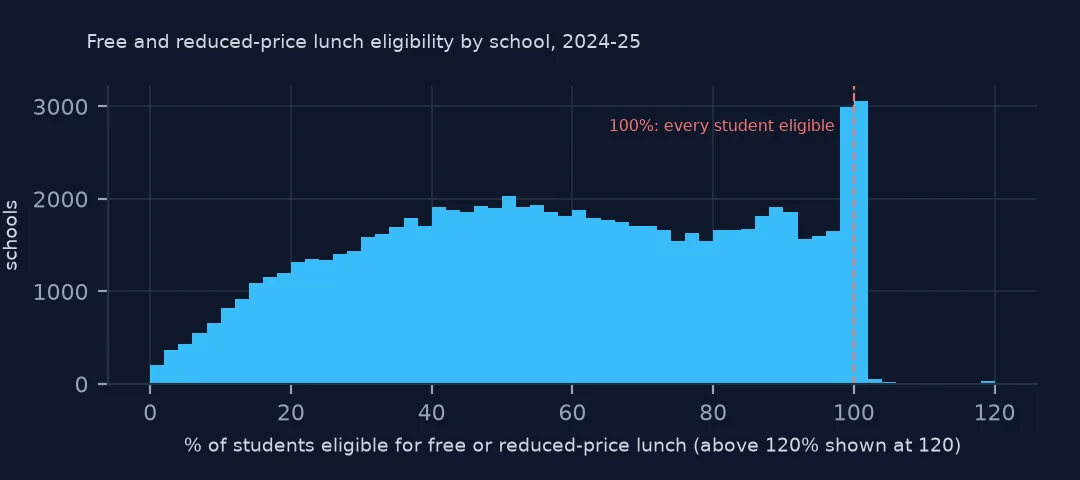
80,354 of the 96,571 operating schools with students have an eligibility count, and in them 56.0% of students are eligible. The median school's share is 58.3%; a tenth of schools are below 20.9% and a tenth above 95.8%. The maximum, 13.3 times the enrolment, is an error, but shares at or near 100% are common and many of them are real.
Missing states, odd values and the alternative
1. Where the count is missing
miss = r.groupby("LSTATE").TOTFRL.apply(lambda s: s.isna().mean())
print(miss[miss > 0.5].round(2).sort_values(ascending=False).to_string())
LSTATE
DC 1.00
DE 1.00
TN 1.00
GU 1.00
MA 1.00
PA 1.00
WV 1.00
SC 1.00
AZ 0.98
OH 0.56
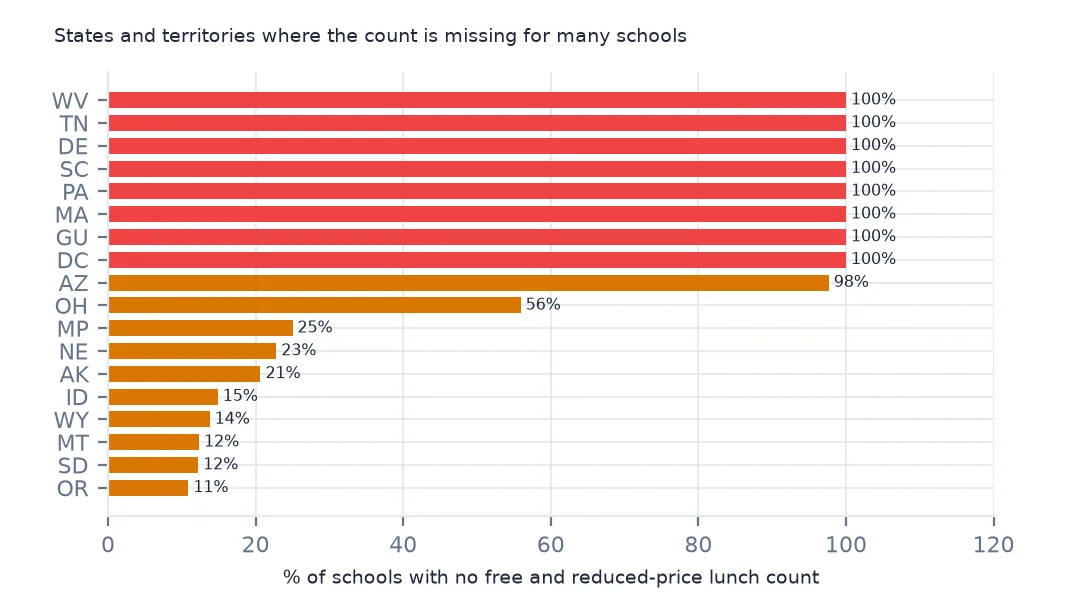
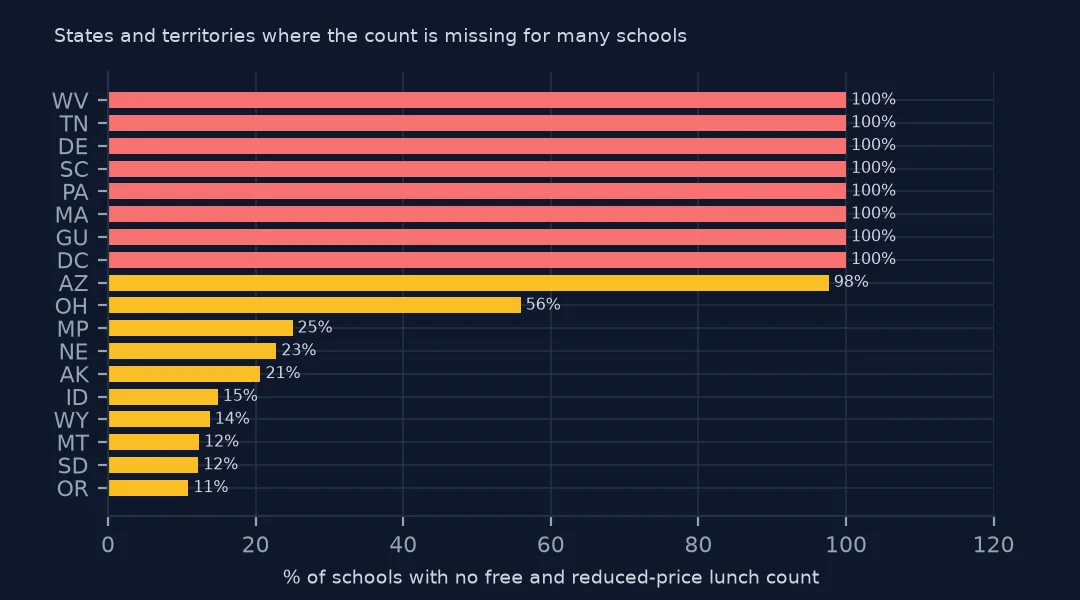
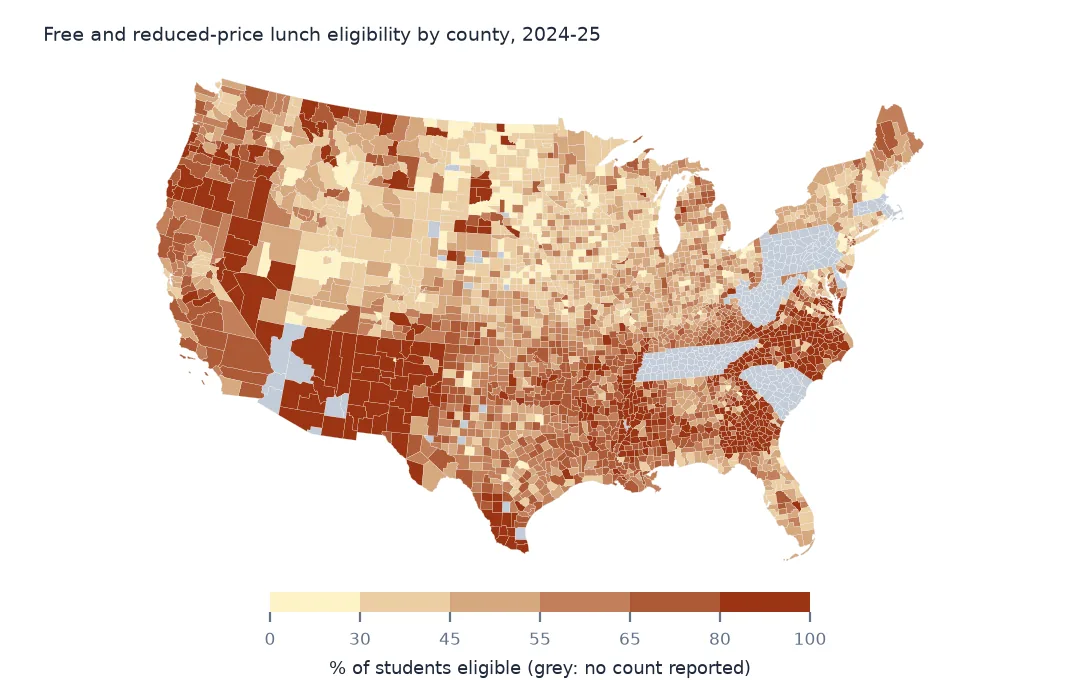
Eight states and territories report no count for any school, including Pennsylvania, Massachusetts, Tennessee, South Carolina, West Virginia and DC, Arizona reports almost none and Ohio lacks it for 56% of its schools. These are not small places: Pennsylvania and Massachusetts alone enrol millions of students. A national map or average that drops missing values silently describes the other states only.
2. Free, reduced and over 100%
print(f"free: {r.FRELCH.sum():,.0f}; reduced: {r.REDLCH.sum():,.0f}; total: {r.TOTFRL.sum():,.0f}")
over = r[r.frl_share > 1]
print(f"schools with more eligible than enrolled: {len(over)}; share at exactly 100%: {(r.frl_share == 1).mean():.1%}")
free: 19,962,357; reduced: 1,993,971; total: 23,277,782
schools with more eligible than enrolled: 344; share at exactly 100%: 3.0%
Free eligibility is 19,962,357 students and reduced-price 1,993,971, but the total is 23,277,782, more than the two parts, because some states report only the total. 344 schools report more eligible students than they enrol, and 3.0% of schools report exactly 100%. Many of those are high-poverty schools in the Community Eligibility Provision, which serve free meals to every student and may count all of them as eligible; the 100% is a policy, not a measurement.
3. Direct certification instead
dc = r[r.TOTFRL.isna() & r.DIRECTCERT.notna()]
print(f"schools with direct certification but no FRL count: {len(dc):,} in {dc.LSTATE.nunique()} states")
both = r[r.TOTFRL.notna() & r.DIRECTCERT.notna()]
print(f"where both exist (n={len(both):,}): direct certification is {both.DIRECTCERT.sum() / both.TOTFRL.sum():.1%} of the FRL count")
schools with direct certification but no FRL count: 8,279 in 24 states
where both exist (n=41,732): direct certification is 65.7% of the FRL count
8,279 schools in 24 states report direct certification, the count of students enrolled in programmes such as SNAP, without an eligibility count. Where a school reports both, direct certification is 65.7% of the free and reduced-price count, so the two cannot be mixed on one scale. A comparison across all states needs one measure for all of them, such as the neighbourhood poverty estimates.
A county map
The data used on this page
NCES's Public School Characteristics layer from the Education Demographic and Geographic Estimates (EDGE) program: the 2024-25 Common Core of Data on EDGE's school points, every record of its ArcGIS service, downloaded on 28 October 2026 and saved on this site, because the "Current" layer is replaced each school year. Public domain. Counts are headcounts reported by state education agencies; teachers are full-time equivalents. County boundaries are the Census Bureau's 2024 cartographic boundary file, public domain.
from pathlib import Path
import zipfile

import geopandas as gpd
import numpy as np
import pandas as pd
import requests

Path("data").mkdir(exist_ok=True)
# NCES EDGE "Public School Characteristics" for 2024-25 (the Common Core of Data on EDGE's school points), EDGE's school
# neighborhood poverty estimates for 2021-22, and the Census Bureau's 2024 counties and states. Saved 28 October 2026:
# the "Current" layers are replaced every school year.
# Live: https://services1.arcgis.com/Ua5sjt3LWTPigjyD/arcgis/rest/services/School_Characteristics_Current/FeatureServer/1
ARCHIVE = "nces-schools-2026-10-28.zip"
if not Path(f"data/{ARCHIVE}").exists():
    Path(f"data/{ARCHIVE}").write_bytes(requests.get(f"https://data.spatialworkflow.io/{ARCHIVE}", timeout=600).content)
Z = zipfile.ZipFile(f"data/{ARCHIVE}")
sch = pd.read_csv(Z.open("school-characteristics-2024-25.csv"), dtype={"NCESSCH": str, "LEAID": str, "CNTY": str, "LZIP": str, "LSTREET2": str})
for f in ["cb_2024_us_county_20m.zip", "cb_2024_us_state_20m.zip"]:
    Path(f"data/{f}").write_bytes(Z.read(f))
print(f"NCES public schools 2024-25: {len(sch):,} records")
sch["LSTATE"] = sch.LSTATE.str.strip()                                    # stored padded to three characters
NUM = ["TOTAL", "FTE", "STUTERATIO", "TOTFRL", "FRELCH", "REDLCH", "DIRECTCERT", "AM", "AS_", "BL", "HP", "HI", "TR", "WH"]
sch[NUM] = sch[NUM].where(sch[NUM] >= 0)                                  # -1 missing, -2 not applicable, -9 below quality standards
sch = sch[sch.SY_STATUS_TEXT.isin(["Open", "New", "Reopened", "Added", "Changed Boundary/Agency"])]
print(f"operating schools: {len(sch):,}; students: {sch.TOTAL.sum():,.0f}")
NCES public schools 2024-25: 101,110 records
operating schools: 100,237; students: 49,343,524
Example 1: a county map from the states that report
counties = gpd.read_file("data/cb_2024_us_county_20m.zip")
cf = r[r.TOTFRL.notna()].groupby("CNTY")[["TOTFRL", "TOTAL"]].sum()
cf["share"] = cf.TOTFRL / cf.TOTAL
c = counties.merge(cf, left_on="GEOID", right_index=True, how="left")
print(f"counties with a share: {c.share.notna().sum():,}; without (states that do not report): {c.share.isna().sum():,}")
print(c.share.describe(percentiles=[0.1, 0.5, 0.9]).round(3).to_string())
counties with a share: 2,900; without (states that do not report): 322
count 2900.000
mean 0.594
std 0.219
min 0.040
10% 0.339
50% 0.562
90% 0.925
max 3.880
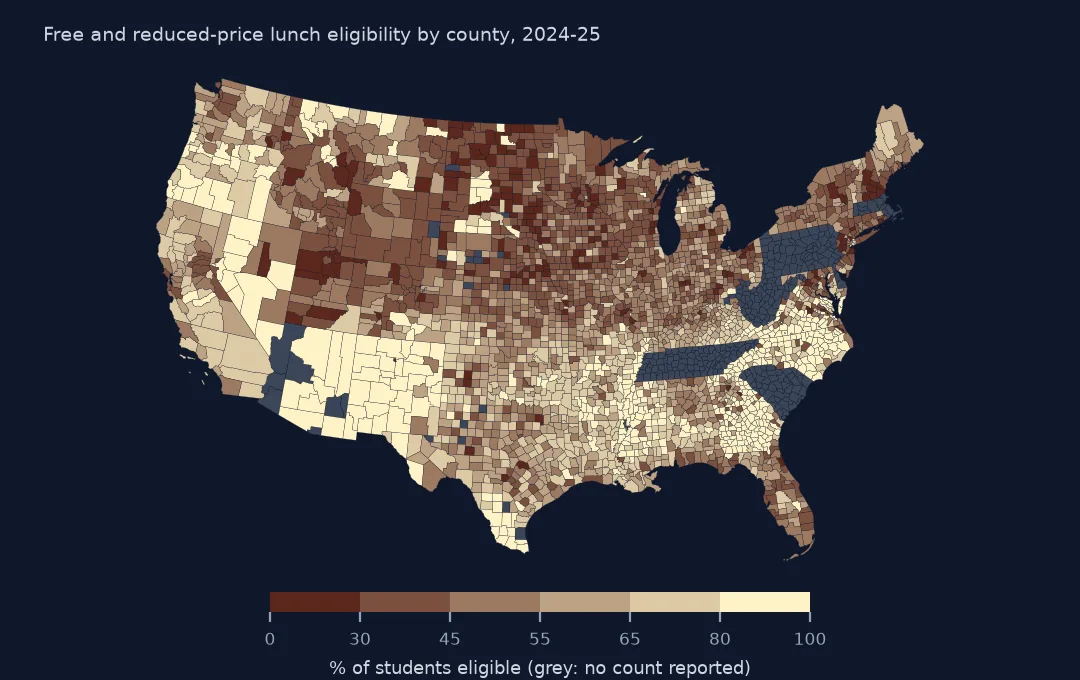
Summed by county, 2,900 counties get an eligibility share and 322 have none, most of them in the states that do not report. The median county share is 56.2%, and the middle 80% of counties run from 33.9% to 92.5%. The maximum, 3.88, comes from schools whose counts exceed enrolment; cap the share at 1 before mapping, and grey out the missing states rather than letting them blend into the lowest class.
Internal links
- School neighbourhood poverty — an income-based measure for every school
- The Common Core of Data explained — which states report what, and getting the data without code
- Codes of -1, -2 and -9 — the codes removed here
- Schools by county — the county join