
How to Rank the Deadliest Tsunamis
On this page
Problem statement
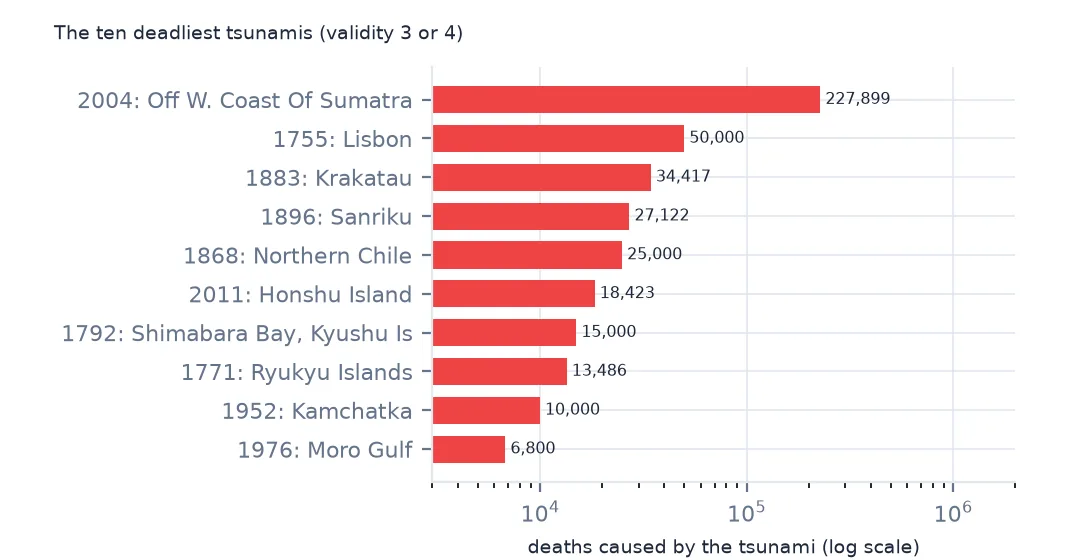
The Indian Ocean tsunami of 26 December 2004 killed more people than any other in the record, and a few others, from Lisbon in 1755 to Japan in 2011, are famous for their tolls. Ranking them from NOAA's database takes three decisions. Use the tsunami's own deaths, not the event total, which includes deaths from the earthquake or eruption. Keep only events that certainly happened. Fill in the old events that record only a rough size of the toll, a code from 1 to 4. This page ranks the deadliest tsunamis and counts how many people tsunamis have killed by century.
Quick answer
Rank by deaths among events of validity 3 or 4:
sure = ev[ev.eventValidity >= 3]
top = sure.nlargest(10, "deaths")[["year", "locationName", "country", "causeCode", "eqMagnitude", "deaths"]]
print(top.to_string(index=False))
year locationName country causeCode eqMagnitude deaths
2004 OFF W. COAST OF SUMATRA INDONESIA 1.0 9.1 227899.0
1755 LISBON PORTUGAL 1.0 8.5 50000.0
1883 KRAKATAU INDONESIA 6.0 NaN 34417.0
1896 SANRIKU JAPAN 1.0 8.3 27122.0
1868 NORTHERN CHILE CHILE 1.0 8.5 25000.0
2011 HONSHU ISLAND JAPAN 1.0 9.1 18423.0
1792 SHIMABARA BAY, KYUSHU ISLAND JAPAN 5.0 6.4 15000.0
1771 RYUKYU ISLANDS JAPAN 1.0 7.4 13486.0
1952 KAMCHATKA RUSSIA 1.0 9.0 10000.0
1976 MORO GULF PHILIPPINES 1.0 8.0 6800.0
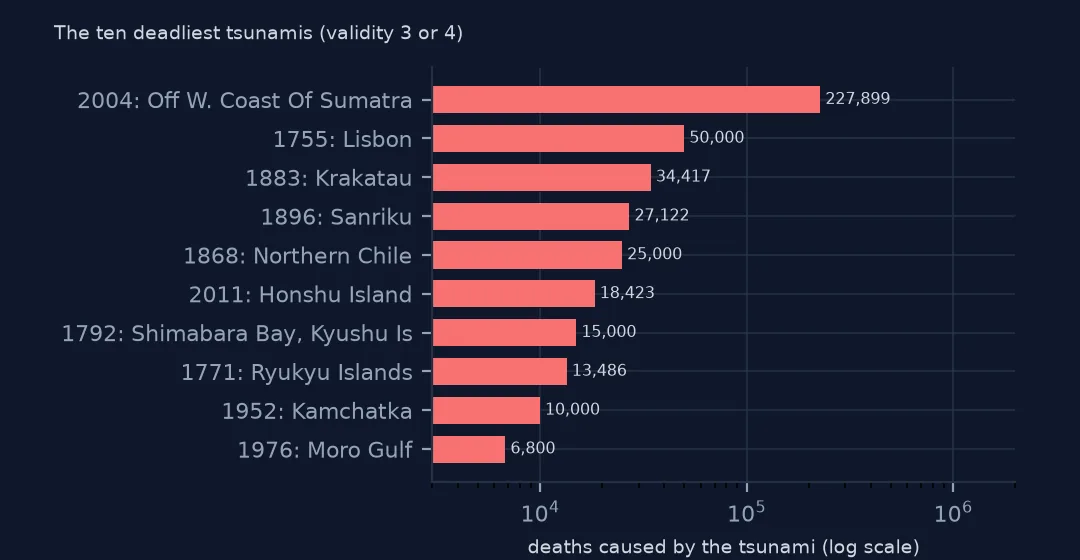
The Indian Ocean tsunami of 2004 killed 227,899 people, more than four times the next. Lisbon's 1755 tsunami killed 50,000, and the Krakatau eruption of 1883 34,417. Japan has four of the ten: Sanriku 1896, Tōhoku 2011, the Ryukyu Islands 1771, and Shimabara 1792, when an earthquake brought down a mountain beside Unzen volcano into the sea. All but two were raised by earthquakes of magnitude 7.4 or more.
What goes into a death toll
1. Deaths are known for few events
print(f"events with a death count: {sure.deaths.notna().sum()} of {len(sure):,}; with only a size code: {(sure.deaths.isna() & sure.deathsAmountOrder.notna()).sum()}")events with a death count: 244 of 1,699; with only a size code: 73
Only 244 of the 1,699 probable or definite tsunamis have a death count, and 73 more have only a size code, from "a few" to "over 1,000". The rest record no deaths, either because there were none or because nobody counted. Any total is a minimum, especially before 1900.
2. The 2004 toll by country
s04 = ev[(ev.year == 2004) & (ev.month == 12) & (ev.day == 26)].iloc[0]
print(ru[ru.tsunamiEventId == s04.id].groupby("country").deaths.sum().nlargest(6).to_string())
country
INDONESIA 167540.0
SRI LANKA 35322.0
INDIA 26047.0
THAILAND 8212.0
SOMALIA 572.0
MYANMAR (BURMA) 150.0
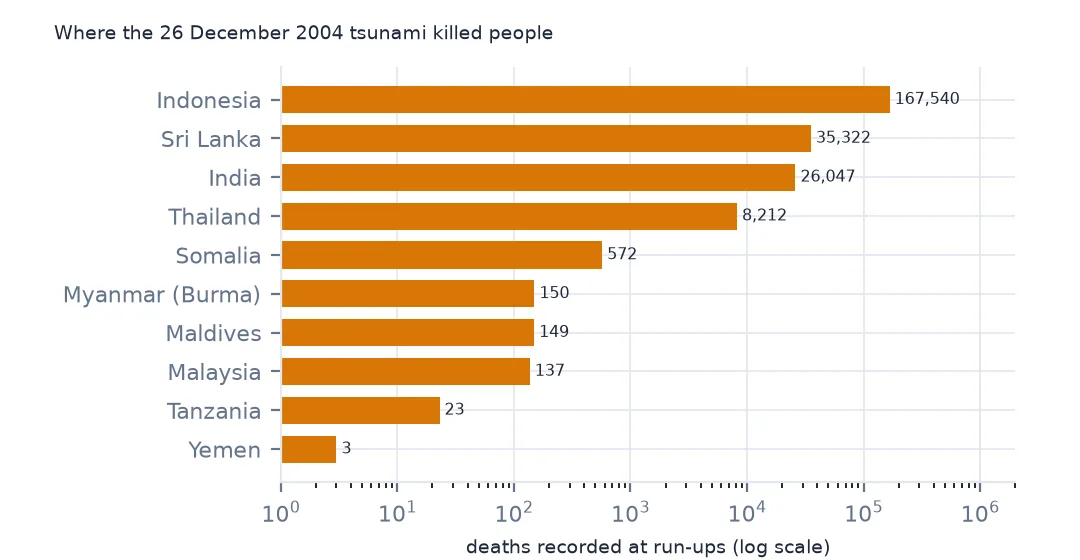
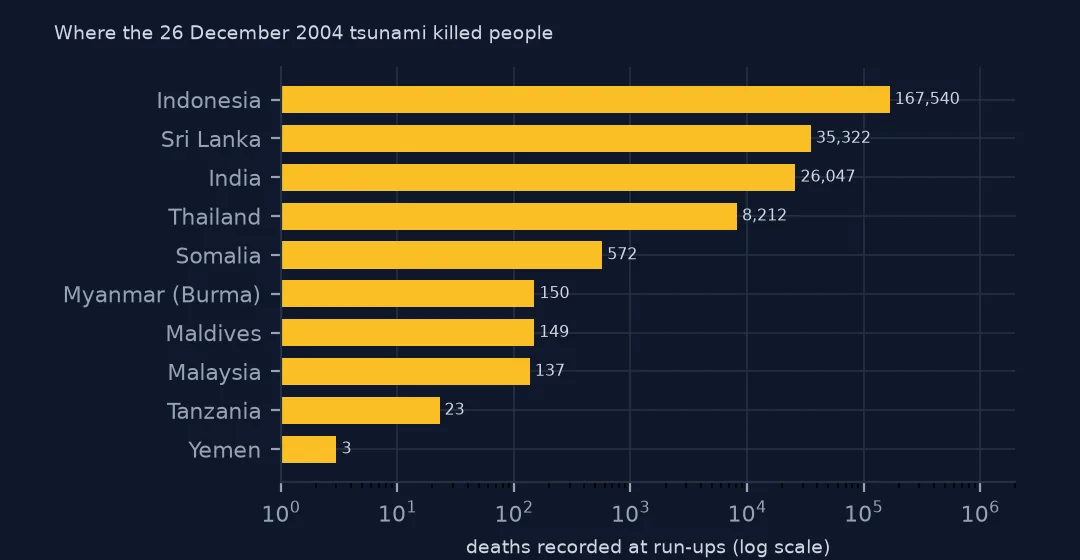
Assigned to the places where they happened, the 2004 deaths fall in Indonesia (167,540), Sri Lanka (35,322), India (26,047) and Thailand (8,212), and as far away as Somalia, across the Indian Ocean. The event itself is filed under Indonesia, where the earthquake was, a trap the country page deals with.
3. Recorded deaths by century
c = sure[sure.year >= 1500]
print(c.groupby(c.year // 100 * 100).deaths.agg(["count", "sum"]).astype(int).to_string())
count sum
year
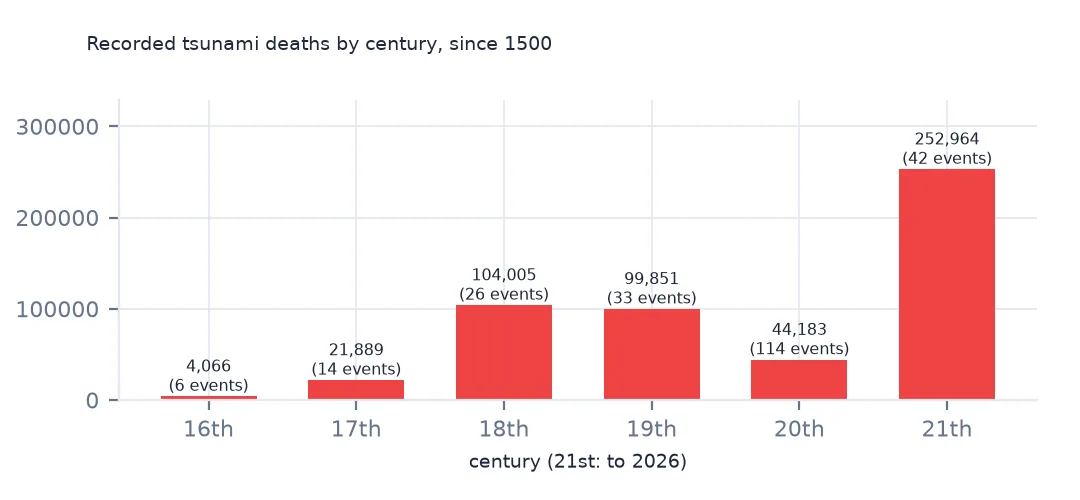
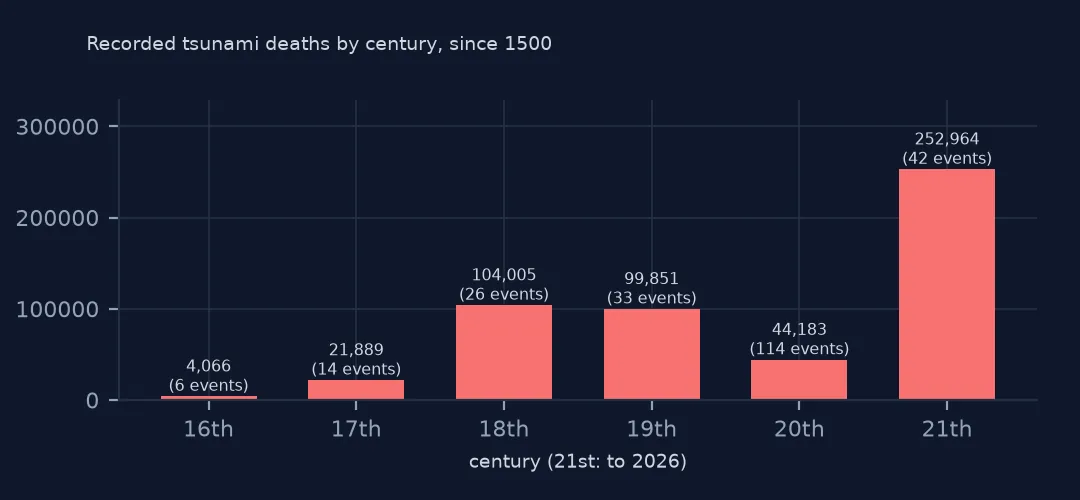
1500 6 4066
1600 14 21889
1700 26 104005
1800 33 99851
1900 114 44183
2000 42 252964
By century, the 18th has 104,005 recorded tsunami deaths, the 19th 99,851 and the 20th 44,183. The 21st already has 252,964 from 42 deadly events, nearly all from 2004 and 2011. Tsunami deaths come in rare catastrophes, so a total over a century is dominated by its largest event.
Deadliest by cause and region
The data used on this page
NOAA's Global Historical Tsunami Database from the National Centers for Environmental Information (doi:10.7289/V5PN93H7), public domain: every event and run-up from its HazEL API, downloaded on 19 October 2026 and saved on this site, because records are added and revised. Heights are in metres and distances in kilometres.
from pathlib import Path
import json
import zipfile

import geopandas as gpd
import numpy as np
import pandas as pd
import requests

Path("data").mkdir(exist_ok=True)
# NOAA NCEI Global Historical Tsunami Database (doi:10.7289/V5PN93H7): every event and every run-up from the HazEL API,
# with Natural Earth's 1:50m land and 1:110m countries. Saved 19 October 2026: events and run-ups are added and revised.
# Live: https://www.ngdc.noaa.gov/hazel/hazard-service/api/v1/tsunamis/events?page=1 (and .../runups), 200 a page
ARCHIVE = "ncei-tsunami-2026-10-19.zip"
if not Path(f"data/{ARCHIVE}").exists():
    Path(f"data/{ARCHIVE}").write_bytes(requests.get(f"https://data.spatialworkflow.io/{ARCHIVE}", timeout=600).content)
Z = zipfile.ZipFile(f"data/{ARCHIVE}")
ev = pd.DataFrame(json.loads(Z.read("tsunami-events.json")))
ru = pd.DataFrame(json.loads(Z.read("tsunami-runups.json")))
print(f"NCEI tsunami database: {len(ev):,} events, {len(ru):,} run-ups")
NCEI tsunami database: 3,138 events, 35,129 run-ups
Example 1: by cause
names = {1: "earthquake", 3: "earthquake and landslide", 5: "volcano, earthquake and landslide", 6: "volcano", 7: "volcano and landslide", 8: "landslide", 9: "meteorological"}
print(sure.groupby("causeCode").deaths.sum().rename(index=names).sort_values(ascending=False).head(5).astype(int).to_string())
causeCode
earthquake 465337
volcano 35244
earthquake and landslide 22447
volcano, earthquake and landslide 15000
landslide 4311
By cause, earthquakes account for 465,337 deaths, volcanoes 35,244, mostly Krakatau, and earthquakes with landslides 22,447. The 15,000 from an earthquake, volcano and landslide together are the single Shimabara disaster. Landslide tsunamis are among the tallest waves, but they are local and have killed 4,311.
Example 2: deaths since 1900 by decade
d = sure[sure.year >= 1900]
print(d.groupby(d.year // 10 * 10).deaths.sum().astype(int).to_string())
year
1900 5547
1910 265
1920 758
1930 3350
1940 4932
1950 10062
1960 5776
1970 9549
1980 133
1990 3811
2000 229122
2010 23828
2020 14
Since 1900 the decades vary by orders of magnitude, from 14 deaths so far in the 2020s and 133 in the 1980s to 229,122 in the 2000s. Without the 2004 tsunami the 2000s would have about 1,200. A trend in tsunami deaths needs very long periods, or a measure that isn't dominated by one event, such as the number of deadly tsunamis per decade.
Internal links
- Deaths that include the earthquake — why step 1 uses
deaths - Amount-order codes — the size codes for old events
- Run-ups of the 2011 tsunami — the deadliest tsunami in Japan's modern record
- Tsunamis counted in the wrong country — where the 2004 deaths happened