
Tsunami Deaths and Damage Coded 1 to 4: Amount Orders, Not Counts
On this page
Problem statement
Beside every count in NOAA's tsunami events, deaths, injuries, missing people, houses destroyed and damage, there is a column ending in AmountOrder with values from 1 to 4. They look like small counts, and summing them gives a meaningless number; averaging them across events is worse. They are size classes, recorded for every event where the loss is known roughly, including the many old events with no exact figure. Read correctly, they let a count include those events. This page finds the class boundaries from the events that have both a number and a code, and uses the codes where numbers are missing.
Quick answer
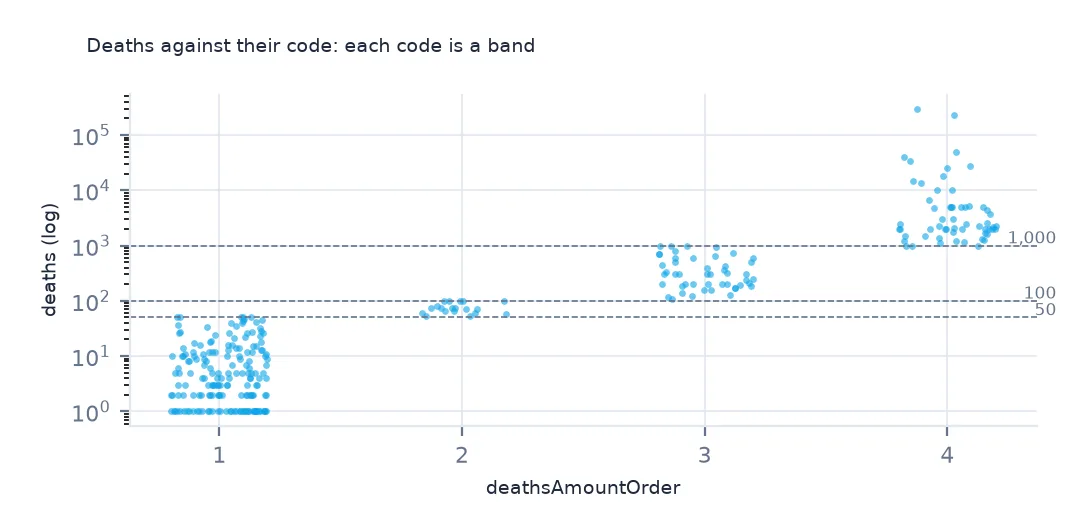
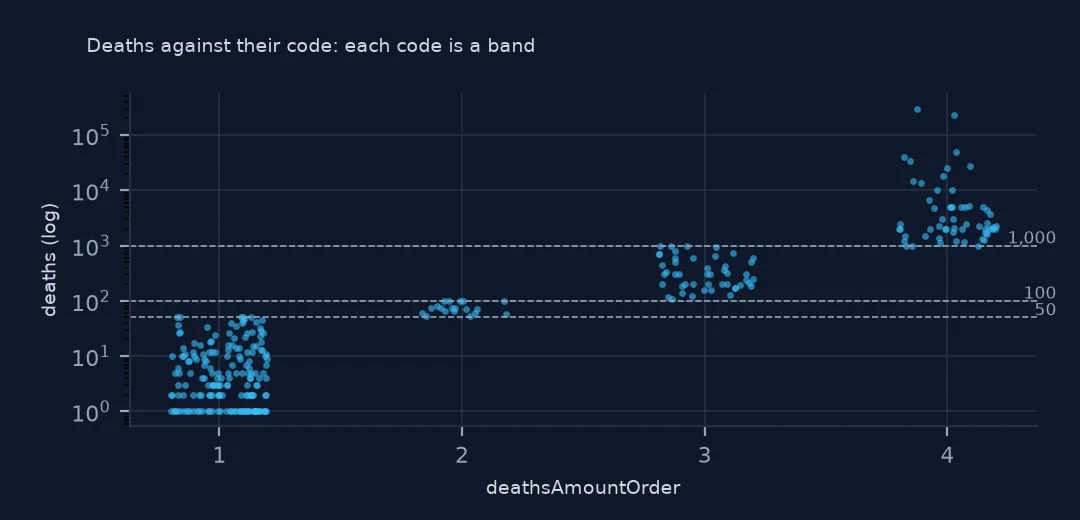
Compare each code with the exact numbers recorded beside it to recover the bands:
for col in ["deaths", "damageMillionsDollars"]:
    b = ev.dropna(subset=[col, col.replace("MillionsDollars", "") + "AmountOrder"])
    print(col); print(b.groupby(col.replace("MillionsDollars", "") + "AmountOrder")[col].agg(["size", "min", "max"]).to_string())
deaths
size min max
deathsAmountOrder
1.0 173 1.0 50.0
2.0 19 52.0 100.0
3.0 47 110.0 1000.0
4.0 58 1001.0 300000.0
damageMillionsDollars
size min max
damageAmountOrder
1.0 13 0.01 0.746
2.0 17 1.00 5.000
3.0 3 8.00 10.000
4.0 21 25.00 220136.600
The codes are bands. For deaths, every event coded 1 has 1 to 50 deaths, 2 has 52 to 100, 3 has 110 to 1,000 and 4 more than 1,000. For damage, 1 is under a million dollars, 2 one to five million, 3 between five and 25 million (the three events with both have 8 to 10 million), and 4 over 25 million.
Codes and numbers
1. How many events have only a code
for c in ["deaths", "injuries", "housesDestroyed"]:
    code = ev[c + "AmountOrder"]
    print(f"{c}: number {ev[c].notna().sum()}, code {code.notna().sum()}, code without a number {(code.notna() & ev[c].isna()).sum()}")
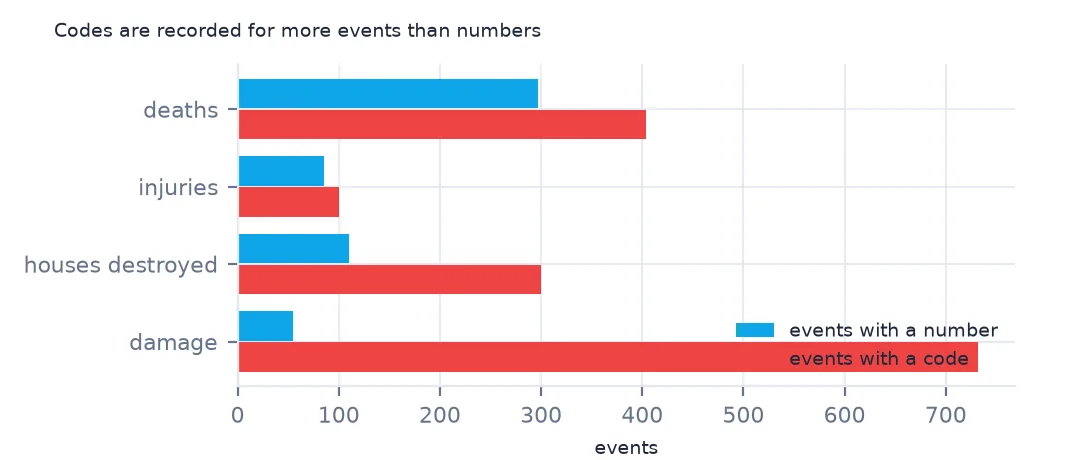
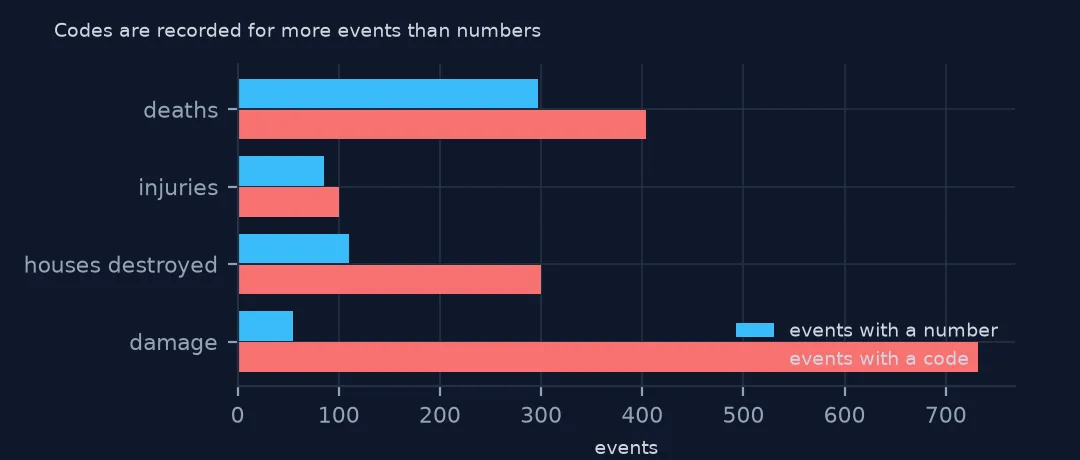
deaths: number 297, code 404, code without a number 107
injuries: number 85, code 100, code without a number 17
housesDestroyed: number 110, code 300, code without a number 191
The codes are more complete than the numbers. 404 events have a death code against 297 with a number, and 107 have only the code. For destroyed houses the gap is wider, 300 codes against 110 numbers. Old events in particular are known to have been deadly without anyone recording how many died.
2. The wrong way
print(f"sum of deathsAmountOrder: {ev.deathsAmountOrder.sum():,.0f}; mean: {ev.deathsAmountOrder.mean():.2f}")sum of deathsAmountOrder: 831; mean: 2.06
Summed, the death codes give 831 and average 2.06, numbers that mean nothing: a code of 4 is not four times a code of 1, and a mean of bands has no unit. Nothing in the column's name warns against it.
3. A count of deadly tsunamis that includes the coded ones
sure = ev[ev.eventValidity >= 3]
deadly_num = sure.deaths.gt(0)
deadly_any = deadly_num | sure.deathsAmountOrder.notna()
print(f"deadly tsunamis by number alone: {deadly_num.sum()}; including events with only a code: {deadly_any.sum()}")
print(pd.crosstab(sure.year // 100 * 100, deadly_any).loc[1500:].rename(columns={True: "deadly"})["deadly"].to_string())
deadly tsunamis by number alone: 244; including events with only a code: 317
year
1500 10
1600 25
1700 36
1800 52
1900 122
2000 43
Counting probable and definite tsunamis that killed anyone, the number alone finds 244, and the codes add 73 more, 317 in all. By century, the 19th has 52 deadly tsunamis and the 20th 122. The 21st has 43 so far.
Using the bands
The data used on this page
NOAA's Global Historical Tsunami Database from the National Centers for Environmental Information (doi:10.7289/V5PN93H7), public domain: every event and run-up from its HazEL API, downloaded on 19 October 2026 and saved on this site, because records are added and revised. Heights are in metres and distances in kilometres.
from pathlib import Path
import json
import zipfile

import geopandas as gpd
import numpy as np
import pandas as pd
import requests

Path("data").mkdir(exist_ok=True)
# NOAA NCEI Global Historical Tsunami Database (doi:10.7289/V5PN93H7): every event and every run-up from the HazEL API,
# with Natural Earth's 1:50m land and 1:110m countries. Saved 19 October 2026: events and run-ups are added and revised.
# Live: https://www.ngdc.noaa.gov/hazel/hazard-service/api/v1/tsunamis/events?page=1 (and .../runups), 200 a page
ARCHIVE = "ncei-tsunami-2026-10-19.zip"
if not Path(f"data/{ARCHIVE}").exists():
    Path(f"data/{ARCHIVE}").write_bytes(requests.get(f"https://data.spatialworkflow.io/{ARCHIVE}", timeout=600).content)
Z = zipfile.ZipFile(f"data/{ARCHIVE}")
ev = pd.DataFrame(json.loads(Z.read("tsunami-events.json")))
ru = pd.DataFrame(json.loads(Z.read("tsunami-runups.json")))
print(f"NCEI tsunami database: {len(ev):,} events, {len(ru):,} run-ups")
NCEI tsunami database: 3,138 events, 35,129 run-ups
Example 1: deadly tsunamis by band
band = {1: "1-50", 2: "51-100", 3: "101-1,000", 4: "over 1,000"}
print(sure.deathsAmountOrder.map(band).value_counts().reindex(band.values()).to_string())
deathsAmountOrder
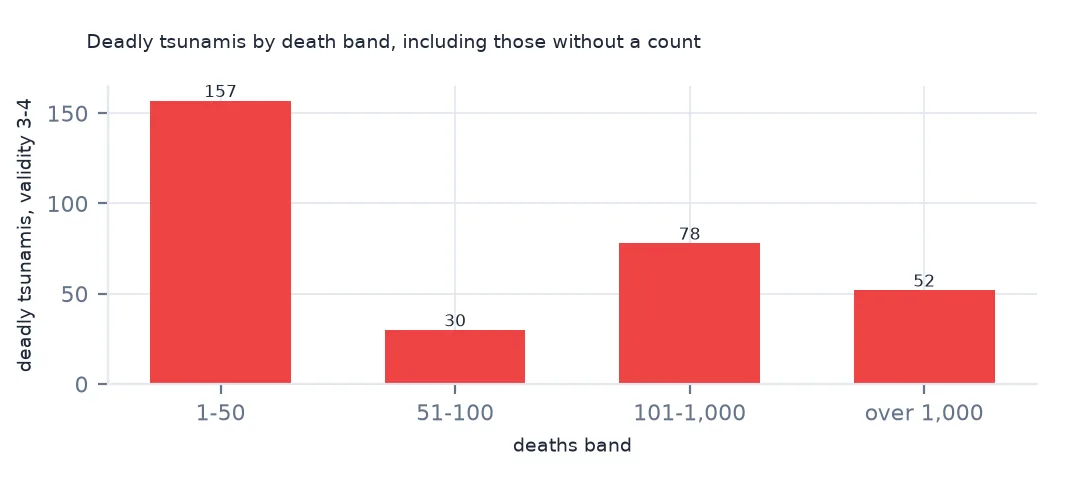
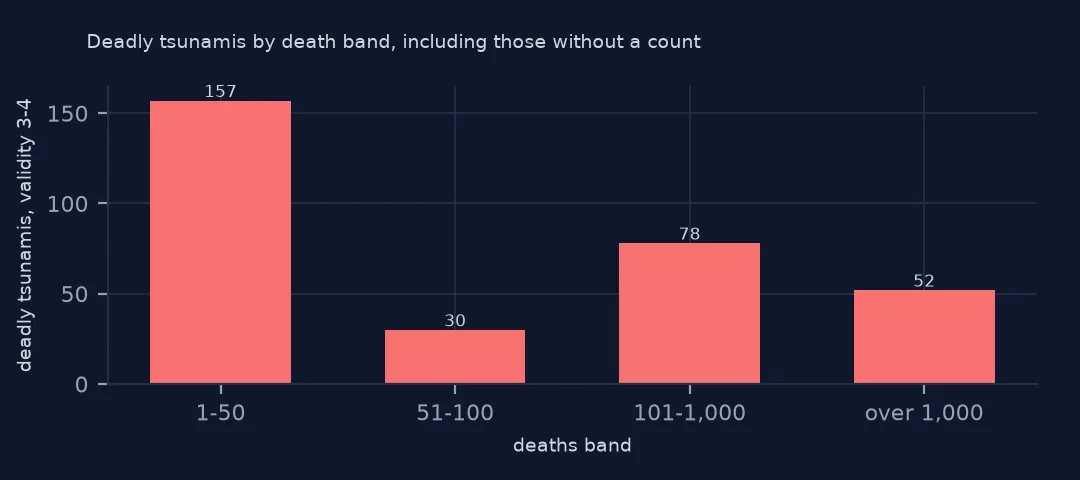
1-50 157
51-100 30
101-1,000 78
over 1,000 52
Among probable and definite tsunamis, 157 killed 1 to 50 people, 30 killed 51 to 100, 78 killed 101 to 1,000 and 52 more than 1,000. The bands keep the shape of the distribution even where the counts are missing: most deadly tsunamis are small disasters, and a few dozen are catastrophes.
Example 2: a lower bound from bands
low = {1: 1, 2: 51, 3: 101, 4: 1001}
coded = sure[sure.deaths.isna() & sure.deathsAmountOrder.notna()]
print(f"events with only a band: {len(coded)}; their deaths at least {coded.deathsAmountOrder.map(low).sum():,.0f}")
events with only a band: 73; their deaths at least 7,423
The 73 events with only a band killed at least 7,423 people, taking the bottom of each band. That is a floor to report beside a total of counted deaths, never a number to add to it as if it were a count.
Internal links
- Deaths that include the earthquake — the paired Total columns
- The deadliest tsunamis — ranking with numbers
- Which tsunamis really happened — the validity filter used here
- Loading events and run-ups — the event columns