
Tsunami Death Tolls Too High: deathsTotal Includes the Earthquake
On this page
Problem statement
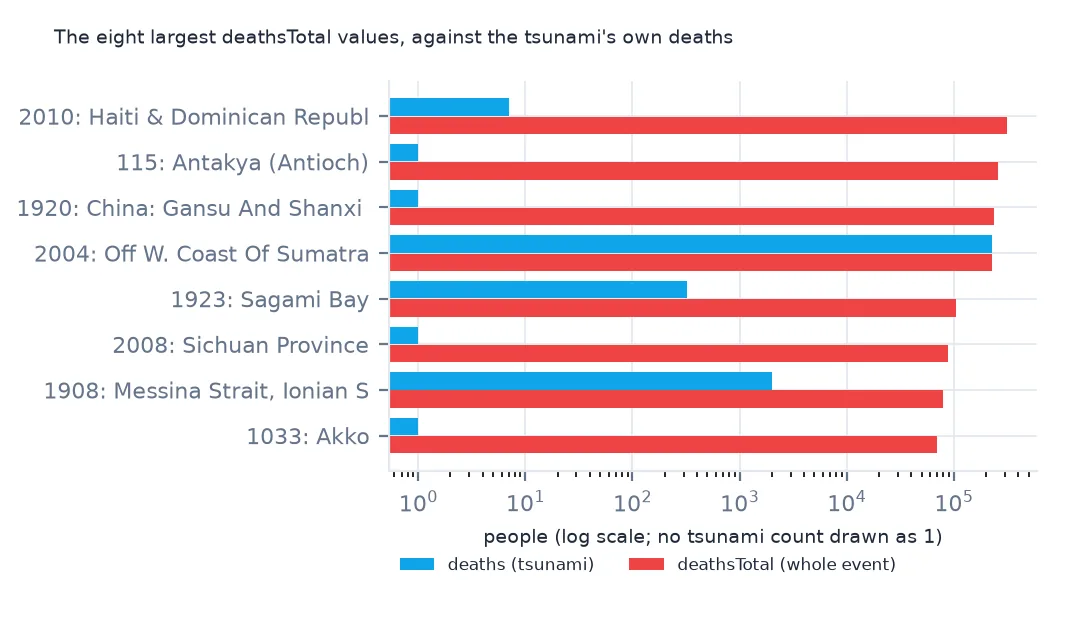
Rank NOAA's tsunami events by deathsTotal and the top of the list is not the Indian Ocean tsunami of 2004 but the Haiti earthquake of 2010, then an earthquake in ancient Antioch and the 1920 Haiyuan earthquake in inland China. Almost none of those deaths were caused by a tsunami. The event table has two death columns: deaths, the people the tsunami killed, and deathsTotal, everyone the event killed, including the earthquake, volcano or landslide that raised the wave. The same pairs exist for injuries, missing people, houses and damage. This page shows how far apart the two columns are and which to use.
Quick answer
Use deaths for the tsunami's toll. deathsTotal is the source event's:
cols = ["year", "locationName", "deaths", "deathsTotal"]
print(ev.nlargest(5, "deathsTotal")[cols].to_string(index=False))
print(ev.nlargest(5, "deaths")[cols].to_string(index=False))
year locationName deaths deathsTotal
2010 HAITI & DOMINICAN REPUBLIC 7.0 316000.0
115 ANTAKYA (ANTIOCH) NaN 260000.0
1920 CHINA: GANSU AND SHANXI PROVINCES NaN 235502.0
2004 OFF W. COAST OF SUMATRA 227899.0 227899.0
1923 SAGAMI BAY 325.0 105385.0
year locationName deaths deathsTotal
1737 CALCUTTA 300000.0 NaN
2004 OFF W. COAST OF SUMATRA 227899.0 227899.0
1755 LISBON 50000.0 50000.0
1782 TAIWAN STRAIT 40000.0 40000.0
1883 KRAKATAU 34417.0 36417.0
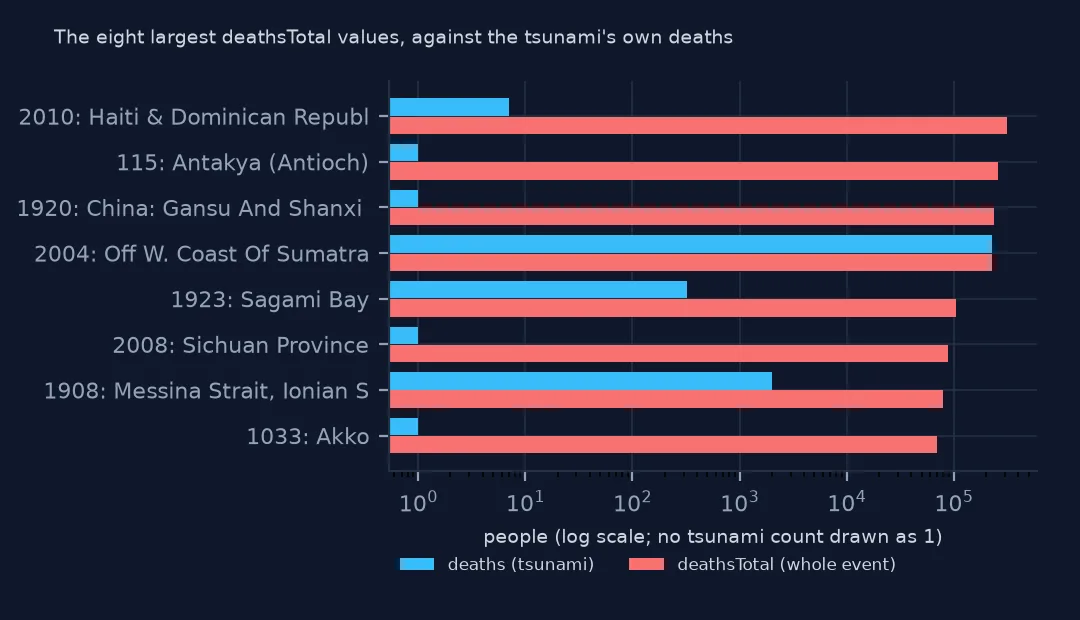
Ranked by deathsTotal, the Haiti earthquake of 2010 comes first with 316,000, of which the tsunami killed 7, then Antioch in 115 and the 1920 earthquake in Gansu, inland China, with no tsunami deaths recorded at all. The 1923 Kantō earthquake killed 105,385 people, 325 of them by the tsunami in Sagami Bay. Ranked by deaths, the top entry is Calcutta in 1737 with 300,000. It is kept in the table but marked as an erroneous entry, validity -1, with a meteorological cause: a cyclone's storm surge, not a tsunami. That is why the deadliest-tsunami ranking filters on validity as well. Then come 2004, Lisbon, the Taiwan Strait and Krakatau.
Two columns for each loss
1. How often they differ
both = ev.dropna(subset=["deathsTotal"])
print(f"events with deathsTotal: {len(both)}; deaths missing there: {both.deaths.isna().sum()}; total larger than deaths: {(both.deathsTotal > both.deaths).sum()}; equal: {(both.deathsTotal == both.deaths).sum()}")
events with deathsTotal: 723; deaths missing there: 434; total larger than deaths: 70; equal: 219
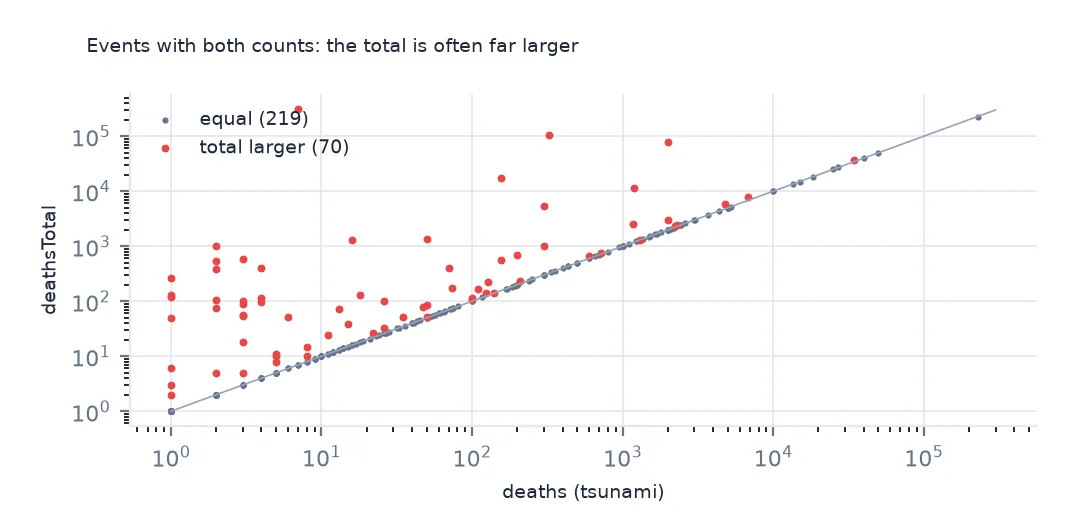
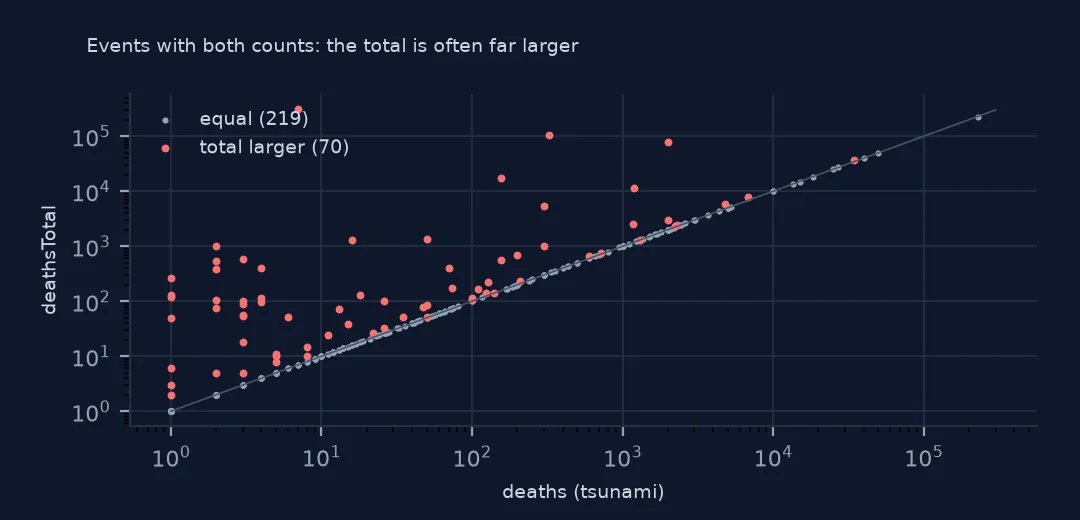
723 events have a total, and on 434 of them the tsunami's own deaths are missing. Where both exist, the total is larger in 70 events and equal in 219. Equal means the deaths were all from the tsunami, or that nobody separated them.
2. A recent example
noto = ev[(ev.year == 2024) & (ev.month == 1) & (ev.day == 1)]
print(noto[["locationName", "deaths", "deathsTotal", "housesDestroyed", "housesDestroyedTotal"]].to_string(index=False))
locationName deaths deathsTotal housesDestroyed housesDestroyedTotal
HONSHU: W COAST 2.0 549.0 NaN 29966.0
The Noto Peninsula earthquake of 1 January 2024 killed 549 people, 2 of them in the tsunami, and destroyed 29,966 houses, with no separate figure for the tsunami. A dashboard of "tsunami damage" built on the Total columns would have shown Noto as one of the worst tsunami disasters of the decade.
3. Every paired column
pairs = [c for c in ev.columns if c + "Total" in ev.columns]
print(pairs)
print({c: f"{ev[c].sum():,.0f} vs {ev[c + 'Total'].sum():,.0f}" for c in ["deaths", "injuries", "housesDestroyed", "damageMillionsDollars"]})
['deathsAmountOrder', 'damageAmountOrder', 'housesDestroyedAmountOrder', 'deaths', 'housesDamagedAmountOrder', 'housesDestroyed', 'injuries', 'injuriesAmountOrder', 'housesDamaged', 'damageMillionsDollars', 'missing', 'missingAmountOrder']
{'deaths': '911,791 vs 3,044,041', 'injuries': '108,666 vs 1,648,659', 'housesDestroyed': '393,815 vs 9,378,328', 'damageMillionsDollars': '266,748 vs 718,511'}
Every loss has the same pair: deaths, injuries, missing, houses destroyed and damaged, and damage in millions of dollars, each with a Total twin and an amount-order code. Summed over all events the totals are 3.3 times the tsunami deaths and 15 times the injuries, and destroyed houses differ by a factor of 24.
Totals by decade
The data used on this page
NOAA's Global Historical Tsunami Database from the National Centers for Environmental Information (doi:10.7289/V5PN93H7), public domain: every event and run-up from its HazEL API, downloaded on 19 October 2026 and saved on this site, because records are added and revised. Heights are in metres and distances in kilometres.
from pathlib import Path
import json
import zipfile

import geopandas as gpd
import numpy as np
import pandas as pd
import requests

Path("data").mkdir(exist_ok=True)
# NOAA NCEI Global Historical Tsunami Database (doi:10.7289/V5PN93H7): every event and every run-up from the HazEL API,
# with Natural Earth's 1:50m land and 1:110m countries. Saved 19 October 2026: events and run-ups are added and revised.
# Live: https://www.ngdc.noaa.gov/hazel/hazard-service/api/v1/tsunamis/events?page=1 (and .../runups), 200 a page
ARCHIVE = "ncei-tsunami-2026-10-19.zip"
if not Path(f"data/{ARCHIVE}").exists():
    Path(f"data/{ARCHIVE}").write_bytes(requests.get(f"https://data.spatialworkflow.io/{ARCHIVE}", timeout=600).content)
Z = zipfile.ZipFile(f"data/{ARCHIVE}")
ev = pd.DataFrame(json.loads(Z.read("tsunami-events.json")))
ru = pd.DataFrame(json.loads(Z.read("tsunami-runups.json")))
print(f"NCEI tsunami database: {len(ev):,} events, {len(ru):,} run-ups")
NCEI tsunami database: 3,138 events, 35,129 run-ups
Example 1: a century of deaths both ways
c = ev[(ev.year >= 1900) & (ev.eventValidity >= 3)]
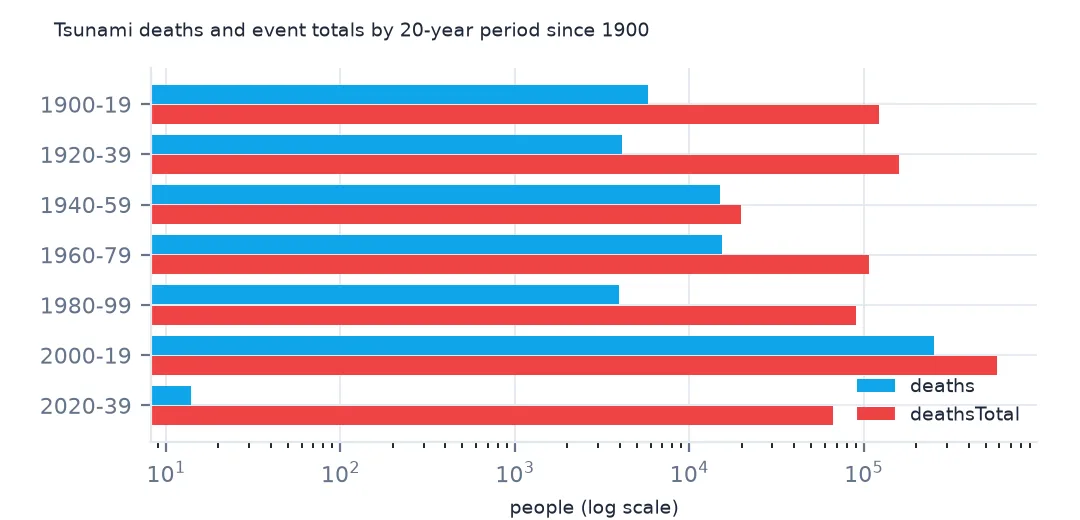
print(c.groupby(c.year // 20 * 20)[["deaths", "deathsTotal"]].sum().astype(int).to_string())
deaths deathsTotal
year
1900 5812 121921
1920 4108 158537
1940 14994 19683
1960 15325 107916
1980 3944 90350
2000 252950 578194
2020 14 66706
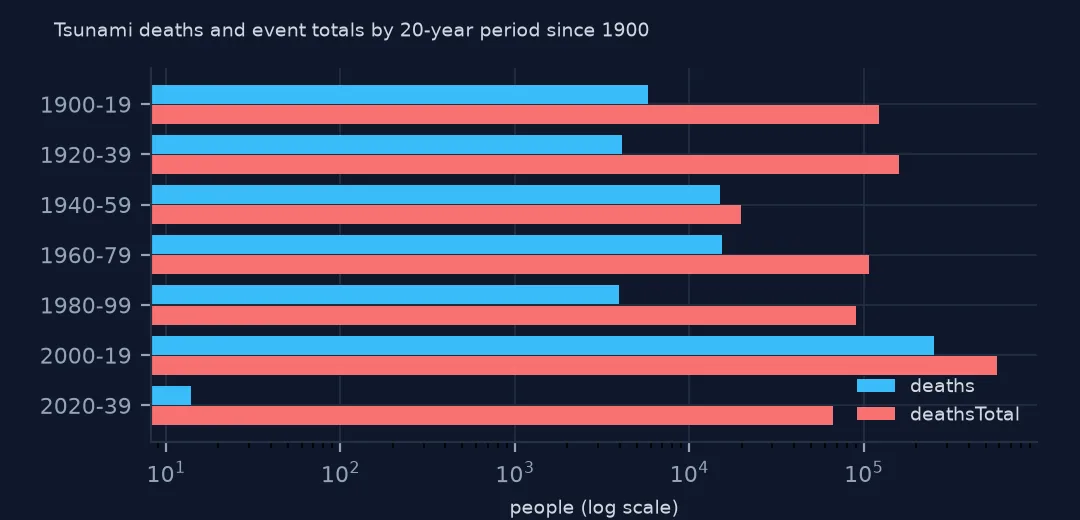
By twenty-year period since 1900, the two columns tell different histories: 1900-1919 has 5,812 tsunami deaths but 121,921 in total, and the 2020s so far have 14 against 66,706. Only 2000-2019, dominated by the 2004 tsunami, has the same order of magnitude in both.
Example 2: when the total is all you have
only = ev[ev.deaths.isna() & ev.deathsTotal.notna()]
print(f"events with a total but no tsunami deaths: {len(only)}; their summed total: {only.deathsTotal.sum():,.0f}")
print(only.nlargest(3, "deathsTotal")[["year", "locationName", "deathsTotal", "causeCode"]].to_string(index=False))
events with a total but no tsunami deaths: 434; their summed total: 1,885,678
year locationName deathsTotal causeCode
115 ANTAKYA (ANTIOCH) 260000.0 1.0
1920 CHINA: GANSU AND SHANXI PROVINCES 235502.0 1.0
2008 SICHUAN PROVINCE 87652.0 1.0
434 events have a total but no tsunami death count, and their totals sum to 1,885,678. The largest are earthquakes on land, Antioch, Gansu and Sichuan in 2008, that set off waves on rivers, lakes or the nearest coast. For these events the tsunami's own toll is unknown, often because it can't be separated from the earthquake's. Leave them out of a tsunami death count, or report them separately as deaths from the event, tsunami share unknown.
Internal links
- The deadliest tsunamis — the ranking done with
deaths - Amount-order codes — the size codes beside each count
- Loading events and run-ups — the event columns
- Crash deaths bigger than the official total — another death count that adds the wrong rows