
How to Load NOAA Tsunami Events and Run-ups in Python
On this page
Problem statement
NOAA's National Centers for Environmental Information keep the world's reference record of tsunamis, from the second millennium BCE to last month. It comes as two tables. An event is one tsunami, located at its source, with its cause, validity, magnitude of the earthquake behind it, the highest wave anywhere, and the deaths and damage. A run-up is one place where the tsunami was observed: a tide gauge reading, an eyewitness report or a survey of the water line, with its height, distance from the source and arrival time. The HazEL API serves both as JSON, 200 records a page. This page loads them, joins them and shows what is in each.
Quick answer
Page through the API until totalPages, or read the saved copy as the setup does, then join run-ups to events on tsunamiEventId:
print(ev[["id", "year", "locationName", "country", "causeCode", "eventValidity", "eqMagnitude", "maxWaterHeight", "numRunups"]].tail(3).to_string(index=False))
j = ru.merge(ev[["id", "year", "locationName"]], left_on="tsunamiEventId", right_on="id", suffixes=("", "_event"))
print(f"run-ups joined to an event: {len(j):,} of {len(ru):,}; events with at least one run-up: {(ev.numRunups > 0).sum():,}")
id year locationName country causeCode eventValidity eqMagnitude maxWaterHeight numRunups
6192 1858 HIIUMA ISLAND ESTONIA 2.0 2 3.0 NaN 1
6193 2026 ISLA CAÑAS, PANAMA PANAMA 1.0 3 7.7 NaN 1
6194 1621 PANAMA PANAMA 1.0 2 6.0 NaN 0
run-ups joined to an event: 35,129 of 35,129; events with at least one run-up: 2,481
The last rows of the event table show its range: a probable tsunami off Panama in 2026 after a magnitude 7.7 earthquake, beside questionable entries from 1858 Estonia and 1621 Panama. The rows are in the order they were entered, not by date, so sort by year before reading a timeline. Every run-up joins to an event, while 657 events have no run-up at all, mostly old ones known only from a general description.
Two tables
1. Events
print(f"{len(ev):,} events, {ev.year.min()} to {ev.year.max()}; since 1900: {(ev.year >= 1900).sum():,}")
print(ev[["maxWaterHeight", "eqMagnitude", "deaths", "numRunups"]].describe().loc[["count", "50%", "max"]].round(1).to_string())
3,138 events, -2000 to 2026; since 1900: 1,664
maxWaterHeight eqMagnitude deaths numRunups
count 1461.0 1737.0 297.0 3138.0
50% 1.0 7.0 22.0 1.0
max 524.6 9.5 300000.0 6429.0
The 3,138 events run from 2000 BCE, written -2000, to 2026, and 1,664 are from 1900 on. Most columns are sparse. The maximum water height is known for 1,461 events and the earthquake magnitude for 1,737, while a tsunami death count exists for only 297. The median event has one run-up and a maximum height of 1 m. The record's extremes are a 524.6 m wave and the 300,000 deaths of a single event.
2. Run-ups
print(f"{len(ru):,} run-ups in {ru.country.nunique()} countries; with a height: {ru.runupHt.notna().sum():,}")
print(ru[["runupHt", "distFromSource"]].describe().loc[["50%", "max"]].round(1).to_string())
print(ev.nlargest(3, "numRunups")[["year", "locationName", "numRunups"]].to_string(index=False))
35,129 run-ups in 150 countries; with a height: 30,122
runupHt distFromSource
50% 2.0 242.1
max 524.3 19338.3
year locationName numRunups
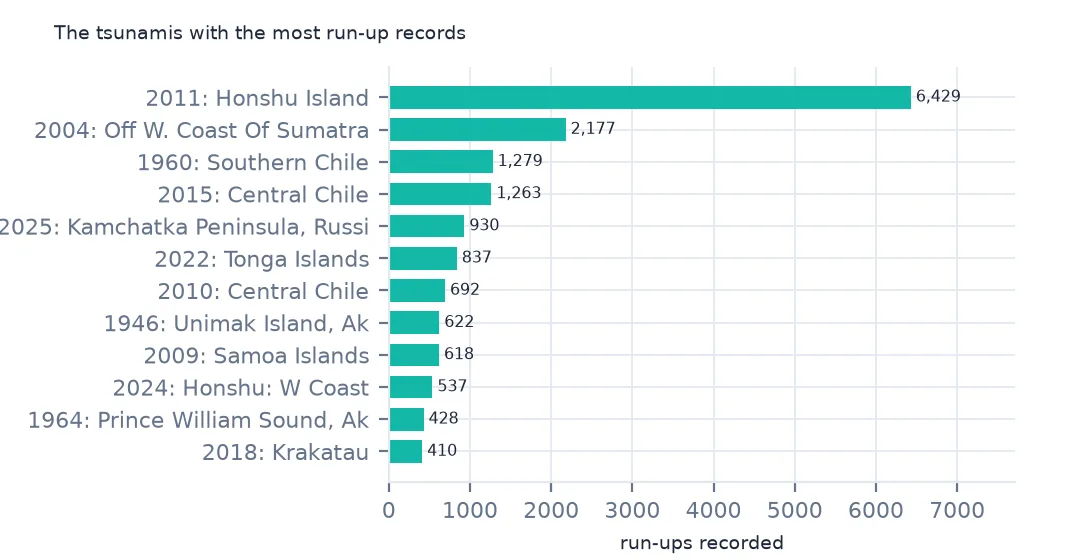
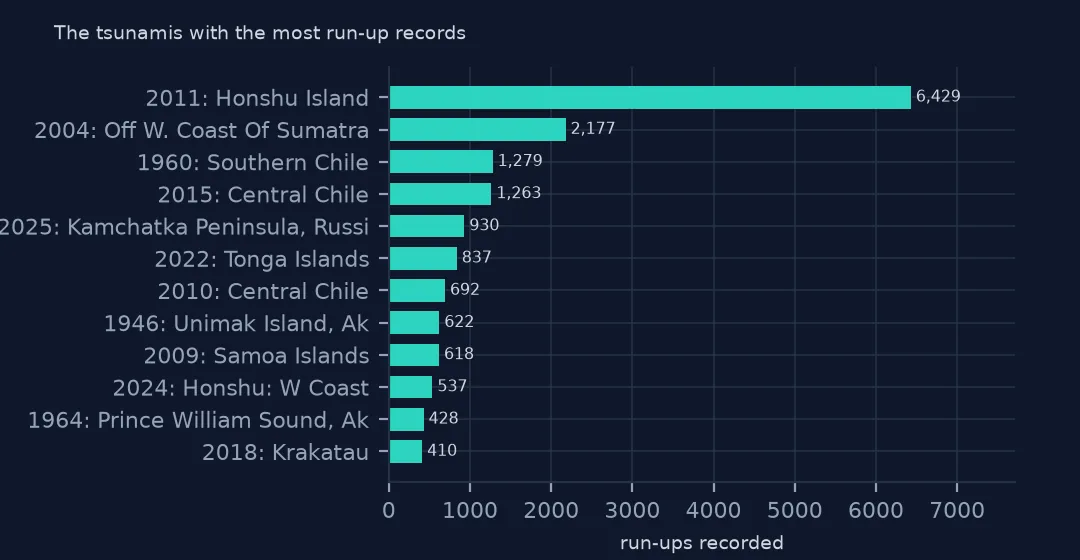
2011 HONSHU ISLAND 6429
2004 OFF W. COAST OF SUMATRA 2177
1960 SOUTHERN CHILE 1279
The run-up table has 35,129 places in 150 countries, 30,122 with a height. The median run-up was 2.0 m high and 242 km from the source, and the furthest was over 19,000 km away, on the far side of the Earth. Three events supply 9,885 of the run-ups: Japan in 2011, Sumatra in 2004 and southern Chile in 1960.
3. The paging
print(f"pages of 200 needed: events {-(-len(ev) // 200)}, run-ups {-(-len(ru) // 200)}")pages of 200 needed: events 16, run-ups 176
Each API response carries totalPages, so a loader requests page 1, reads the count, and loops. The run-ups take 176 requests, and a pause of a fraction of a second between them keeps the download polite.
Events since 1900 on a map
The data used on this page
NOAA's Global Historical Tsunami Database from the National Centers for Environmental Information (doi:10.7289/V5PN93H7), public domain: every event and run-up from its HazEL API, downloaded on 19 October 2026 and saved on this site, because records are added and revised. Heights are in metres and distances in kilometres.
from pathlib import Path
import json
import zipfile

import geopandas as gpd
import numpy as np
import pandas as pd
import requests

Path("data").mkdir(exist_ok=True)
# NOAA NCEI Global Historical Tsunami Database (doi:10.7289/V5PN93H7): every event and every run-up from the HazEL API,
# with Natural Earth's 1:50m land and 1:110m countries. Saved 19 October 2026: events and run-ups are added and revised.
# Live: https://www.ngdc.noaa.gov/hazel/hazard-service/api/v1/tsunamis/events?page=1 (and .../runups), 200 a page
ARCHIVE = "ncei-tsunami-2026-10-19.zip"
if not Path(f"data/{ARCHIVE}").exists():
    Path(f"data/{ARCHIVE}").write_bytes(requests.get(f"https://data.spatialworkflow.io/{ARCHIVE}", timeout=600).content)
Z = zipfile.ZipFile(f"data/{ARCHIVE}")
ev = pd.DataFrame(json.loads(Z.read("tsunami-events.json")))
ru = pd.DataFrame(json.loads(Z.read("tsunami-runups.json")))
print(f"NCEI tsunami database: {len(ev):,} events, {len(ru):,} run-ups")
NCEI tsunami database: 3,138 events, 35,129 run-ups
Example 1: by decade
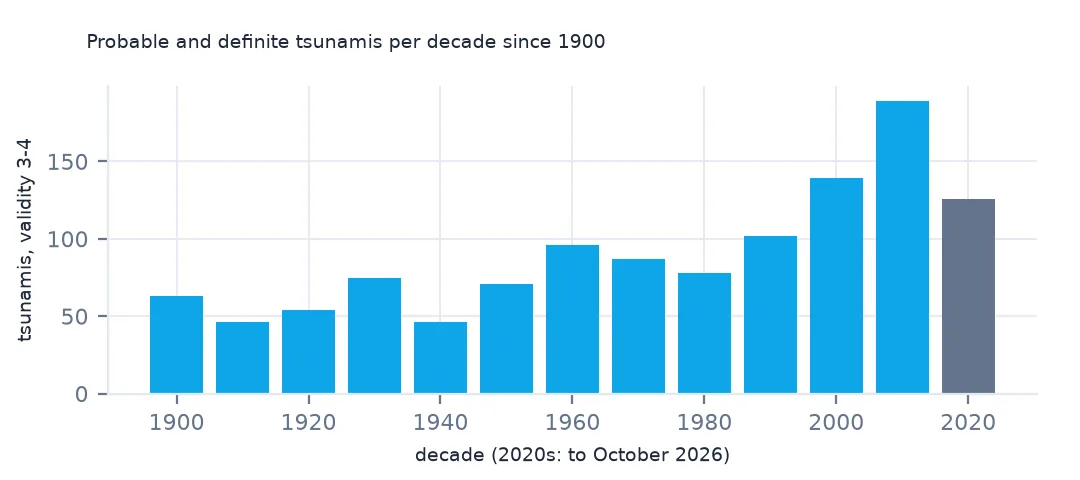
recent = ev[(ev.year >= 1900) & (ev.eventValidity >= 3)]
print(recent.groupby(recent.year // 10 * 10).size().to_string())
year
1900 63
1910 46
1920 54
1930 75
1940 46
1950 71
1960 96
1970 87
1980 78
1990 102
2000 139
2010 189
2020 126
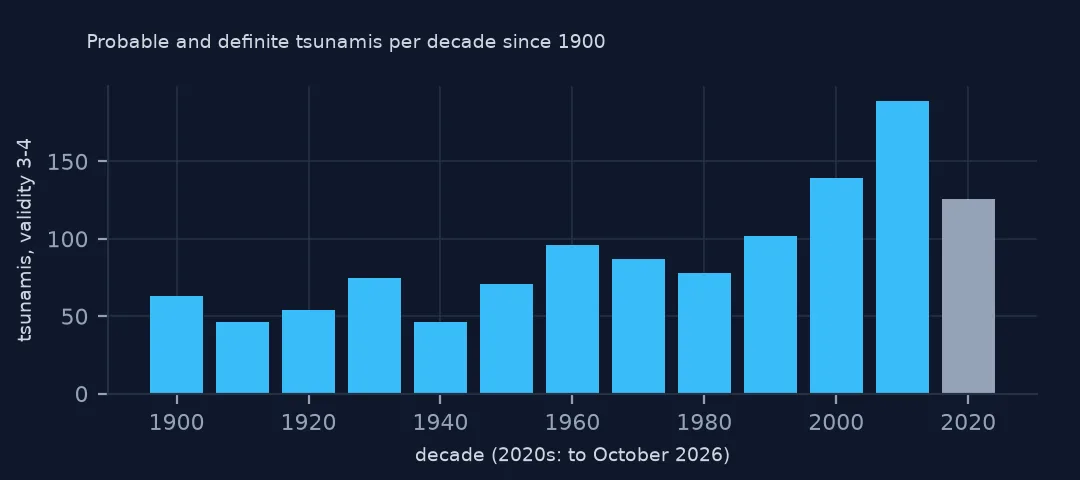
Probable and definite tsunamis per decade rise from about 50 to 100 through the 20th century to 139 in the 2000s and 189 in the 2010s. The rise is mostly measurement: tide gauges and deep-ocean sensors now register waves of a few centimetres that nobody would have noticed in 1920. The 2020s have 126 in under seven years.
Example 2: the map
g = gpd.GeoDataFrame(recent, geometry=gpd.points_from_xy(recent.longitude, recent.latitude), crs=4326)
Path("data/ne_110m_admin_0_countries.zip").write_bytes(Z.read("ne_110m_admin_0_countries.zip"))
world = gpd.read_file("data/ne_110m_admin_0_countries.zip")
ax = world.plot(color="#e5e7eb", figsize=(12, 6))
g.plot(ax=ax, markersize=g.maxWaterHeight.fillna(0.5).clip(0.5, 30) * 2, column="causeCode", legend=False)
ax.set_axis_off()
print(f"events drawn: {len(g)}; without coordinates: {g.geometry.is_empty.sum()}")
events drawn: 1172; without coordinates: 0
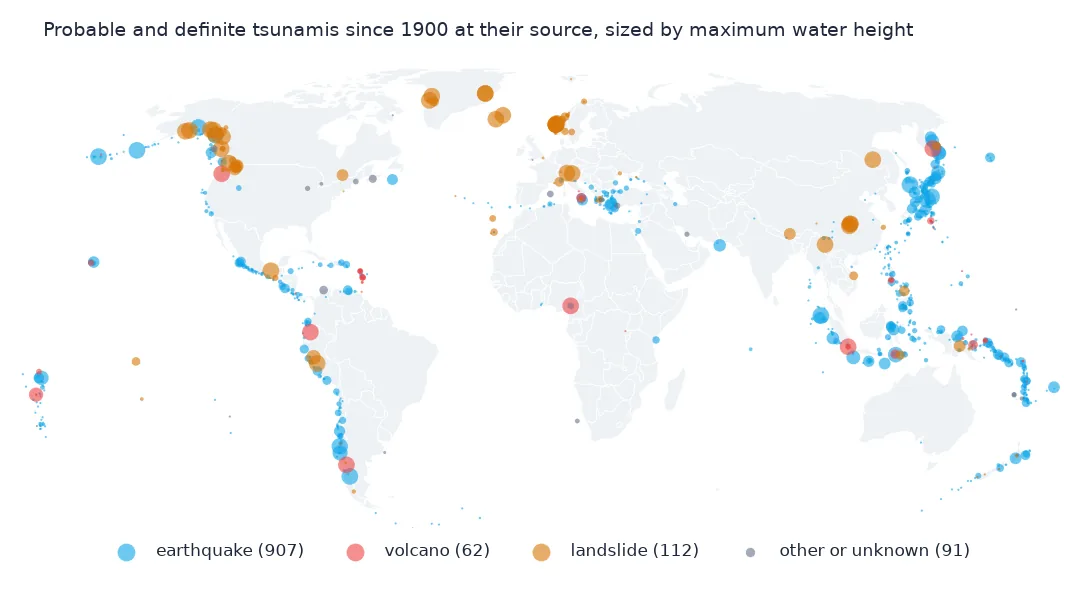
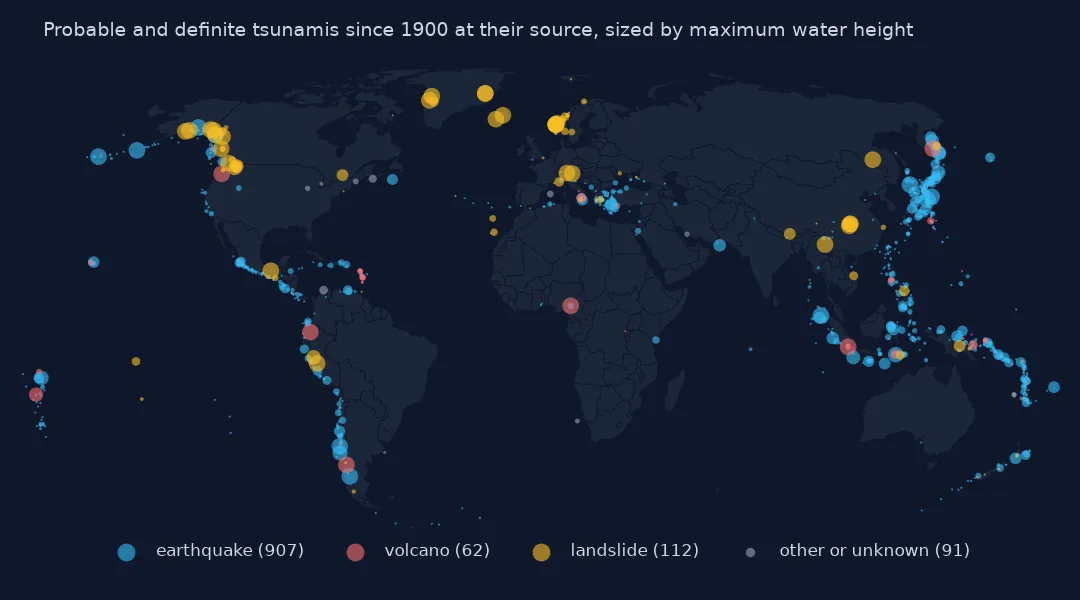
The 1,172 probable or definite tsunamis since 1900 ring the Pacific, with clusters in Japan, Indonesia, Chile and Peru, Alaska, Central America and the Mediterranean. Sized by maximum water height, the largest circles are the great subduction earthquakes and a few landslide and volcanic waves.
Internal links
- Which tsunamis really happened — validity and causes, and getting the data without code
- Deaths that include the earthquake — the first column to check
- Run-ups of one tsunami — the run-up table in detail
- Tsunamis by cause — earthquakes, landslides and volcanoes