
How to Count Tsunamis by Cause: Earthquakes, Landslides and Volcanoes
On this page
Problem statement
Most tsunamis are raised by earthquakes under the sea, but the tallest waves in the record come from elsewhere: a rockslide into an Alaskan fjord, a volcano collapsing into the sea, a meteorological pressure jump that sends a wave along a coast. NOAA's database codes each event's cause, so tsunamis can be counted by cause and their heights and death tolls compared. The comparison holds a trap of its own: the maximum water height of a landslide tsunami is often measured on the slope of a narrow bay, a few hundred metres from where the rock fell, and is not comparable with an ocean-wide wave. This page counts causes and compares their heights, reach and deaths.
Quick answer
Name the cause codes and count events of validity 3 or 4:
CAUSE = {0: "unknown", 1: "earthquake", 2: "questionable earthquake", 3: "earthquake and landslide", 4: "volcano and earthquake",
         5: "volcano, earthquake and landslide", 6: "volcano", 7: "volcano and landslide", 8: "landslide", 9: "meteorological",
         10: "explosion", 11: "astronomical tide"}
sure = ev[ev.eventValidity >= 3].assign(cause=lambda d: d.causeCode.map(CAUSE))
print(sure.cause.value_counts().to_string())
cause
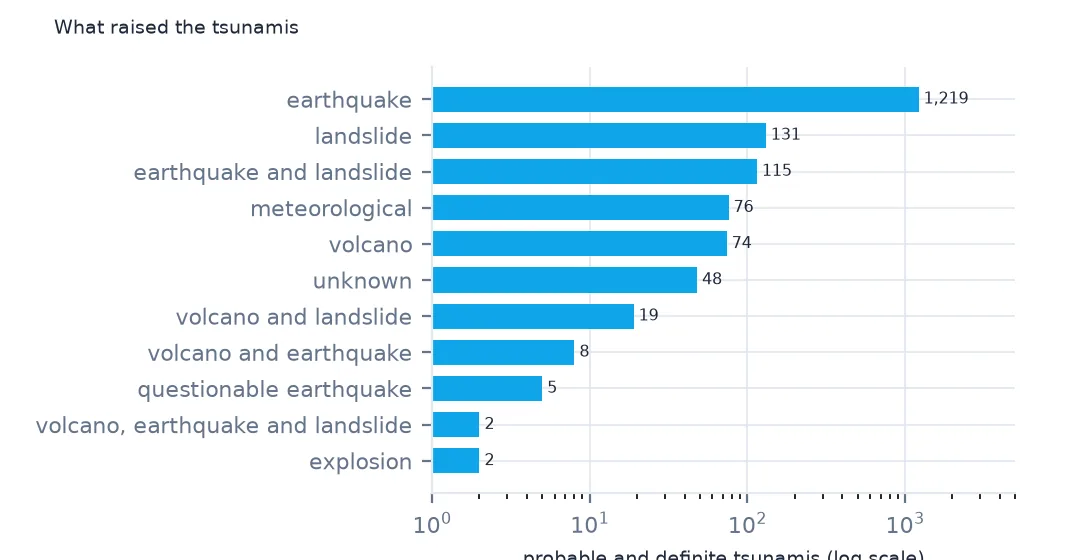
earthquake 1219
landslide 131
earthquake and landslide 115
meteorological 76
volcano 74
unknown 48
volcano and landslide 19
volcano and earthquake 8
questionable earthquake 5
volcano, earthquake and landslide 2
explosion 2
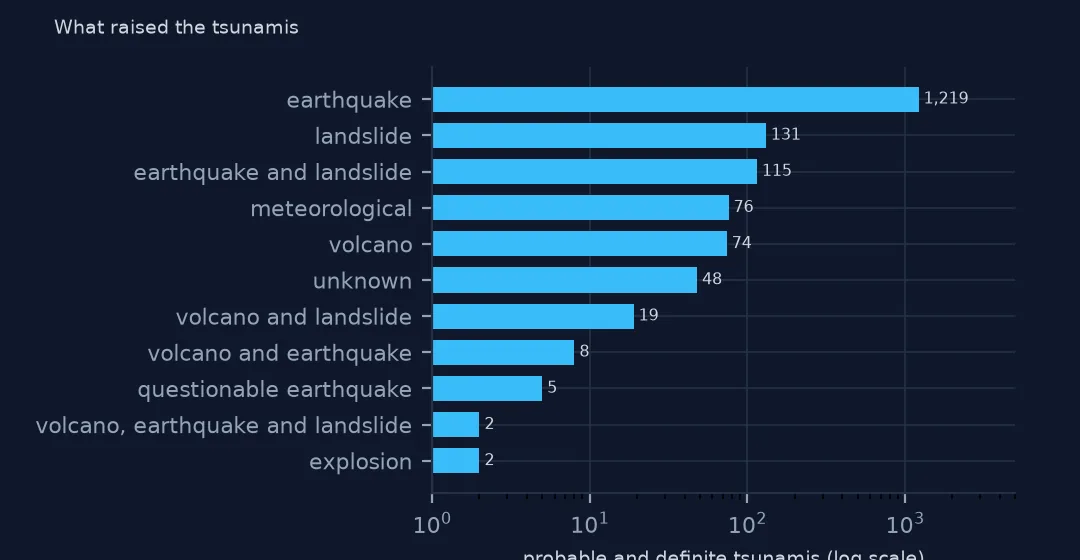
Of 1,699 probable or definite tsunamis, 1,219 were raised by earthquakes, 72%. Landslides alone caused 131 and landslides set off by earthquakes another 115. 76 were meteorological, 74 volcanic and 19 caused by volcanic landslides. Two were explosions. The codes 2, 4 and 5 cover a few uncertain and mixed cases.
Height, reach and deaths
1. Maximum water height
print(sure.groupby("cause").maxWaterHeight.agg(["count", "median", "max"]).dropna().sort_values("count", ascending=False).round(1).head(7).to_string()) count median max
cause
earthquake 857 0.6 88.0
landslide 102 7.0 481.0
earthquake and landslide 75 3.0 524.6
meteorological 66 0.7 7.0
volcano 44 1.0 90.0
unknown 29 2.2 30.0
volcano and landslide 17 10.0 250.0
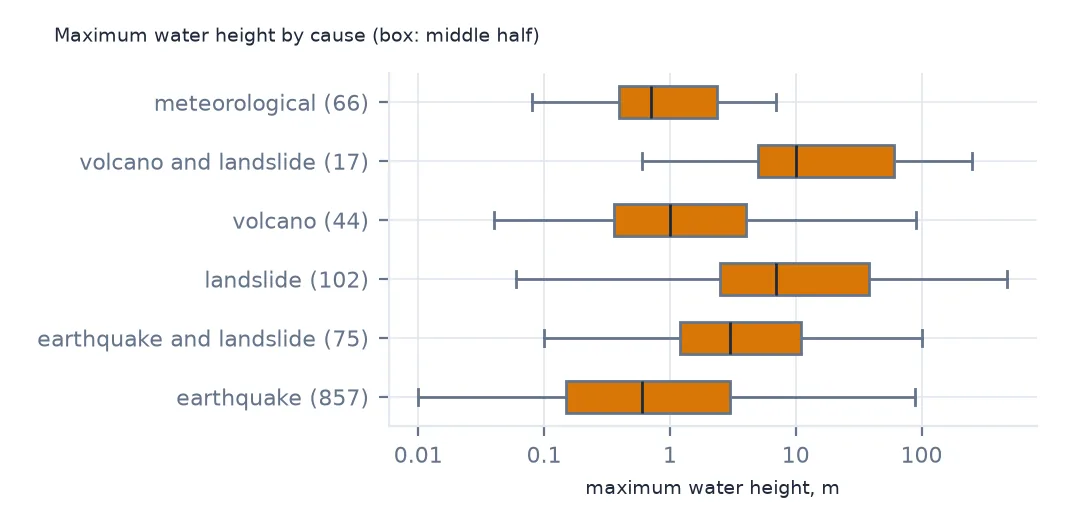
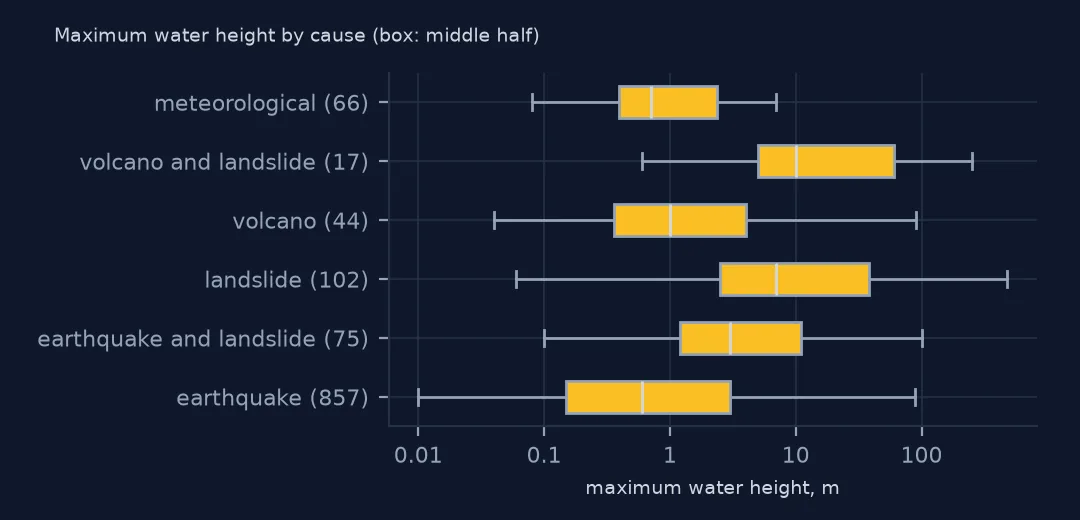
The median earthquake tsunami reached 0.6 m at its highest point, and the median landslide tsunami 7.0 m, more than ten times as high. The maxima are further apart still: 88 m for an earthquake tsunami, 481 and 524.6 m for landslides. A landslide wave is tall near where it starts and dies away quickly.
2. How far they reach
far = ru[ru.runupHt > 0].groupby("tsunamiEventId").distFromSource.max().rename("reach_km")
r = sure.merge(far, left_on="id", right_index=True)
print(r.groupby("cause").reach_km.median().sort_values(ascending=False).round(0).head(6).to_string())
cause
earthquake 359.0
earthquake and landslide 273.0
volcano and earthquake 101.0
meteorological 96.0
unknown 83.0
volcano and landslide 80.0
Earthquake tsunamis reach furthest, a median of 359 km to the furthest run-up with a height, and earthquakes with landslides 273 km. Volcanic landslides, meteotsunamis and unknown causes reach about 80 to 100 km. The earthquake waves are the ones that cross oceans, because a fault rupture lifts the sea over hundreds of kilometres.
3. The tallest waves
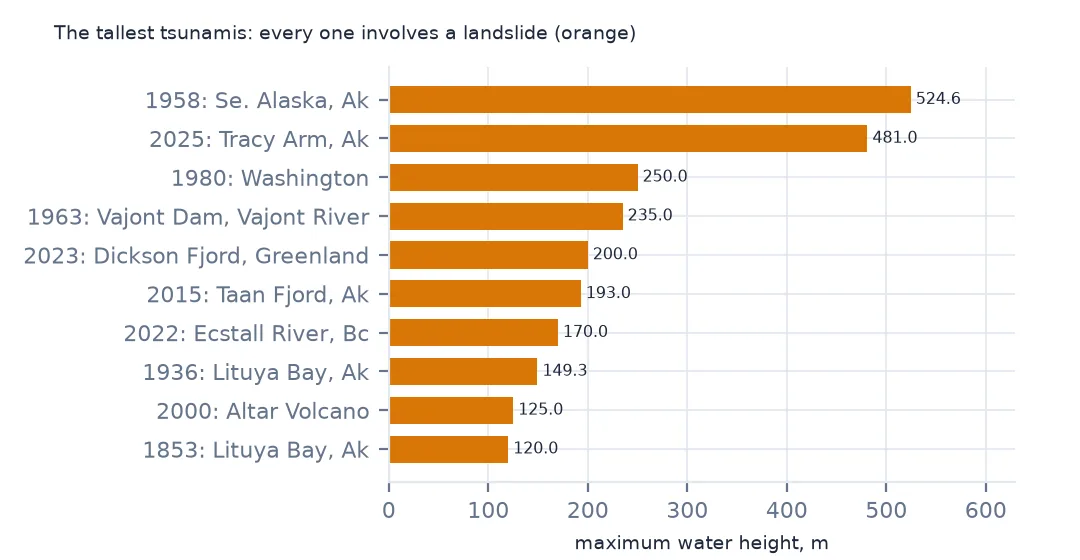
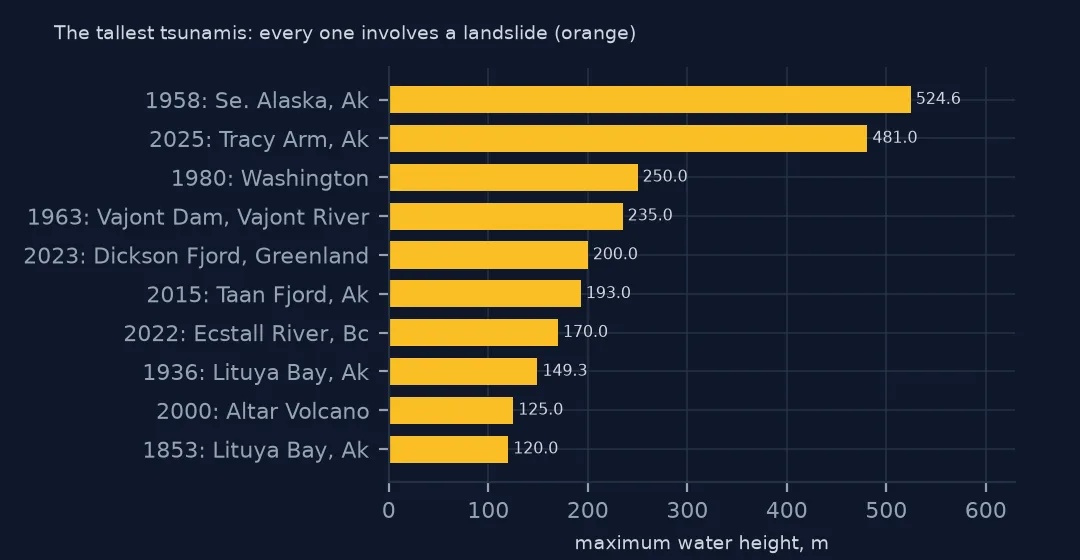
print(sure.nlargest(6, "maxWaterHeight")[["year", "locationName", "cause", "maxWaterHeight", "numRunups"]].to_string(index=False)) year locationName cause maxWaterHeight numRunups
1958 SE. ALASKA, AK earthquake and landslide 524.6 17
2025 TRACY ARM, AK landslide 481.0 178
1980 WASHINGTON volcano and landslide 250.0 2
1963 VAJONT DAM, VAJONT RIVER landslide 235.0 6
2023 DICKSON FJORD, GREENLAND landslide 200.0 5
2015 TAAN FJORD, AK landslide 193.0 316
The six tallest waves in the record are all landslides into narrow water: Lituya Bay in Alaska in 1958 at 524.6 m, Tracy Arm in Alaska in 2025 at 481 m, the 1980 eruption of Mount St Helens, which dropped its north flank into Spirit Lake, the Vajont reservoir in Italy in 1963, Dickson Fjord in Greenland in 2023 and Taan Fjord in Alaska in 2015. These heights are the water's reach up a slope opposite the slide. Rank them separately from ocean tsunamis, or leave them out of a ranking of wave heights.
Causes over time
The data used on this page
NOAA's Global Historical Tsunami Database from the National Centers for Environmental Information (doi:10.7289/V5PN93H7), public domain: every event and run-up from its HazEL API, downloaded on 19 October 2026 and saved on this site, because records are added and revised. Heights are in metres and distances in kilometres.
from pathlib import Path
import json
import zipfile

import geopandas as gpd
import numpy as np
import pandas as pd
import requests

Path("data").mkdir(exist_ok=True)
# NOAA NCEI Global Historical Tsunami Database (doi:10.7289/V5PN93H7): every event and every run-up from the HazEL API,
# with Natural Earth's 1:50m land and 1:110m countries. Saved 19 October 2026: events and run-ups are added and revised.
# Live: https://www.ngdc.noaa.gov/hazel/hazard-service/api/v1/tsunamis/events?page=1 (and .../runups), 200 a page
ARCHIVE = "ncei-tsunami-2026-10-19.zip"
if not Path(f"data/{ARCHIVE}").exists():
    Path(f"data/{ARCHIVE}").write_bytes(requests.get(f"https://data.spatialworkflow.io/{ARCHIVE}", timeout=600).content)
Z = zipfile.ZipFile(f"data/{ARCHIVE}")
ev = pd.DataFrame(json.loads(Z.read("tsunami-events.json")))
ru = pd.DataFrame(json.loads(Z.read("tsunami-runups.json")))
print(f"NCEI tsunami database: {len(ev):,} events, {len(ru):,} run-ups")
NCEI tsunami database: 3,138 events, 35,129 run-ups
Example 1: share of each cause since 1900
s = sure[sure.year >= 1900]
print(s.cause.value_counts(normalize=True).head(6).round(3).to_string())
cause
earthquake 0.710
landslide 0.096
meteorological 0.064
earthquake and landslide 0.057
volcano 0.041
volcano and landslide 0.012
Since 1900, earthquakes caused 71.0% of probable and definite tsunamis, landslides 9.6% and meteorological events 6.4%. The meteotsunami share has grown as tide gauges began recording the small, weather-driven waves that rarely made the news before.
Example 2: earthquake depth
q = sure[(sure.causeCode == 1) & sure.eqDepth.notna()]
print(q.groupby(pd.cut(q.eqDepth, [0, 20, 40, 70, 300, 700])).maxWaterHeight.agg(["size", "median"]).round(2).to_string())
size median
eqDepth
(0, 20] 296 0.30
(20, 40] 365 0.50
(40, 70] 111 0.38
(70, 300] 32 0.17
(300, 700] 1 NaN
Among earthquake tsunamis, depth matters less than you might expect: the median maximum height is 0.3 m for earthquakes up to 20 km deep, 0.5 m for 20 to 40 km and 0.38 m for 40 to 70 km. Deeper earthquakes, below 70 km, raise smaller waves, a median of 0.17 m, because they move the sea floor less. Magnitude, on the validity page, makes far more difference.
Internal links
- Which tsunamis really happened — the codes and how sure each cause is
- The deadliest tsunamis — deaths by cause
- Run-ups of the 2011 tsunami — an earthquake tsunami's reach
- Earthquakes and plate boundaries — where the earthquakes behind most tsunamis happen